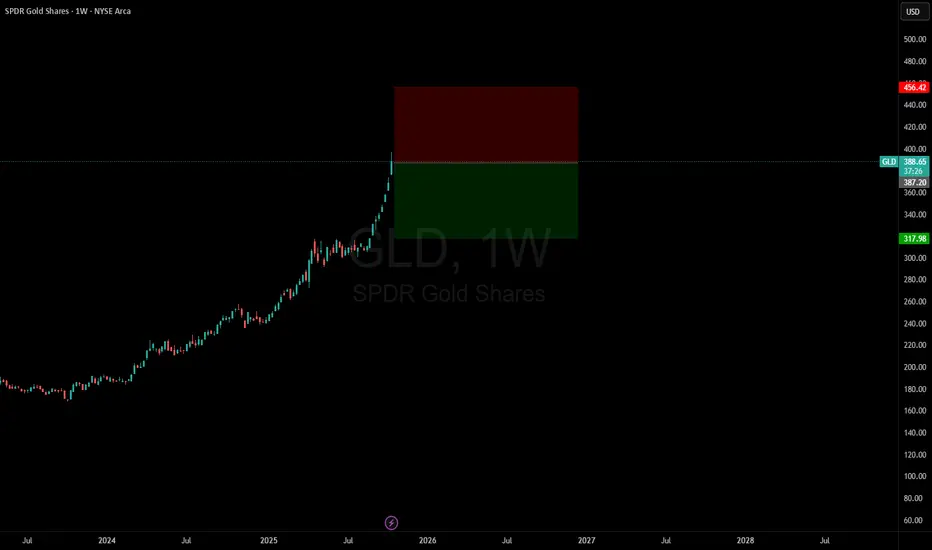
Short GLDGold is now over $4,200 and I believe there is a trade to the down-side.
Understand, it VERY hard to call a top in such a powerful bull market move. Most of the time, you WILL lose this trade.
Even when you do win these type of trades, the price action will usually go against you before it goes in the right direction.
It is a market. You WILL be tested.
That’s how price discovery works.
The truth is that if you're trying to outperform market-level returns, you MUST take risks.
GLD
(GBP/JPY – 2H timeframe):(GBP/JPY – 2H timeframe):
✅ Setup:
Price has broken slightly above the descending trendline.
Currently retesting that breakout area near 202.00.
Ichimoku cloud (yellow zone) ahead suggests a short-term resistance zone, but structure is turning bullish.
---
🎯 Targets (Upside)
1. Target 1: 203.50 – 203.80 → this matches my first marked “Target Point” (top of the yellow Kumo cloud and previous structure).
2. Target 2: 205.20 – 205.50 → this is my second “Target Point,” aligning with previous swing high resistance.
---
📈 Entry & Risk Plan
Entry: Near 202.00–202.10 (trendline retest zone).
Stop Loss (SL): Below 201.30 (previous support base).
Take Profit (TP1): 203.50
Take Profit (TP2): 205.30
---
⚖ Summary
Main entry: 202.00
TP1: 203.50
TP2: 205.30
SL: 201.30
Bias: Bullish (breakout + potential cloud entry signal).

Gold Vs MoneySupply: a chart Peter Schiff Doesn't want u to seegold has upside.. expecting it to push toward its real valuation all time high..
over time gold has performed poorly at preserving capital. but academically recognized inflationary environments could be what was missing.

XAUUSD 17-19 Oct 2025Gold Spot Price remaining strong with true zeros well below however price targets shifting slightly up into end of Week.
Monitoring 4238-4260 for Profit Taking & focusing on potential Long entries from with 4199, 4164 4130 4108 or 4075 & Below.
I do not foresee price achieving any move substantial below 4064-4021
*Not advice, personal thoughts ONLY.

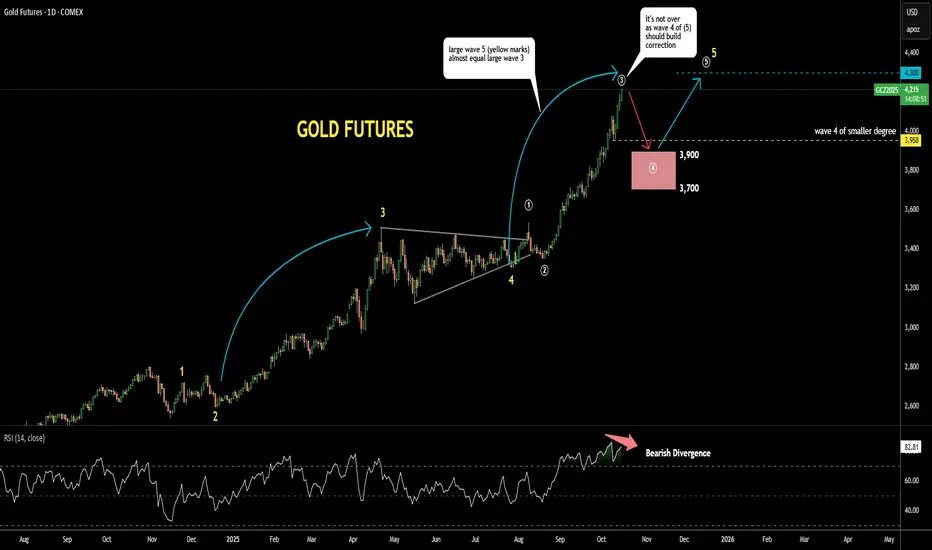
Gold Update 15OCT2025: RSI Hints at CorrectionGold continues to dominate headlines, printing new all-time highs one after another
The 4-hour Bearish Divergence earlier failed to halt the rally
Now, a Bearish Divergence has appeared on the daily time frame, as the latest price high was not confirmed by RSI
This signals that a peak may be forming
A corrective phase could soon unfold as wave 4 within the larger wave (5) structure
The expected retracement could reach the 38.2–61.8% Fibonacci zone of wave 3 of (5), targeting the pink box between $3,700 and $3,900
The low of the previous minor wave 4, near $3,958, may serve as initial support during the pullback
It is worth noting that the magnitude of wave (5) so far mirrors that of the prior large wave (3)
Therefore, the projected target for the final wave 5 of (5) remains around $4,300 as a conservative objective
However, if momentum extends further, wave 5 could evolve into an extended move and drive prices toward new record highs beyond that level
Silver Market Once in a Lifetime Breakout: 120/140 USD PT📌 Base case unchanged: I’m still targeting $125–$150 within 12–24 months. The next leg of the bull run should accelerate after the all-time-high (~$49–$50) breaks and sticks. Spot is circling the mid-$40s (recent highs ~$46–$47), so the setup is in place. 💎✨
🎯 Bottom line
Silver’s structural deficit + gold leadership + policy-driven cost inflation meet a fresh technical regime. The ATH break is the ignition; $65–$75 is the first destination, and the $125–$150 12–24M target stays live if real yields drift down and PV/electronics demand stays elevated despite thrifting. Manage the whipsaws; respect $38 as the cycle guardrail. BUY/HOLD bias remains warranted. 🚀💎🔥
________________________________________
📊 Technical Outlook (2-week candles)
• Structure: Multi-year Cup & Handle from 2011 → 2020 base → 2024/25 handle. The $40 neckline break is done; a weekly/monthly close > $49.50 flips the market into price discovery.
• Levels that matter:
— Resistance: $49–$50 (ATH), then $65–$75 (measured move / vacuum), interim supply near $57–$60.
— Support: $44.5–$45 (breakout retest), $41–$42 (former cap), deeper $38 and $34 (trend break if lost).
• Momentum breadth: Higher highs on price with constructive consolidation while gold prints records → classic GSR mean-reversion tailwind. 📈⚡
________________________________________
🧭 12–24 Month Path Outlook
Base (55%) – Break & run: Close above $50 triggers trend systems and discretionary chase → extension to $65–$75 by mid-’26, stair-step into $100–$125 by late ’26/early ’27; overshoot to $150 on macro squeeze. 🚀
Alt up (15%) – Blow-off: Parabolic sprint to $85–$100 immediately post-break, sharp retrace to high-$60s, then grind to $125–$150.
Pullback (25%) – Fakeout & reload: Failure at $49–$50, mean reversion to $41–$42 or even $38, rebuild positioning; timeline slips ~1–2 quarters.
Bear tail (5%) – Macro shock: USD spike + real-yield jump + PV air-pocket; lose $34 → cycle delay (target deferred, not canceled). ⚠️
________________________________________
🚦 Catalyst Scorecard — Visible & Hidden Drivers (0–10)
1. Fed path & real yields — 9.0/10 (Bullish)
The Fed cut 25 bps on Sept 17 (now 4.00–4.25%) and signaled scope for more easing this year; several officials reinforced that bias. Lower real yields are the single strongest tailwind for non-yielding metals. 🏦
2. U.S. Dollar trend — 6.0/10 (Net-Bullish for silver)
DXY has been firm the last two weeks, a minor headwind; but with the Fed easing bias, dollar upswings look tactical, not structural. Any USD rollover clears the runway. 💵
3. Gold leadership & GSR mean-reversion — 8.5/10 (Bullish)
Gold at/near record highs ~$3.75–$3.80k keeps silver in tow. GSR ~80–84 is elevated vs. bull-market medians → skew favors silver outperformance on a gold grind. 🪙⚖️
4. Structural deficit — 8.5/10 (Bullish)
Fourth straight sizable deficit; ~678 Moz cumulative drawdown since 2021. 2025 still projected to run a ~115–120 Moz deficit despite softer bar/coin demand. 📉📦
5. Industrial demand (PV/Electronics) — 7.5/10 (Bullish with nuance)
PV/electrical demand at record highs; PV up again in 2024 (+3% y/y) and installations broadened across 38 “>1GW” countries. Offsetting force: silver thrifting (0BB, copper plating) → another 10–12% loading cut likely in 2025. Net: total ounces still robust as capacity growth outpaces thrifting… for now. ☀️🔋
6. ETP/ETF flows — 7.5/10 (Bullish)
Global silver ETPs flipped to net inflows in 2024 (+62 Moz) and kept adding into 2025. SLV shows ~15,362 tonnes in trust as of Sept 26—a sizable base of “sticky” investment metal. 📊📈
7. LBMA & COMEX stocks / liquidity premia — 7.0/10 (Bullish)
LBMA silver in London: 24,646 t (Aug) — up m/m but well below pre-2020 peaks; COMEX registered ~196 Moz. Tight-ish float + delivery frictions can widen location premia during spikes. 🏭📦
8. Tariff & logistics regime — 7.0/10 (Bullish via inflation/frictions)
U.S. 50% copper tariff (Aug 1) lifts domestic copper premia and can indirectly affect by-product silver flows and refining economics. Recent gold bar tariff confusion also showed how policy can snarl bullion logistics; LBMA welcomed clarifications, and noted silver discussions continue—headline risk persists. 🚢⚙️
9. Base-metal supply shocks (by-product linkage) — 6.5/10 (Bullish)
Grasberg disruptions and Peru protest-related shutdowns point to emerging fragility in copper output; since much silver comes as a by-product, copper hiccups can tighten silver supply at the margin. ⛏️🌍
10. Mexico policy/permitting — 6.0/10 (Bullish later, volatile now)
World’s top silver producer remains mired in regulatory overhang; exploration still depressed post-2023 reforms. Any genuine permitting thaw would be years from ounces—near-term effect is restraint. 🇲🇽📜
11. India retail/investment demand — 6.5/10 (Bullish)
Silver hitting record rupee highs; local ETFs up ~50%+ YTD; retail investment +7% y/y in H1’25. Seasonal tailwinds into festivals. 🎉🇮🇳
12. China macro & manufacturing — 5.5/10 (Mixed)
Electronics appetite is steady, PV leadership intact; property stress caps jewelry, but investment demand remains opportunistic. Net: supportive on dips, headline-sensitive. 🏗️🇨🇳
13. Systematic/CTA & options positioning — 6.0/10 (Volatility amplifier)
Trend models chased the $40 break; dealer gamma turns negative above $45–$47 at times, inviting intraday whipsaws. 🎯📉📈
14. Geopolitics (Ukraine/Mideast/Taiwan) — 5.5/10 (Event-Bullish)
Safe-haven jolts remain episodic; they matter more after the ATH triggers chase behavior. 🌍🔥
________________________________________
🧨 Hidden (under-traded) catalysts
• GSR compression trade: Once $50 breaks, programmatic rebalancing from gold to silver can accelerate relative gains. (GSR in the 60s pulls silver deeper into triple digits fast.) ⚖️💥
• By-product elasticity: Copper policy & outages (tariffs, mine incidents) can reduce silver by-product feed even as PV demand hums—this is not fully priced. 🔧⛏️
• Vault/warehouse microstructure: LBMA/COMEX stock changes vs. delivery notices can suddenly widen time/location spreads → sparks short-term basis fireworks that lift spot. 📦⏳
________________________________________
🛠️ Positioning & Execution
• Core: BUY/HOLD core metal exposure; add on $44–$45 retests; reload heavier on $41–$42.
• Breakout tactics: On a weekly close > $50, ride call spreads (e.g., $60/$90 9–15M out on SI or SLV) or risk-reversals (sell $35 puts to fund $80–$100 calls).
• Risk controls: Invalidate momentum if weekly close < $38; cut leverage.
________________________________________
🧩 Fundamental NOTES
• Spot context: XAG/USD ~$46, 52-week range ~$28–$46.7. ATH ~$49–$50 (1980/2011).
• Deficit math: Metals Focus/Silver Institute show fourth straight deficit; 2025 deficit ~117 Moz amid record industrial demand and only modest supply growth.
• Supply: 2024 mined = 819.7 Moz; 2025e ≈ 835.0 Moz (+1.9% y/y). Primary mine share keeps slipping; AISC fell in 2024 (by-product credits).
• PV nuance: Silver loadings ↓ ~10–12% in 2025e, but global PV installations broadened; total silver ounces into PV remain lofty even as intensity falls.
• Vaults/ETFs: LBMA London holdings 24,646 t (Aug). SLV metal in trust 15,361.84 t (Sep 26). COMEX registered ~196 Moz.
• Macro winds: Fed cut and may cut more in 2025 → lower real yields + easier USD path.
• Policy kicker: U.S. copper tariffs live; gold bar tariffs clarified after August confusion; silver remains under policy watch—any mis-classification can jolt premia.
________________________________________

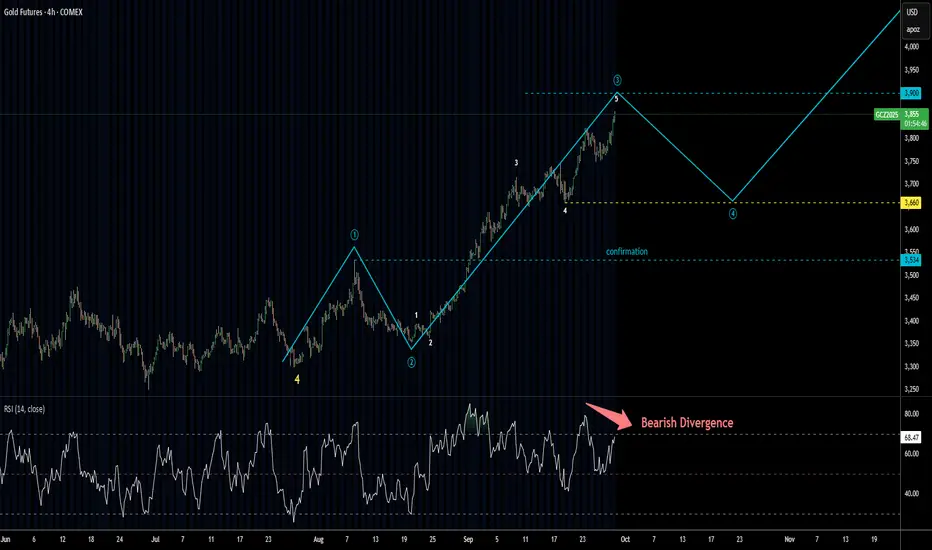
Gold Update 29SEP2025: Top Is Soon, Then PullbackGold Futures are following the projected path closely
The first target at $3,900 is now just "miles" away
This level could mark the top of wave (3) of ((5))
After that, we might see a pullback to around $3,660 in wave (4) of ((5)),
which typically revisits the low of the smaller wave 4
On the 4-hour chart, RSI shows bearish divergence,
as it fails to confirm the new high at $3,859 with a lower peak
Despite this signal, the market could still reach the $3,900 level
Once wave (4) of ((5)) completes,
we can reassess and project wave (5) of ((5)) —
which might form as a triangle or another complex correction.
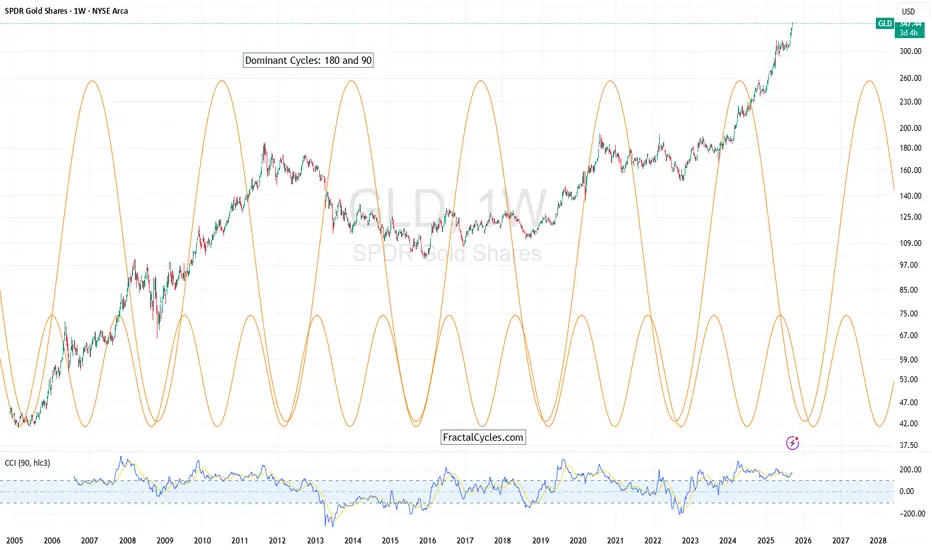
GLD Cycle Analysis – Dual Opportunities from 180 & 90-Week CycleThis chart highlights two dominant rhythms in GLD (SPDR Gold Shares):
The 180-week cycle, which has reliably pinpointed major long-term buy opportunities over the past two decades. Each time price has descended into these troughs, patient investors were rewarded with strong, multi-year rallies.
The 90-week cycle, nested within the larger one, has provided shorter-term opportunities for investors and swing traders. These mid-cycle lows often marked excellent entry points for those looking to capture medium-range gains without waiting for the full 180-week reset.
Takeaway:
Cycles matter - the 180-week rhythm has been the foundation for long-term positioning, while the 90-week cycle has created multiple shorter-range accumulation windows. Both have worked hand-in-hand to map gold’s path higher.
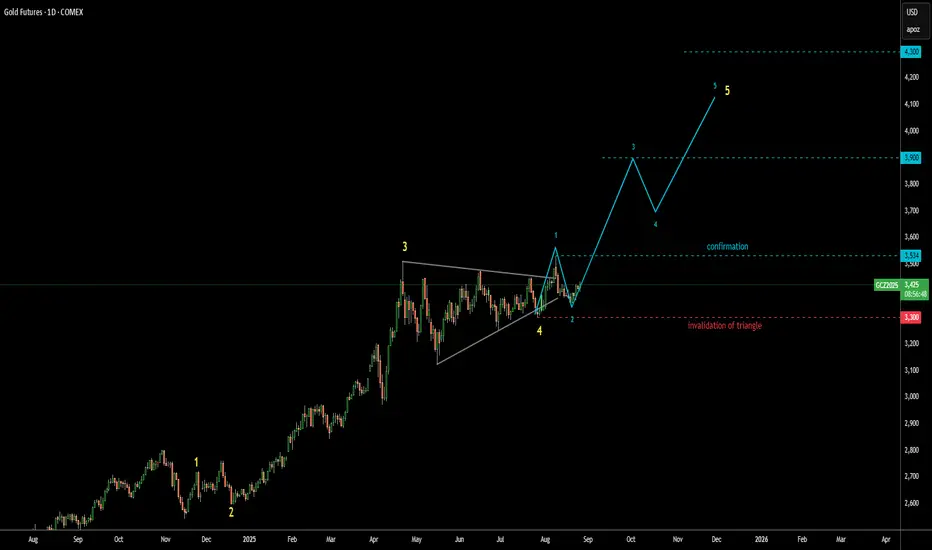
GOLD MY VIEW NOTICE THE MATH !!The chart posted is that of spot GOLD I have not changed the wave labeling and still have the targets posted see targets highlighted This should see GLD print maybe 350 Before it starts to deflate .I will be long puts at some point this week .In GOLD

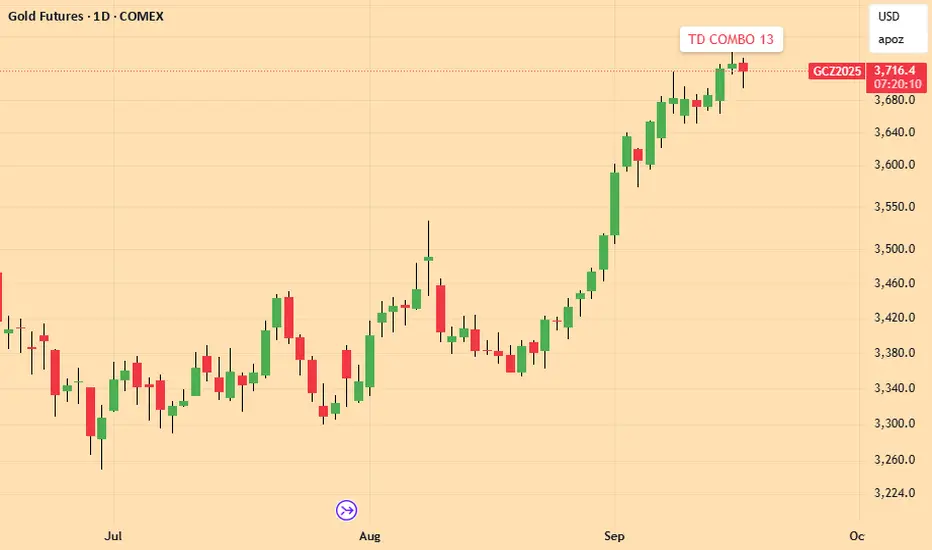
GOLD : SELL TD COMBO 13 posted yesterday 16th SeptemberThe famous Tom DeMark indicator posted a 13 Countdown on Tuesday 16th September, meaning that Gold has entered a selling area.
Day 25 — Trading Only S&P Futures | Gold’s Rally Raises FlagsWelcome to Day 25 of Trading Only S&P Futures!
Today started strong with an overnight short and continued by taking longs at major support levels. With the FOMC blackout period in effect, I leaned bullish but stayed selective, waiting for the 5-min MOB to hit before entering. That trade paid off and I wrapped the day at +264.83.
Still, there’s a cautionary note: gold just hit a record high above $3,633/oz, and that could be signaling underlying stress in the markets. Something to keep an eye on as we move forward.
🔑 Key Levels for Tomorrow
Above 6480 = Remain Bullish
Below 6465 = Flip Bearish
📰 News Highlights
SPOT GOLD EXTENDS GAINS, LAST UP 1.3% TO HIT A RECORD HIGH OF $3,633.65/OZ

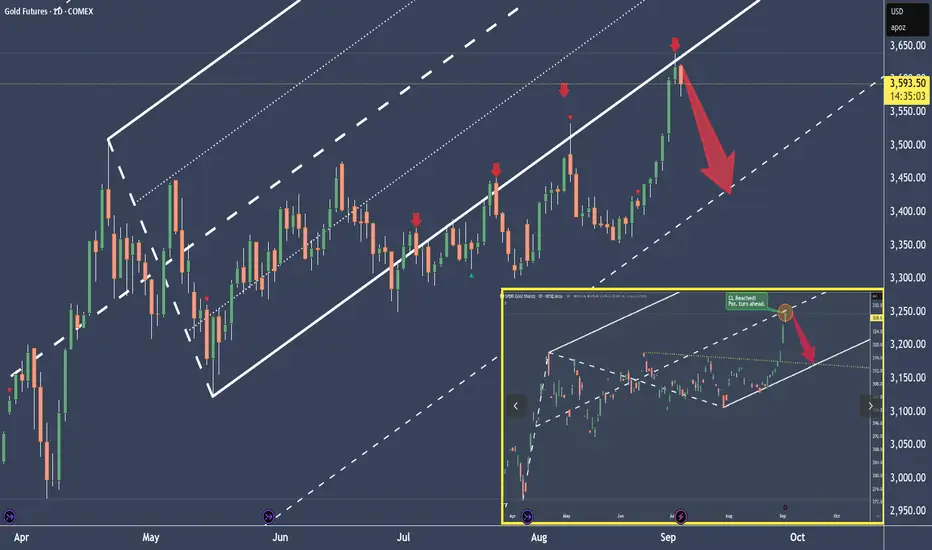
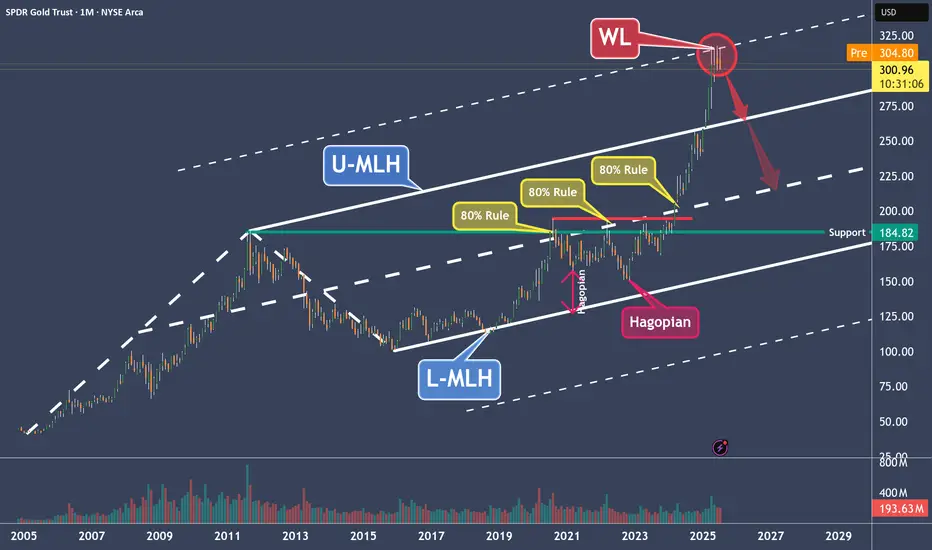
A Gold/GLD Drop Scenario You Should Not IgnoreSometimes you don't need a ton of information.
Sometimes, it's just the right moment when a few facts come together, and you make up your mind.
That's the case now with Gold for me.
We know that the behavior changed when Gold left the Fork in July.
We also know that if price leaves a Fork, it's highly possible we’ll see a test/re-test at the L-MLH, the lower median line parallel.
Additionally, Allan H. Andrews, the inventor of the Median Lines/Forks, wrote back then that price could also crawl along the parallel line for a longer period. And if price can't manage to jump back into the Fork—regaining the trajectory of the slope—it will trade in the opposite direction sooner or later.
Last but not least: I checked GLD too. Surprisingly it reached the Centerline just yesterday (See screenshot in the right lower corner of the Chart). So price has a high tendency to turn in the opposite direction when balanced again.
So, there you have it.
I’m planning a short, with profits at the WL as my first target.
But what if it goes wrong, if price climbs higher?
Well, then I’ll probably get stopped out, which is nothing more than part of this business.
Any questions?
Don't hesitate to ask me. It's the only way humans learn—by asking questions.
Cheers
§8-)
Gold maybe ready to memeGold has a potentially explosive setup if clears a level directly above. It can meme to $4k

Gold Update 26AUG2025: Bullish Confirmation Above $3,534 The gold futures price has made a U-turn as it didn't trigger Triangle's invalidation at $3,300
This bounce back could be a harbinger of wave 3 within the larger degree wave 5
It will be confirmed once upmove breaks above the top of wave 1 beyond $3,534
I erased the complex correction scenario as the price might be taking off right now
I added the breakdown of the upcoming large wave 5 into smaller 5 waves inside
Target range remains intact between $3,900 and $4,300
Gold Deep Dive: Cycles, Correlations, Divergences, SymmetryGold has been in a raging bull market and almost up over 100% since its monthly bullish engulfing candle.
Gold sniffing out week monetary policy and rallying on the back of easing global monetary policy.
Historically from a trading standpoint, Gold is extremely overbought and could be 4-8 weeks away from a considerable pullback of 15-30% .
Many Signals such as symmetrical moves, Monthly overbought RSI, Copper / Gold Divergence, GDX resistance is telling us to use caution and trim long profits.
It does seem like gold wants $3500 before it has a reversal back down. We are looking for a liquidity sweep of the ATH as a possible short zone. (Not FA advice)
Once gold resets some indicators and allows longer term moving average to catch up it will likely keep pushing but we only for see that in mid to late 2026.
If we make a new high....we don't see much upside for the next 3-6 months.

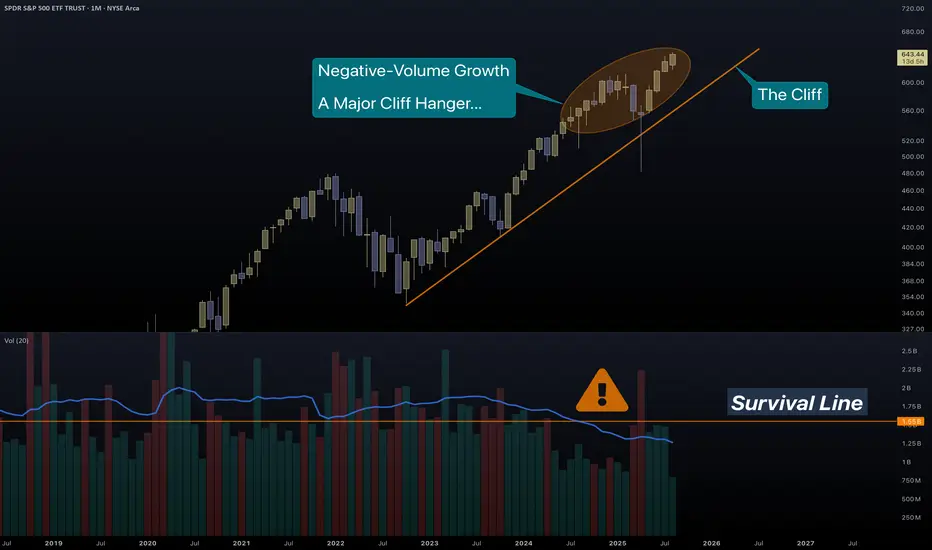
SPY | Leap of Doom?SPY just jumped...
The wrong way up!
To sustain you must conserve. To climb up a hill, you need energy, resources like food and water. The energy they give you far out-weighs their absolute mass. Therefore it makes sense for you to carry them.
And they have taken you very far...
But now you have run out of energy.
Price growth needs transaction volume to have strength and meaning.
You are too light(headed) to realize that moving further up is a dead-end.
THIS IS NOT SOMETHING SMALL.
SPY is one of the largest Funds in the world. A first-ever major violation of volume trend, in such a big index, must not be ignored. Imagine what is happening underneath...
Look at some examples:
NVDA
The most massive of companies, has a multi-year issue with volume.
MSFT
Unlike its first growth, Microsoft has a tremendous loss of strength in volume metrics.
Such long-term drop in volume means that companies offload real stocks for cheap futures .
We witness the same with Bitcoin...
And gold...
Not quite doomed yet, but troublesome still.
TSLA
Tesla with their shiny and financially pointless cars, has made a pointless growth. Just like many stocks as you will soon realize.
AAPL
The masses, even though their name suggests that they have some matter, in reality they don't. 10% of people have 90% of wealth. Investors have long left Apple, leaving the hoard inside to bubble up the dream.
There is more and more proof that the Fab5 (well the Fab500 as we can see from SPY/SPX) are replacing stocks with derivatives. Real money replaced by weapons of mass destruction, just like Warren Buffett said.
Good luck to us all...
PS. Something irrelevant to stocks, but relevant to the fundamentals of investing in AAPL.
Judging by the recent UI decisions, they trapped the users in bubbles and they are unable to see the truth. Brilliantly, they changed the name of soap bubbles to liquid glass. (bubbles are shiny, crystals are rough).
As a long-time Apple user, now not much of an Apple lover, I know quite well the changing philosophy of them. iPhone (and all products) began as a phone for the "smart" ones and ended up the No1 desire for the masses.
After a decade, I have switched to Fedora Silverblue for 90% of my leisure.
GOLD: Squeeze to Rate Cut, then Blast-Off to $4200?The price of gold, a classic safe-haven asset, is currently in a state of flux due to several interconnected factors. Looking at future events and fundamentals, we can anticipate how they might impact its price points.
Powell's Rate Cut
An anticipated rate cut from Federal Reserve Chairman Jerome Powell on 17SEP25 is a key bullish signal for gold. Lower interest rates typically decrease the opportunity cost of holding non-yielding assets like gold, making them more attractive compared to interest-bearing bonds. If JPow begins to drop rates in September (and is dovish in comments regarding further cuts), we could begin to see the beginning of gold's next measured move to around $4200 (see purple target). If JPow doesn't cut, doesn't cut enough, or cuts but is extremely hawkish towards further cuts; expect a pullback towards the 200-day moving average and further ranging for a period until the next Fed Chairman is confirmed.
President Trump has recently called for the Federal Reserve to make significant cuts; in one instance stating that rates should be lowered by three percentage points from their current range. As of 19AUG25, Treasury Secretary Scott Bessent has indicated 11 possible candidates for the next Fed Chair position; expect that when confirmed, the next Fed Chair may significantly reduce rates (but do not assume the next Fed Chair will cut as deep as three percentage points).
BRICS Monetary Competition
Additionally, the push for de-dollarization by BRICS nations is a significant long-term driver for gold. Countries like China and Russia are actively increasing their gold reserves to diversify away from the U.S. dollar, creating sustained demand. This monetary competition fundamentally alters gold's role, positioning it as a key component of a new, multi-polar financial system. As central banks continue to accumulate gold, it strengthens the metal's standing as a universal reserve asset. This trend is likely to provide a strong floor for gold prices around its 200-day moving average, and any significant moves toward a gold-backed BRICS currency could lead to a monumental re-evaluation of gold's value, potentially pushing its price to the $4,000/oz range or higher over time.

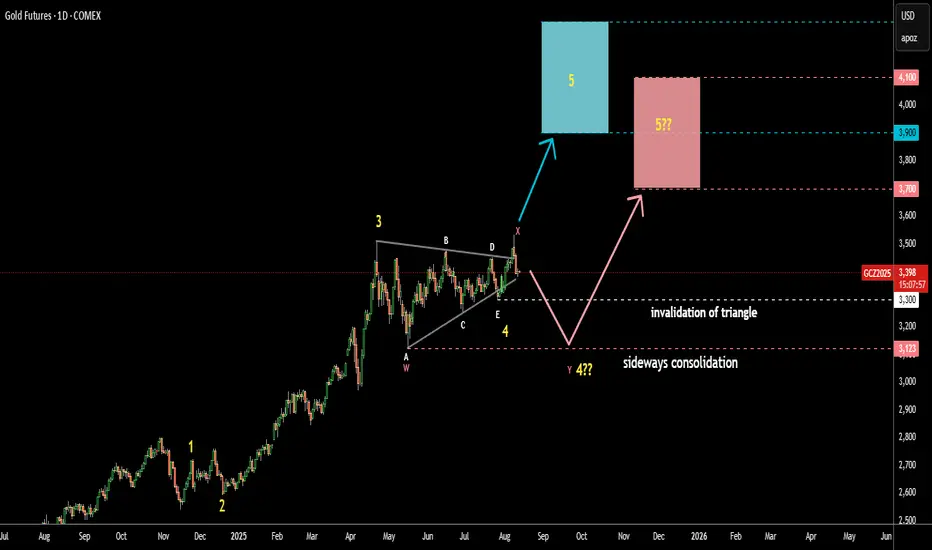
Gold Update 13AUG2025: Risk of Sideways Consolidation Last Friday, August 8, the price failed to progress above the April top as it closed underneath. Hence, there are two possible scenarios from here:
The price could have just completed the first wave up in a larger wave 5, and we may see a retracement. This setup remains valid as long as the price stays above the last wave E of the Triangle at $3,300.
The large sideways consolidation (WXY) might take shape, potentially retesting the bottom of wave A at $3,123. In this case, the target could drop lower, with potential support in the pink box area between $3,700 and $4,100.
Which one do you think plays out?
Gold Update 06AUG2025: Price Tests ResistanceThe Triangle pattern in gold futures remains highly reliable.
Wave E held above the low of Wave C, maintaining the structure.
Price is now testing the Triangle’s upper resistance.
A breakout above this level would confirm the bullish setup.
The target zone remains unchanged: $3,900–$4,300.

GLD – Why Gold Is a Clear Short to MePrice moved from the Lower Median Line (L-MLH) up to the Centerline, fulfilling the 80% rule.
Then we had two Hagopians, which sent price right back to the Centerline.
After the breakout above the Centerline, the next target was the Upper Median Line Parallel (U-MLH), which was reached rather quickly.
Finally, price broke above the U-MLH and was pulled up toward the Warning Line (WL).
Is this the end of the happy story?
I think so—because Gold has now reached its 2nd standard deviation, and there’s probably no more gas left in the tank.
The Trade:
- A logical target is the U-MLH.
- A secondary target is the Centerline.
At the very least, if you're long, this might be a good time to take some profits—because no tree grows to the moon.
For further details, I will follow-up with a Video explanation - See my Signature.
$GLD short term top in $260-148 target on the downsideAMEX:GLD looks a bit extended here. I could see the possibility of GLD falling back to the $260 support at a minimum and maximum all the way down to $148
The $209 support would be the 50% retracement of the recent run. I like that as a level for a bounce.
Let's see where we end up.

BEAR TREND COMMING FOR GOLD trader in 28.july . 2025
XAUUSD : in my expectation and analysis i tend to see gold to make bear run for short to med term ,, target 2850 USD
good luck

Gold Update 28 JULY 2025: On The EdgeGold is accurately following the path shown in my earlier post.
Wave D respects the triangle rules, staying below the top of wave B.
Wave E appears nearly complete, even piercing the A–C support line.
This is acceptable as long as wave E stays above the wave C low at $3,251.
Keep a close eye on this invalidation point.
The target range remains unchanged: $3,900–$4,300.
