Commodity Futures Trading in the Global Market1. Historical Evolution of Commodity Futures Trading
Ancient Trading Roots
Commodity trading dates back thousands of years, with evidence from Mesopotamia and Ancient Greece showing contracts for the future delivery of crops.
In Japan during the 17th century, rice futures were traded at the Dojima Rice Exchange, one of the earliest organized futures markets.
The Chicago Board of Trade (CBOT)
Established in 1848, CBOT standardized forward contracts into formal futures contracts.
Grain farmers in the U.S. Midwest needed to protect themselves against unpredictable prices, while buyers wanted stable supply at predictable rates.
Futures contracts solved this by locking in future delivery prices, reducing uncertainty.
Expansion to Other Commodities
After grains, futures expanded to include livestock, metals, energy, and eventually financial instruments like currencies and interest rates.
By the late 20th century, futures markets had become central not just to commodities but also to global finance.
2. Fundamentals of Commodity Futures
What is a Futures Contract?
A futures contract is a standardized agreement to buy or sell a commodity at a specific price on a future date, traded on an organized exchange.
Key features:
Standardization – Each contract specifies quantity, quality, and delivery terms.
Margin and Leverage – Traders post margin (collateral) to participate, giving them leverage.
Clearinghouses – Ensure counterparty risk is minimized.
Expiration & Settlement – Contracts either settle physically (delivery of the commodity) or financially (cash-settled).
Types of Commodities Traded
Agricultural Commodities – Wheat, corn, soybeans, coffee, sugar, cotton.
Energy Commodities – Crude oil, natural gas, gasoline, heating oil.
Metals – Gold, silver, copper, aluminum, platinum.
Soft Commodities – Cocoa, rubber, palm oil.
3. Key Participants in Global Commodity Futures
1. Hedgers
Farmers, miners, oil producers, airlines, and manufacturers use futures to protect against price volatility.
Example: An airline buys jet fuel futures to lock in prices and protect against oil price spikes.
2. Speculators
Traders who take positions based on price expectations, seeking profits rather than delivery.
Provide liquidity to the market but also increase volatility.
3. Arbitrageurs
Exploit price discrepancies across markets or between spot and futures prices.
Help align prices globally.
4. Institutional Investors
Hedge funds, mutual funds, pension funds use commodity futures for diversification and inflation hedging.
5. Market Makers & Brokers
Facilitate transactions, ensuring continuous liquidity.
4. Global Commodity Futures Exchanges
United States
Chicago Mercantile Exchange (CME Group) – World’s largest futures exchange, trading agricultural, energy, metals, and financial futures.
New York Mercantile Exchange (NYMEX) – Key hub for energy futures like crude oil and natural gas.
Intercontinental Exchange (ICE) – Specializes in energy and soft commodities like coffee, cocoa, and sugar.
Europe
London Metal Exchange (LME) – Benchmark for industrial metals like copper, aluminum, and nickel.
Euronext – Trades agricultural and financial futures in Europe.
Asia
Shanghai Futures Exchange (SHFE) – Major player in metals, energy, and chemicals.
Multi Commodity Exchange of India (MCX) – Leading Indian commodity exchange.
Tokyo Commodity Exchange (TOCOM) – Focuses on energy, metals, and rubber.
Singapore Exchange (SGX) – Emerging hub for global commodities, especially Asian benchmarks.
5. Mechanics of Commodity Futures Trading
1. Opening a Position
Long position (buy futures) if expecting prices to rise.
Short position (sell futures) if expecting prices to fall.
2. Margin System
Initial margin: Upfront collateral to open a position.
Maintenance margin: Minimum balance required.
Daily mark-to-market adjusts accounts based on price movements.
3. Settlement Methods
Physical delivery: Actual exchange of the commodity.
Cash settlement: Price difference settled in cash, common for financial futures.
4. Price Discovery
Futures markets reflect expectations of supply and demand.
Example: Rising oil futures may signal geopolitical risks or expected shortages.
6. Importance of Commodity Futures in the Global Economy
1. Risk Management
Producers and consumers hedge against adverse price swings.
2. Price Discovery
Futures prices act as benchmarks for global trade.
Example: Brent crude futures influence oil prices worldwide.
3. Market Liquidity
Continuous trading provides deep liquidity, enabling efficient transactions.
4. Economic Indicators
Futures prices offer insights into future economic trends (e.g., rising copper prices suggest industrial growth).
7. Challenges and Criticisms
1. Speculative Excess
Excessive speculation can cause price bubbles, hurting real producers and consumers.
Example: 2008 oil price surge partly attributed to speculative trading.
2. Volatility & Market Shocks
Futures markets can amplify volatility, especially during geopolitical or weather-related events.
3. Market Manipulation
Large players can influence prices (e.g., "cornering the market").
4. Regulatory Concerns
Need for global harmonization as futures markets are interconnected.
8. Regulation of Global Commodity Futures
United States
Commodity Futures Trading Commission (CFTC) oversees futures and options markets.
Europe
European Securities and Markets Authority (ESMA) sets regulations under MiFID II.
Asia
Each country has its regulator: SEBI (India), CSRC (China), FSA (Japan).
Global Cooperation
IOSCO (International Organization of Securities Commissions) works on harmonizing standards.
9. Technological Transformation in Commodity Futures
Electronic Trading
Transition from open-outcry trading floors to electronic platforms like CME Globex.
Algorithmic & High-Frequency Trading (HFT)
Now dominate volumes, enabling faster price discovery but raising flash crash risks.
Blockchain & Smart Contracts
Potential to streamline settlement, reduce fraud, and improve transparency.
10. Case Studies
Oil Futures (NYMEX WTI & ICE Brent)
Key benchmarks for global crude oil pricing.
The 2020 COVID-19 crisis saw WTI futures turn negative, highlighting the complexities of storage and physical delivery.
Gold Futures (COMEX)
A hedge against inflation and financial instability.
Demand spikes during geopolitical crises or economic uncertainty.
Agricultural Futures (Chicago Board of Trade)
Corn, wheat, and soybean futures directly impact global food prices.
Conclusion
Commodity futures trading is more than just speculation—it is the nervous system of the global economy. From farmers securing prices for their harvest to airlines hedging jet fuel, and from speculators driving liquidity to regulators ensuring stability, futures markets are indispensable.
They provide transparency, risk management, and global price discovery. Yet they also bring challenges of volatility, speculation, and regulatory complexity.
Looking ahead, technological innovation, sustainability concerns, and the rise of emerging markets will reshape global commodity futures trading. Its importance will only grow as commodities remain the backbone of human survival, industrialization, and energy security.
Globalmarket
Globalization & Its Impact on World TradeIntroduction
Globalization is one of the most powerful forces shaping our modern world. It refers to the increasing interconnectedness of economies, cultures, societies, and political systems across borders. Over the past few decades, globalization has accelerated, driven by technological progress, liberalization of trade policies, advances in transportation, and the digital revolution.
When we talk about world trade, globalization is at its heart. Trade is no longer limited to neighboring countries or regional exchanges. Today, goods, services, investments, information, and even people move across continents in seconds. From a smartphone assembled in China with parts sourced from South Korea, Japan, and the U.S., to online freelancing platforms connecting Indian programmers with European firms—globalization has made the world a single marketplace.
But globalization is not a one-way street. While it has created unprecedented opportunities for economic growth, innovation, and cultural exchange, it has also raised challenges like inequality, loss of local industries, environmental pressures, and geopolitical tensions. In this essay, we will explore globalization in detail, analyze its impact on world trade, examine its benefits and drawbacks, and discuss its future.
Understanding Globalization
At its core, globalization means the integration of national economies into the international economy. This integration takes place through trade in goods and services, cross-border investment, capital flows, migration, and the spread of technology.
Globalization can be studied under four major dimensions:
Economic Globalization – Expansion of international trade, multinational corporations, global supply chains, and investment flows.
Cultural Globalization – Exchange of ideas, lifestyles, media, fashion, music, and cultural practices.
Political Globalization – Formation of international institutions like the United Nations, WTO, IMF, and global treaties.
Technological Globalization – Spread of innovations such as the internet, AI, e-commerce, and faster transportation systems.
While all four matter, economic globalization—especially in terms of trade—is the most direct and visible form.
Historical Background of Globalization in Trade
Globalization is not entirely new. History shows earlier waves of globalization that transformed trade:
The Silk Road (200 BC – 1400s): Ancient trade routes connected China, India, the Middle East, and Europe, allowing silk, spices, and precious metals to move across continents.
The Age of Exploration (15th – 18th Century): European powers like Spain, Portugal, Britain, and the Netherlands expanded global trade through colonization and sea routes, integrating Asia, Africa, and the Americas into global commerce.
The Industrial Revolution (18th – 19th Century): Mass production, railways, and steamships expanded international markets. Colonies became suppliers of raw materials and consumers of finished goods.
Post-World War II Globalization (1945 onwards): Creation of institutions like the IMF, World Bank, and GATT (later WTO) encouraged trade liberalization. Multinational corporations and free-trade agreements accelerated integration.
21st Century Digital Globalization: E-commerce, fintech, blockchain, and digital platforms (like Amazon, Alibaba, and Zoom) allow even small businesses and individuals to participate in global trade.
Drivers of Globalization in Trade
Several factors have fueled globalization and its direct impact on trade:
Technological Advancements:
Container shipping reduced logistics costs.
Internet and digital payment systems enabled e-commerce.
Artificial Intelligence (AI) and automation optimize supply chains.
Trade Liberalization:
Reduction of tariffs and quotas through agreements like WTO and regional FTAs (NAFTA, EU, RCEP).
Countries opening their economies for foreign investments.
Rise of Multinational Corporations (MNCs):
Companies like Apple, Toyota, Nestlé, and Samsung operate globally, sourcing materials and selling products worldwide.
Global Supply Chains:
Products are no longer made in one country but are assembled from components sourced across borders.
Financial Integration:
Cross-border investments and global stock markets attract capital flows worldwide.
Labor Migration:
Workers moving to different countries bring remittances and contribute to global services trade.
Positive Impacts of Globalization on World Trade
Globalization has transformed world trade in many positive ways:
1. Increased Volume of Trade
International trade has grown exponentially. According to WTO data, world merchandise trade was around $62 billion in 1950, but by 2022 it exceeded $25 trillion.
2. Access to Larger Markets
Businesses can sell goods and services worldwide, reaching millions of consumers instead of being limited to local demand.
3. Specialization & Comparative Advantage
Countries focus on producing what they are best at (comparative advantage). For example:
India excels in IT and services.
China in manufacturing.
Middle East in oil exports.
This leads to efficiency and cheaper prices for consumers.
4. Job Creation
Global trade has generated millions of jobs worldwide, from factory workers in Asia to software developers in Eastern Europe.
5. Cheaper Consumer Goods
Global competition and supply chains lower production costs, making products like smartphones, clothes, and electronics affordable.
6. Technology Transfer
Developing nations benefit from foreign direct investment (FDI) and the transfer of advanced technology from developed countries.
7. Cultural Exchange
Along with goods, globalization spreads culture, tourism, and international collaboration.
Negative Impacts of Globalization on World Trade
While globalization has benefits, it also has serious downsides:
1. Unequal Benefits
Developed countries often gain more than developing nations.
Rich corporations dominate markets, while small local industries struggle.
2. Loss of Domestic Industries
Cheap imports hurt local producers. For instance, small textile industries in some African nations declined due to mass imports from Asia.
3. Job Displacement
Outsourcing and automation reduce job opportunities in certain sectors, especially in developed countries.
4. Environmental Damage
Global shipping and industrial activity increase carbon emissions.
Deforestation and overuse of resources to meet global demand cause ecological harm.
5. Exploitation of Labor
Low-cost manufacturing in developing countries often involves poor working conditions and low wages.
6. Economic Dependence
Countries relying too much on global markets face risks during global recessions or supply chain disruptions (e.g., COVID-19 pandemic).
7. Cultural Homogenization
Local traditions, foods, and industries are often overshadowed by global brands like McDonald’s, Coca-Cola, or Netflix.
Case Studies: Globalization in Action
1. China – The World’s Factory
China’s economic rise since the 1980s is the clearest example of globalization-driven trade success. Its manufacturing power and export-led growth turned it into the world’s second-largest economy.
2. India – IT & Services Hub
India benefited from globalization through its IT outsourcing and services sector. Companies like Infosys, Wipro, and TCS provide software services to global clients.
3. European Union – Regional Globalization
The EU demonstrates how regional economic integration boosts trade. Free movement of goods, services, capital, and labor creates a single market.
4. COVID-19 Pandemic – Fragile Globalization
The pandemic disrupted supply chains, revealing over-dependence on certain regions. For example, shortages of medical equipment and semiconductors exposed vulnerabilities in global trade.
The Role of International Institutions
Global trade under globalization is supported by several institutions:
World Trade Organization (WTO): Regulates trade rules and resolves disputes.
International Monetary Fund (IMF): Provides financial stability and emergency funding.
World Bank: Funds development projects.
Regional Trade Agreements: NAFTA/USMCA, European Union, ASEAN, RCEP encourage trade cooperation.
Future of Globalization & World Trade
Globalization is evolving, not ending. Key future trends include:
Digital Globalization: E-commerce, fintech, AI, blockchain, and digital currencies will dominate trade.
Green Trade: Shift towards renewable energy, electric vehicles, and carbon-neutral policies.
Regionalization: Countries are diversifying supply chains, moving towards regional hubs (e.g., “China+1” strategy).
Geopolitical Tensions: U.S.-China rivalry, Russia-Ukraine war, and sanctions may reshape trade flows.
Inclusive Globalization: Focus on reducing inequality and ensuring fair trade practices.
Conclusion
Globalization has profoundly impacted world trade, reshaping how nations, businesses, and individuals interact economically. It has created opportunities for unprecedented growth, innovation, and cultural exchange, but it also poses challenges of inequality, environmental damage, and vulnerability to crises.
The key lies in balancing globalization’s benefits with responsible policies. Sustainable globalization should focus on inclusive growth, fair trade, environmental protection, and technological innovation.
In essence, globalization has made the world more connected than ever before, and while its impact on trade is both positive and negative, it will continue to shape the future of economies and societies in profound ways.
Global Stock Market IndicesIntroduction
When people talk about “the market going up” or “the market crashing,” they are usually referring to a stock market index rather than individual stocks. Indices like the Dow Jones, S&P 500, FTSE 100, Nikkei 225, or Sensex are names that investors, traders, and even common people hear almost daily in financial news.
But what exactly are these indices? Why are they so important? And why do global investors track them so closely?
In this article, we will explore everything about Global Stock Market Indices – their definition, types, major global benchmarks, importance in global finance, and how they influence investment decisions.
1. What is a Stock Market Index?
A stock market index is basically a measurement tool that tracks the performance of a group of selected stocks. These stocks represent either a market, a sector, or a theme.
Imagine an index as a basket of stocks chosen to represent a larger part of the economy.
For example, India’s Sensex tracks 30 large, financially strong companies from the Bombay Stock Exchange (BSE). Similarly, the S&P 500 tracks 500 of the largest U.S. companies.
The purpose of indices is to give investors and policymakers a quick snapshot of how a market is performing without analyzing thousands of individual stocks.
Key Features of Indices
Representation – They represent a portion of the economy (large-cap, mid-cap, small-cap, or sectoral).
Benchmark – Used as a benchmark to measure portfolio or fund performance.
Economic Indicator – Indices reflect overall economic health and investor sentiment.
Passive Investment Tool – Many funds (like ETFs) simply mimic indices instead of picking individual stocks.
2. How Are Indices Constructed?
Indices are not random; they are carefully designed using certain methodologies:
a) Market Capitalization Weighted
Stocks are given weight based on their market capitalization (price × number of shares).
Example: S&P 500, Nifty 50.
Larger companies influence index movement more.
b) Price Weighted
Stocks with higher price per share have greater weight, regardless of company size.
Example: Dow Jones Industrial Average (DJIA).
c) Equal Weighted
Every stock in the index has equal weight.
Provides a more balanced view of all companies.
d) Sectoral or Thematic
Some indices focus on specific industries like IT, banking, or energy.
Example: NASDAQ 100 has a heavy focus on technology companies.
3. Why Are Stock Market Indices Important?
Benchmark for Investors – Investors compare their portfolio returns with indices to check performance.
Example: If Nifty 50 gave 12% returns and your mutual fund gave 9%, the fund underperformed.
Economic Sentiment Gauge – Indices reflect how investors feel about the economy. Rising indices = confidence, falling indices = fear.
Helps Passive Investing – Index funds and ETFs directly replicate indices, making investing simple.
Risk Diversification – Indices spread risk across multiple companies and sectors.
Global Influence – Movement in one country’s major index often affects others (e.g., U.S. indices influence global markets).
4. Major Global Stock Market Indices
Let’s go around the world and understand the top global stock market indices.
United States
The U.S. stock market is the world’s largest and most influential.
Dow Jones Industrial Average (DJIA)
Oldest index (founded in 1896).
Tracks 30 blue-chip U.S. companies.
Price-weighted index (high-priced stocks influence more).
Companies include Apple, Microsoft, Goldman Sachs.
Seen as a symbol of American industrial and corporate strength.
S&P 500 (Standard & Poor’s 500)
Tracks 500 of the largest publicly traded U.S. companies.
Market-cap weighted index.
Considered the best single indicator of the U.S. stock market.
Covers ~80% of total U.S. market capitalization.
NASDAQ Composite
Tracks 3,000+ companies listed on the NASDAQ exchange.
Technology-heavy index (Apple, Amazon, Google, Tesla, Meta).
Reflects innovation and tech industry growth.
Russell 2000
Represents 2,000 small-cap U.S. companies.
Often used to gauge investor risk appetite.
Europe
FTSE 100 (UK)
Tracks 100 largest companies listed on London Stock Exchange.
Multinational in nature (oil, mining, banking).
Example: BP, HSBC, Unilever.
DAX (Germany)
Tracks 40 largest German companies listed on Frankfurt Stock Exchange.
Represents Europe’s strongest economy.
Includes Siemens, BMW, Allianz.
CAC 40 (France)
Top 40 companies in Paris Stock Exchange.
Example: L’Oréal, TotalEnergies, BNP Paribas.
Euro Stoxx 50
Tracks 50 leading blue-chip companies in Eurozone.
Pan-European benchmark.
Asia-Pacific
Nikkei 225 (Japan)
Tracks 225 large companies listed on Tokyo Stock Exchange.
Price-weighted like Dow Jones.
Key companies: Toyota, Sony, SoftBank.
Shanghai Composite (China)
Tracks all companies on Shanghai Stock Exchange.
Represents China’s domestic A-shares market.
Hang Seng Index (Hong Kong)
Covers 50 major companies in Hong Kong.
Gateway for global investors to track China’s growth.
KOSPI (South Korea)
Korea Composite Stock Price Index.
Includes companies like Samsung, Hyundai, LG.
ASX 200 (Australia)
Tracks 200 top Australian companies.
Mining and banking heavy.
Sensex & Nifty (India)
Sensex: 30 large companies on Bombay Stock Exchange.
Nifty 50: 50 companies on National Stock Exchange.
Represent India’s fast-growing economy.
Other Important Indices
Bovespa (Brazil) – Latin America’s most important index.
MOEX Russia Index (Russia) – Reflects Russian economy, highly energy-driven.
TSX Composite (Canada) – Tracks Canadian companies, resource and banking heavy.
5. Global Indices as Economic Indicators
Stock indices don’t just reflect companies – they mirror entire economies.
U.S. Indices → Global investor sentiment.
Nikkei 225 → Japanese manufacturing & export health.
Sensex & Nifty → India’s emerging market growth.
FTSE 100 → Brexit, European trade, and global commodity movements.
Whenever there’s global turmoil (war, recession, oil shocks), these indices react immediately, and their performance tells the world how economies are coping.
6. Correlation Between Global Indices
In today’s interconnected world, markets are not isolated.
A fall in the Dow Jones often impacts Asian and European markets the next day.
Rising oil prices affect Bovespa, FTSE, and Sensex (energy-heavy economies).
Global crises like COVID-19 led to synchronized market crashes worldwide.
Thus, traders and fund managers track multiple indices daily to understand global trends.
7. Indices in Investment
a) Active vs Passive Investing
Active investors pick stocks individually.
Passive investors buy index funds (like S&P 500 ETFs).
b) ETFs and Mutual Funds
Exchange-Traded Funds (ETFs) mimic indices and trade like stocks.
Example: SPDR S&P 500 ETF (SPY) tracks the S&P 500.
c) Hedging with Indices
Derivatives like futures and options are available on indices.
Example: Traders use Nifty Futures or S&P 500 options to hedge portfolios.
8. Criticisms of Stock Indices
While indices are useful, they have limitations:
Not Full Representation – They track selected companies, not the entire market.
Overweight Bias – Large-cap companies dominate in market-cap weighted indices.
Sector Bias – Tech-heavy indices (like NASDAQ) may give a distorted view.
Price Weighted Flaws – In indices like Dow Jones, a single expensive stock can distort movements.
9. Future of Global Stock Market Indices
The world of indices is evolving with new themes:
Sustainable Indices (ESG) – Tracking environmentally and socially responsible companies.
Example: Dow Jones Sustainability Index.
Thematic Indices – Artificial Intelligence, Green Energy, Blockchain, EVs.
Frontier and Emerging Market Indices – Covering fast-growing but less developed markets.
Crypto Indices – Tracking cryptocurrencies like Bitcoin and Ethereum.
Conclusion
Global Stock Market Indices are more than just numbers on a financial news ticker. They are:
Thermometers of economic health.
Benchmarks for investment performance.
Global connectors influencing money flows.
From the Dow Jones in the U.S. to the Nifty in India, from FTSE in London to Nikkei in Tokyo, these indices form the heartbeat of the global financial system.

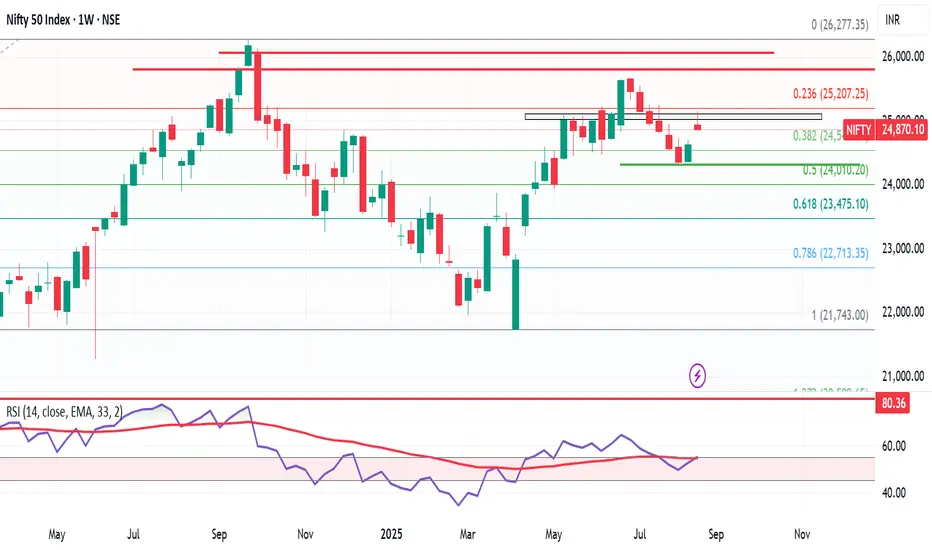
Nifty Forms Shooting Star – Is Septmber Correction on the Cards?Nifty closed this week at 24,870, up 240 points from the previous week’s close. It made a high of 25,153 and a low of 24,852, once again respecting my projected range of 25,100 – 24,300.
But here’s the key: this week, Nifty formed a Shooting Star candle, which is a bearish reversal pattern. As long as Nifty stays above 24,852, bulls are safe. But a break below this level could trigger downward pressure toward 24,400.
📊 Next Week’s Range:
➡️ Likely range → 25,350 – 24,400
➡️ Break below 24,852 = bearish pressure
➡️ If 24,400 breaks, 23,900 could come into play
Historical September Pattern:
From the 2nd week of September, markets have historically shown 6–11% corrections from their highs. If history repeats, within the next 10 days we could see another push toward 25,600/25,700, followed by heavy selling pressure.
✅ My Plan:
If markets rise in the coming days, I’ll be looking to cash out from existing positions and prepare to re-enter at better levels if a correction begins in the 2nd or 3rd week of September.
US Market Update – S&P500
The S&P500 bounced from 6,343 support and managed to close just 10 points higher than last week. Above its previous week’s high of 6,481, it has the potential to test the 6,568 Fibonacci level. Investors in US markets should trail their stop-loss to 6,330 to safeguard profits.
Want me to review any index or cryptocurrency for you? Drop it in the comments and I’ll cover it in my next update!
Is Nissan's Future Fading or Forging Ahead?Nissan Motor Company, once a titan of the global automotive industry, navigates a complex landscape. Recent events highlight the immediate vulnerabilities. A powerful 8.8-magnitude earthquake off Russia's Kamchatka Peninsula on July 30, 2025, triggered Pacific-wide tsunami alerts. This seismic event prompted Nissan to **suspend operations at certain domestic factories in Japan**, prioritizing employee safety. While a necessary precaution, such disruptions underscore the fragility of global supply chains and manufacturing, potentially impacting production targets and delivery schedules. This immediate response follows a period of significant operational adjustments as Nissan grapples with broader economic, geopolitical, and technological headwinds.
Beyond natural disasters, Nissan faces substantial financial and market share challenges. Although Fiscal Year 2023 saw operating profit and net income increases, global sales volume remained largely stagnant at 3.44 million units, signaling intensified market competition. Projections for Fiscal Year 2024 indicate a **forecasted revenue decline**, and recent U.S. sales figures show an 8% year-on-year drop in Q1 2025. Macroeconomic pressures, including inflation, volatile currency fluctuations, and a significant hit from **billions of dollars in lease losses** due to plummeting used car values, have directly impacted profitability. Geopolitical tensions, particularly the threat of a 24% U.S. tariff on Japanese auto exports, further threaten Nissan's crucial North American market.
Nissan's struggles extend into the technological arena and its innovation strategy. Despite holding a **remarkable patent portfolio** with over 10,000 active families, the company faces criticism for **lagging in electric vehicle (EV) adoption** and perceived technological stagnation. The slow rollout and underwhelming market impact of new EV models, coupled with a notable absence in the booming hybrid market, have allowed competitors to gain significant ground. Moreover, the brand has contended with **multiple cybersecurity breaches**, compromising customer and employee data, which damages trust and incurs remediation costs. Internal factors, including the lingering effects of the **Carlos Ghosn scandal**, management instability, and costly product recalls—like the recent July 2025 recall of over 480,000 vehicles due to engine defects—have further eroded investor confidence and brand reputation. Nissan's journey ahead remains uncertain as it strives to regain its competitive edge amidst these multifaceted pressures.
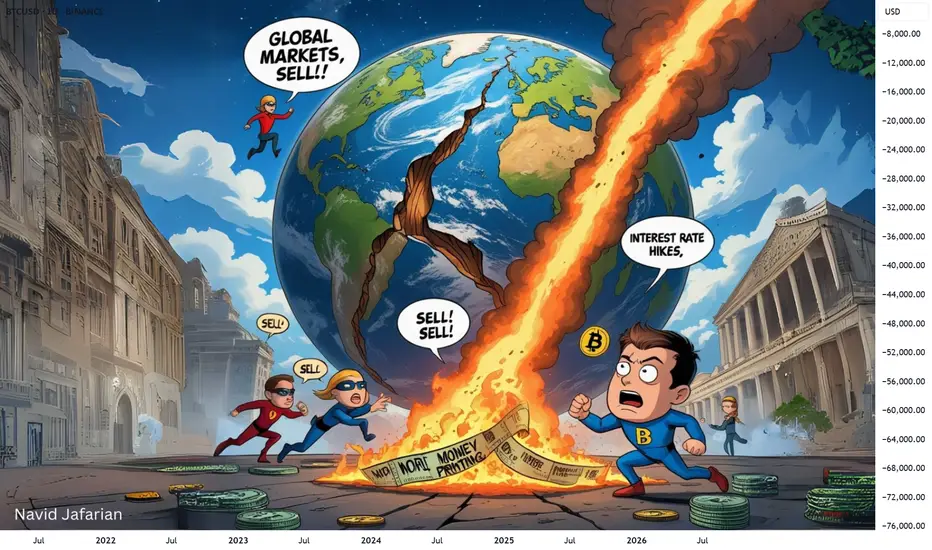
Global Markets Crashing: What Now?⚠️ Global Markets Crashing: What Now?
Don't panic , this is a worldwide event . Even big players are affected.
The important thing is to be patient and focus on future opportunities . We're hoping for a recovery in 2025.
We're holding on! ⏳
If you're experiencing losses right now , don't get discouraged, almost everyone is in the same boat . Even the largest funds managing billions of dollars are in trouble. Trillions of dollars are being wiped out from the world economy. Every country and every stock market is crashing. If you're thinking, 'My altcoin is dropping,' just look at how much ETH has fallen (18% in just one day).
Everything across the globe is falling , so it's natural that our market and investments will also fall. Don't feel bad if you didn't sell at the top in November or December; these are learning experiences for the future. Remember to take profit in the next uptrend.
Right now, all we can do is wait and hope for global issues to be resolved. Interest rate cuts and printing more money could bring a recovery in 2025.
S tay strong and make sure to take your profits if we see a big pump towards the end of the year.
We are also holding all our assets and waiting.
BITCOIN — THE SUPPORT LINEBitcoin’s ultimate support for bulls lies between the two black lines shown above.

$BEKE Inverse head and shouldersKE Holdings Inc. is a publicly traded Chinese real estate holding firm that offers a comprehensive online and offline platform for housing transactions and related services through its subsidiaries. It stands as the largest online real estate transaction platform in China.
Investors commonly refer to the entire operation as "Beike."
The company has garnered financial support from major players like Tencent, SoftBank Group, and Hillhouse Investment.
In August 2020, KE made its debut on the New York Stock Exchange (NYSE), successfully raising $2.12 billion during its initial public offering. On its first trading day, the stock soared by 87%, bringing the company's valuation to nearly $40 billion.
By May 2022, KE expanded its reach by becoming a dual-listed entity, adding its shares to the Hong Kong Stock Exchange.
KE operates two primary businesses: Lianjia and Beike. Lianjia functions as a real estate agency, while Beike serves as an online platform that connects customers with estate agents, including Lianjia. Lianjia is often likened to Redfin, whereas Beike is compared to Zillow.
The company is divided into four key business segments:
1. Existing home transaction services
2. New home transaction services
3. Home renovation and furnishing
4. Emerging and other services

$NTES NETEASE to benefit from Chinese stimulus.NetEase, Inc. is a prominent Chinese internet technology firm established by Ding Lei in June 1997. The company offers a diverse range of online services encompassing content, community engagement, communication, and commerce. It specializes in the development and operation of online games for both PC and mobile platforms, alongside advertising, email services, and e-commerce solutions within China. As one of the largest players in the global internet and video game industry, NetEase also manages several pig farms. Additionally, it features an on-demand music streaming service. Notable video game titles from NetEase include Fantasy Westward Journey, Tianxia III, Heroes of Tang Dynasty Zero, and Ghost II. From 2008 to 2023, the company was responsible for the Chinese versions of popular Blizzard Entertainment games, including World of Warcraft, StarCraft II, and Overwatch. In August 2023, NetEase unveiled a new American studio, spearheaded by veterans from Bethesda and BioWare.

SPX Nears All-Time Highs – Is a Breakout Imminent?The S&P 500 Index (SPX) has been following a strong upward trajectory, consistently forming higher highs (HH) and higher lows (HL), indicating a bullish trend.
However, the price is now approaching a rising trendline that has acted as a key resistance multiple times in the past.

Crude Oil - High Tide Pt.2Pt 1 found here .
This is an extremely critical market at this time. What must be understood, is NYMEX light crude oil is not its' own independent market, but rather a BENCHMARK for a larger market for crude oil globally, and its' derivatives. Consider a Kenyan bank, that owns a loan on a Kenyan gas station. What is the best instrument to hedge their investment? Well, obviously the answer is NYMEX:RB1! , NYMEX gasoline futures. The sovereign bond of gasoline prices so to speak.
Examining the market technically, we see that it appears bullish. The market experienced a severe panic in price during 2020, as demand and logistics collapsed in face of a global epidemic. However the price has recovered considerably, due to OPEC controls and the global necessity for this commodity. In fact, the market has even retested attempts made at reaching its 2008 high.
Many local market do not have access to global markets as might be expected, such as the NYSE and CME to conduct their day-to-day affairs. This highlights the importance of NYMEX:CL1! globally, not only for the physical delivery of light crude in the United States. But the global marketplace for light crude oil and its' derivatives, such as plastic containers, heating oil and cosmetic products. The reference price for such items by suppliers, is naturally the most liquid benchmark available to them. Which is to say, they will sell their product based on the most available market for their ingredients. A notion common in all business, to be examined at a global level to understand the relevance of this market into the future. This market exists in the United States, which is what underpins the importance of the US Dollar as this principle applies to all commodity and equity benchmarks. Furthermore, the principle of liquidity remains relevant all through history, where commodities as long as trade exists have been priced according to the most liquid benchmark.
The relevance of the US Dollar can most clearly be observed in global bond markets. As capital becomes scarce as Quantitative Easing globally comes to an end, and begins to flow towards the USA, creating the rally in $TVC:DXY. Rates in sovereign debt markets in the US and abroad have risen, and prices have fallen. A lack of demand in sovereign debt outside the USA is being realized, as FRED:RRPONTTLD RRP usage has risen since the beginning of the war between Ukraine and Russia. Because the USA is also the global benchmark for interest rates, due to its deep liquidity. Banks all around the globe balance and hedge their local debt based on this proxy market. For all intents and purposes, this is the only game in town.
It may seem odd that the price of crude oil in US Dollars has risen, given that the value of the US Dollar has risen significantly worldwide. Inflation domestically might dictate that the price of NYMEX:CL1! should fall, but this has not been the case. There is something beneath the surface, that indicates a deep value in this trade yet to be realised. Despite governments and activist organisations fighting against the product, its relevance in commerce has not diminished. Coupled with the importance of this global benchmark, the whole of oil-based product globally appears as important as ever. The market indicated last week the potential for a turning point, as it has capitulated. Traders should consider the market will likely make another low, but appears to be setting up for a rally.

Sonata Software Ltd. (NSE: SONATSOFTW)The daily chart of Sonata Software shows a notable consolidation phase after a strong uptrend earlier this year, which peaked around ₹837. The stock has been trading within a descending triangle pattern, a sign of ongoing consolidation with potential for a breakout in either direction. Here’s a closer look at key levels and technical indicators:
1.Fibonacci Retracement Levels:
The stock has retraced to key Fibonacci levels, finding temporary support near the 0.236 level around ₹563 and facing resistance near the 0.382 level around ₹615. These levels are crucial as the stock approaches a breakout or breakdown point.
2.Trendline Analysis:
Two converging trendlines form a descending triangle, indicating potential price compression. A breakout above the upper trendline or a breakdown below the lower trendline could signal the next trend direction. Traders should watch for a breakout above ₹615-₹620 or a breakdown below ₹563.
3.Volume and Momentum:
Volume has been gradually decreasing during this consolidation, which typically precedes a breakout. If there’s a spike in volume with a breakout, it could confirm the direction.
The RSI (Relative Strength Index) is around 47, showing neutral momentum but with room for movement in either direction. A rise above 50 could indicate bullish momentum.
3.Key Support and Resistance:
Support: Major support is around ₹563 (0.236 Fibonacci level) and ₹479 (100% retracement).
Resistance: Immediate resistance stands at ₹615, with stronger resistance around ₹658 (0.5 Fibonacci level) and ₹700.
Outlook:
Given the current pattern, Sonata Software is approaching a decisive moment. A breakout above ₹615-₹620 with strong volume could push the stock towards ₹658 and beyond. Conversely, a breakdown below ₹563 might lead to further downside.
Note: Keep an eye on broader market conditions as well, as they can influence breakout strength and follow-through.

World (ex-US) ticks a new ATHThe global ETF, ACWX, is making not only a new high for the cycle, but a new all-time high. Interestingly, it is trending DOWN vs. the US SPX/SPY.

Nikkei - Yen Carry Trade - Real or Cheap Politics ???2nd Week of August felt like we are in midst of Peak Autumn Season - Wherever we turn - Every Tree is turned Fully Red. The Entire World market was brought down to its Knees, given the "EXCUSE" of Japan's Yen Carry Trade
assets.bwbx.io
Yen carry trade is estimated to be around $20 trillion, according to Deutsche Bank, which is 505% of Japan’s GDP. Other estimates, based on foreign lending data, suggest it is about $1 trillion, while Japanese investors’ net international investment has grown to $3.4 trillion.
All these stories are fine - but it was presented to the world by the Cheap Media houses. Multiple news were mixed up (Yen Carry Trade + US Recession + Iran War Escalation). It was being reported that the entire world economy will dive into Recession, Indian Economy would face a Major Correction with some "Brilliant Minds" predicted that Nifty would crash to 11,000 in next 2 years ? Really ??? Even common-sense says these are Non-Sense
Here is a Detailed R&D with Step-by-Step explanations unveiling the Evil intentions of Big Players, Media Houses who wanted to take quick advantage of the News to bring the prices down in a Flash
Comparison of Nikkei's Weekly Chart vs Daily Chart
1. Nikkei had a clean Cup and Handle Breakout around 33,820 levels in Jan 2024 following which the price blasted nearly 22% in 2 months
2. The Price then faced Multi-year Parallel Channel Resistance on Mar 18th week and started falling and bounced again taking support of Fib 0.5 only - Typically when Fib levels are NOT combined along with previous Support and Resistance - they are susceptible to be broken down again if there is a News based fall
3. By Jul 8, Nikkei tested the price levels of Mar 18 and fell - initiating a Double Top pattern with neckline set at 36,670 and the price was falling Non-stop from July 8 already....
4. Now comes the News from BOJ on Wednesday Jul 31 that the rates are increased by 0.25%. As I always say, ANY NEWS has the Power to Break one or more Supports (or) Resistances. In this case, the Negative publicity by Big Media caused a -5% fall on Aug 1st (Thu) resulting in Breakdown of Double Top Neckline
Key Point to remember is that the Fall was Pre-destined in Mar 18 and then on July 8 technically. The Negative News "JUST" Added "Fuel-to-the-Fire" setting ablaze the entire world market in a flash
If there was NO News - still the Breakdown could have happened and if it happened, then the price would slowly come down to the Cup and Handle Breakout zone of 33,820. But the Overhype given my Media + US Recession (another Fictitious Horror Story) + Iran War escalation fears caused the price to Breakdown the 33,820 support level
As per Double Top pattern, the price would reach the same place from where it Started the "M" pattern and voila - it came exactly to the same level of 30,404 on Aug 5th reaching a Intra-day low of -12.65%.
Despite breaking 3 Support levels on Monday, the price took the next Support and bounced back "Same Day" above 2 of the Supports
Remember - Neither BOJ Governor nor Japanese PM/FM did anything to Stop / Reverse the price action on Monday. The calming news from BOJ Deputy Governor that there will be NO further rate hikes came out on Wednesday. But by that time, the price regained above all 3 supports which was broken (reaching above the Cup and Handle BO ZONE)
For those who don't believe Technicals didn't save the game - tell me your Story. What caused the reversal from 30,400 zone ? Entire world is driven by Technicals and NEWS can ONLY cause a temporary direction change
By Monday - Japanese economy had already touched -30% down in 30 days since Jul 8. Its impossible for a country's economy to crash so fast and still fall below. it would be a Catastrophe and even the Big Players who wanted quick gains know this, but they just wanted to Play a "Cheap Game" capitalizing on the Panic sentiments of Innocent Retailers
Understand the True working of Market - Stay Confident - Build your Wealth.
Disclaimer:
3+ Years Teaching Experience in Stock Market - Technical Analysis, Behaviour Analysis, Advanced Patterns, Emotional Management, News based Trading...
We are NOT SEBI Registered and Our focus is NOT providing Buy/Sell Recommendations/calls. Primary Objective is to provide detailed analysis of how to review a chart, explain multi-timeframe views purely for Educational Purposes.
We strongly suggest our followers to "Learn to Ride the Tide irrespective of its Side"
*** Important *** Consult your Financial Advisors before taking any positions
If you like our detailed analysis, please do rate us with your Likes, Boost and share your comments
-Team Stocks-n-Trends

Massive US Growth Will Decouple Many Global MarketsPlease watch this video to learn my viewpoint on where real opportunities exist for traders.
For many months, I've suggested that the US markets could double or triple over the next 5 to 7+ years. Some people laugh at my expectations, but others seem to "get it."
In this video, I try to explain why my expectations are valid and why I believe the "crash-dummies" will continue to trap traders into believing each new high reached is a fantastic selling opportunity.
Please watch this video and listen to what I'm trying to share. I don't see the markets as a risk related to a massive financial or global crisis (although it could happen).
I see the markets as shifting/changing related to a post-COVID coupling/decoupling event - very similar to what happened, briefly, in the 1990s.
A decoupling event would shift global economics to a point where global assets move away from determined risk factors and towards safety/security. That means the US stock market, as long as the US Dollar & US economy stays relatively strong, would be the most logical in-demand asset for the next 2~5+ years.
It is straightforward when you consider what is happening.
I hope this helps you understand where opportunities exist and how important it is to rethink what is unfolding right now.
Get some.
#trading #research #investing #tradingalgos #tradingsignals #cycles #fibonacci #elliotwave #modelingsystems #stocks #bitcoin #btcusd #cryptos #spy #es #nq #gold

USDJPY buyUS dollar vs Japanese Yen as we can in our chart the is pair is moving in a channel and we are seeing a potential buy side move keeping in view this situation we uphold that the pair can reach to the 162.450 level and then may be rejected from this level because of its historical significance and also the level is formed over weekly time frame and market has been rejected historically two times from this significant level if market is not rejected from this resistance level and breaks this level then it could reach Monthly Resistance level so keep watching the market

Macro Monday 51 ~ The Philippines - The Trading Hub of AsiaMacro Monday 51
The Philippines – The Trading Hub of Asia
The Philippine economy is currently the fastest-growing economy in South East Asia with solid promising growth projections for the next several years. The World Bank's Global Economic Prospects report on East Asia and the Pacific showed that the Philippines and Cambodia will be the second highest growing economies in East Asia and the Pacific, next to Palau which is projected to grow by 12.4%.
10 Reasons to consider the Philippines for significant investment returns:
1. The GDP growth rate in the Philippines was 7.6% in 2022 and 5.6% in 2023. The International Monetary Fund (IMF) raised its GDP growth forecast for the Philippines to 6.2% for 2024, as reported in their latest World Economic Outlook. This forecast is within the government’s revised 6-7% growth target. This puts the Philippines up there with India, the Ivory Coast and Ireland in terms of their GDP growth rate, all of which are some of the fastest growing economies in the world.
2. The population of the Philippines is 119 million with 28% (33 million people) of the population between the ages of 10-24, giving the country a sustained future labour market edge. The current labour market holds its own with 55% of the population between the ages of 20 – 64 (64 million people). Similar to India, the labour force is young, capable and likely to be sustained.
3. The Philippines are semiconductor specialists. The largest export of the Philippines is semiconductors. Semiconductors make up a significant portion of the Philippines’ exports, accounting for approximately 31.9% of the total electronic products exports. Electronic product exports in turn represent nearly 63% of the country’s total exports.
4. Additional to the above electronic products, the Philippines are also major exporters of manufacturing machinery and equipment, making them similar to South Korea in this respect (covered a few weeks ago). Broadly Manufactured Goods contributed the largest to the country’s total exports in January 2024 amounting to $4.83 bln or a share of 81.4 %. The Philippines are major machine and tool manufacturers (think Caterpillar Inc), however electronic products and semi-conductors are their forte making up the majority of their exports.
5. The second largest export of the Philippines is coconut oil, which has shown a significant annual increase in export value. It is one of the top commodity groups after electronic products in terms of export earnings.
6. The Philippines have a broad customer base in terms of exports. Their largest trading partner was the U.S. with an export value amounting to $902.3 million or a share of 15.2% to the country’s total exports in January 2024. The remaining top five major export trading partners for this month with their export values and percent shares to the total exports were;
a. Japan - $869 million (14.6%);
b. Hong Kong - $761 million (12.8%);
c. People’s Republic of China - $625 million (10.5%)
d. Republic of Korea - $356 million (6.0%).
7. The Philippines has made remarkable progress in reducing poverty over the past three decades. According the World Bank the poverty rate has fallen by almost 80% between 1985 to 2024 and this is expected to continue. According to the World Bank the current poverty rate is 10.7% however, the official poverty rate methodology in the Philippines is different and indicates that 18.1% of people live below the national poverty line. Of the employed population, 2.2% earn less than $1.90 per day on purchasing power parity (PPP) as of 2022. Regardless based on the Philippines methodology a target of <9% in expected to be hit by 2028 - set by the leading President Ferdinand R. Marcos.
8. Major Foreign Investment Incentivisation. The Philippines adopts an open economy that allows 100% foreign ownership in most business sectors. Many government corporations are getting privatized and the major industries such as telecommunications, energy, banking, and shipping have been deregulated. This gives foreign investors more freedom to set up operations in the country. In 2023, the Philippines saw a 6.6% decrease in FDI net inflow, totalling $8.86 billion, which was slightly higher than the targets set. For 2024, there has been a reported increase in FDI net inflows, with a 23.1% rise in March compared to the same month in 2023. The net inflow for March 2024 was $686 million.
9. Strategic Location. For investors aiming to tap into the ASEAN Free Trade area’s vast market of over 600 million consumers, or to engage with the key economies of East Asia, including China, Japan, and Korea, the Philippines offers an ideal strategic position. Additionally, the nation’s prime location at the nexus of numerous global maritime and air routes makes it an excellent hub for integrating into the worldwide supply chains of various enterprises. Think of it as the versatile and dynamic Suez Canal of Asian trade with reduced regulation.
10. Finally, there are a number of additional other factors make the Philippines ripe for investment and growth;
A. The Philippines boasts a high literacy rate of 94.6%, ranking third globally, with English widely used in education, media, business, and daily life, following Filipino (Tagalog) as the national language. This is similar to Ireland in Europe, which is also the only native English speaking country remaining in the EU since UK’s exit - Brexit. This gives these countries a trading edge.
B. The country’s growing economy is complemented by low business start-up costs, with labor and operational expenses significantly lower than in Western countries, leading to substantial cost savings for foreign companies establishing back offices and development centers.
C. One of the world’s largest archipelagos, the Philippines is rich in natural resources, ranking among the top gold and copper producers, with diverse marine and land species unique to its thousands of islands, alongside stunning tourist destinations.
Bonus Note on President Rodrigo Duterte:
It would be remiss of me to not mention the previous President Rodrigo Duterte who took a very harsh approach to resolving drug related crime in the Philippines. According to the Philippine Drug Enforcement Agency, during 216,138 anti-illegal drugs operations conducted between July 2016 and September 2021, 311,686 people were arrested and 6,201 were killed by the police Whilst controversial, this low tolerant approach resolved and remedied a major drug and crime issue that Philippines was burdened with. This has made the country as a whole more appealing for nationals and tourists.
Duterte also increased infrastructure spending to an average of 5 percent of the country’s overall GDP – this is twice the budget in the administrations that came before him.
As you can tell from all of the above, the Philippines is staged to enter into a monumental period of growth. The Philippine Stock Exchange also suggests that the stage is set, lets have a look.
The Philippine Stock Exchange - PSE:PSEI
The PSE Composite Index (PSEi) is composed of the 30 largest and most active common stocks listed at the PSE.
The Top 5 Companies in the PSE are as follows;
1. SM Investments Corporation: A conglomerate with operations in retail, property, and financial services. It is one of the largest companies in the Philippines by market capitalization. Market Cap of $17 bln.
2. SM Prime Holdings (SMPH): One of Southeast Asia’s largest integrated property developers, offering lifestyle cities with malls, residences, offices, hotels, and convention centers. Market Cap of $13 bln.
3. BDO Unibank: The largest bank in the Philippines by assets, loans, and deposits. It offers a full range of banking services and products to the retail and corporate markets. As of June 2024, BDO Unibank has a market cap of $12.11 billion.
4. Golden MV Holdings: A company that develops memorial parks and columbarium facilities in the Philippines. It also engages in real estate through its subsidiary Bria Homes, Inc. Market Cap of $12 bln.
5. International Container Terminal Services Inc. (ICTSI): A leading operator of container ports and terminals in the global trade and shipping industry. Market Cap of $11.7 bln.
We might look at a couple of these company charts later in this article and possibly more in coming days.
The PSEi Index chart I am about to share reminds me of the Brazil Emerging Market ETF Index AMEX:EWZ chart which we previously shared weeks ago. It also looks a little like the AMEX:URA chart and or U.S. Small Cap 3000.
All these charts are forming long term pennants and breaking to the upside. We are still pending a decisive move on the PSEi below.
▫️ You can observe a compressing pennant with a breakout very likely approaching. Given the positive strides being made in the Philippines I am leaning towards a bullish break out in the above, however this will likely be a measure and slow move.
▫️ If this chart moves in the right direction and gets above its 21 day moving average we can presume the market is moving in the right direction in the Philippines and thus seek out some companies to invest in, knowing that the wind is at our back.
▫️ Investing in the above would obviously leave you exposed to a currency risk in the Philippine Peso. So you need to keep an eye on that currency pair.
▫️ The above chart is not a prediction, however it does have a double bottom look about it and with that in mind, there is a back end potential for an up to 12% currency gain in a longer term trade for U.S. investors. It’s a very interesting background set up.
▫️ This means if you invest in Filipino stocks or companies, there is potential here that you might get additional %’s from the back end currency play.
▫️ Equally, if we lose the current low on the Peso, this would lead to losing potential gains, the currency risk in the trade. So you need to watch both charts if you enter a trade.
Very important to keep an eye on the Philippine Peso if you’re an international investor converting your local currency into Pesos in order to invest in companies in the Philippines, however at present the chart looks like it might be an advantageous back end play. No Guarantees.
Now lets look at a Philippine Stock that is large, liquid and heavily relied upon by multiple sectors in the Philippines and obviously we need a DAMN GOOD CHART.
International Container Terminal Services - SET:ICT
▫️ The chart speaks for itself and presents a good 6:1 risk: reward set up.
▫️ That 100 SMA can provide a nice structural support for anyone wanting to stay in the trade longer or at least have a level that if convincingly lost, you can cut your losses. Equally the 100 SMA would also be a great entry level.
▫️ The above SET:ICT chart reminds me so much of the Reysas LoJistik BIST:RYSAS chart which is a similar business in logistics and transportation but in Turkey. Please have a look below.
COMPARISON
Reysas Lojistic - BIST:RYSAS
▫️ I am sharing this chart as a reference to potential outcomes for ICT.
▫️ Very Similar Company Sector and Chart to the above ICT Chart in Philippines. Could we see similar continued advances in ICT?
There are a number of REALLY interesting chart set ups for the Top 5 companies in the Philippine Stock Exchange (we shared these tickers earlier). I will definitely add these in coming days and weeks as I see a lot of opportunity in the Philippine market place and the currency looks like it might be about to gain positive ground.
It appears the Philippines is undergoing an monumental economic renaissance with the economic and demographic landscape looking incredibly favourable for this versatile archipelago. This nation of Islands is presenting an incredible investment opportunity, so great in fact, I’ve started looking at property there. It has so much potential and appears to be on the cusp of a major bull trend. We can watch the PSE chart and wait for the break out.
All these charts are available on my TradingView Page and you can go to them at any stage over the next few years press play and you'll get the chart updated with the easy visual guide to see how the Philippine stock market has performed. I hope it’s helpful.
PUKA

Special words for gold trading
We often see these words when trading. If you understand them, trading will be easier.
Including "deposit, withdrawal, position, closing, take profit, stop loss", etc.; they mean:
Deposit: remit personal funds to the trading account for trading;
Withdrawal: transfer part or all of the balance in the trading account to a personal bank account;
Position: the name of the trader buying and selling contracts in the market; establishing a trading order is called "establishing a position", a buy order is called a "long position", and a short-selling order is called a "short position"
Closing: ending a held buy order or sell order;
Take profit: the trading order finally achieves the profit target and leaves the market with a profit;
Stop Loss: When the order loss reaches the maximum tolerable amount, admit the loss and leave the market;
In addition to the commonly used terms, there are also some special terms involved in the trading market;
For example: heavy position, light position, carry order, lock position, liquidation
Heavy position: Most of the funds in the trader's account are involved in order transactions
Light position: The trader only uses a small part of the funds in the account to participate in the order;
In trading, there is a most basic principle that "don't put all your eggs in one basket"
There are always risks in the financial market, and traders should remember one sentence:
Avoid risks, trade with light positions, and never hold heavy positions.
Light position standards:
Total loss of holding positions ≤ one-tenth of the account amount
The number of lots for a single transaction of 10,000 US dollars is not more than 0.5-1 lot
Carry order:
When traders encounter losses, they have no stop-loss strategy, do not know how to stop losses and choose opportunities to start over, but always hold losing orders and bet everything on the rise and fall of the market. This is a behavior that should be avoided in trading.
Locking:
Similar to "carrying orders", when traders encounter losses, they do not implement stop-loss strategies, but establish reverse orders while holding loss orders. Locking can only allow traders to temporarily stop further losses, but cannot get rid of losses. If the net value is not enough, a "black swan event" will occur, and the short-order spread will increase instantly, which will also lead to a margin call.
Margin call:
When the funds in the trader's trading account are not enough to trade, it is a margin call; margin call means the loss of all principal.
If you are a novice, these must be helpful to you! I will share trading knowledge from time to time, and you can follow me if you need it.

iShares Global Energy ETF - $IXC - Major OpportunityiShares Global Energy ETF - AMEX:IXC
This chart and all the others ETF's shared in the below post continue to show major break outs. Its really incredible to see.
✅ Ascending triangle breakout & retest of base
✅ Series of higher lows
✅ Above 200 day SMA
✅ Great Risk Reward set up at 8:1
Garnering some long term exposure to these general indexes is a great way to ride the general Global, Energy, Fintech and blockchain trend. Not included in the below is a potential commodity bull cycle that feeds into it.

NMDC :: Iron Ore Rebounds?NSE:NMDC
- Script sees a breach of Monthly Bearish GPZ alongside Quarterly Bearish GPZ making it a "HOT PIVOT LEVEL" to keep on radar!
- Money Zones are marked alongside in 3 different shades as per the analysis from FUNDFLUX .
- This "Pivot & Price" action is been seen as iron ore prices have rebounded after 2weeks of down-fall and are further expected to rise on the hope of rate cuts from the West and fresh stimulus from China.
- If the trajectory remains strong supported by the anticipated news that this script can see a potential upside of 15-30% on upper levels of 255/280/310.
News Article is provided below -
www.moneycontrol.com

Macro Monday 26~Global Indexes Breaking OutMacro Monday 26
Global Index’s Breaking Out
As its Christmas Eve I wanted to do an early release for tomorrow and share something positive and Christmassy but at the same time share something of value, so here is a look at some of the major global ETF index’s and how promising they appear towards the end of 2023. A clear sector stands out.
Vanguard Total World Stock Index ETF - AMEX:VT
In brief this Exchanged Traded Fund (ETF) seeks to track the performance of the FTSE Global All Cap Index (the “Index”) which consists of 99% stocks. The top three portfolio components consist of:
1. 61% in U.S. stocks – The top 5 holdings within this segment are Apple, Microsoft, Amazon, Nvidia and Future on E-mini S&P Futures.
2. 7.6% stocks in the Eurozone
3. 6.1% stocks in Japan
The overall VT portfolio is typically weighted as follows: Cyclicals (34%), Sensitive (46%) and Defensive (20%). This ETF attempts to provide an economy weighted global ETF product by leveraging the worlds largest economy, the U.S. with some protection against downside risk with defensive and cyclical plays taking up over 50% of the portfolio exposure.
FYI – This index is extremely similar both on the chart and in price to the iShares MSCI ACWI ETF ( NASDAQ:ACWI ). This ETF aims to track the MSCI All Country World Index also. You can look this up and add it to your ticker list for a general sense of the direction of global markets much like the Vanguard Total World Stock Index ETF covered here today.
The Chart - chart features in heading of this article
Again, in brief you can see that we have a major breakout of a 3 year long pennant which is a bullish formation. We are also above the 200 day moving average which is slanting upwards (positive).
This Chart/ETF product gives a broad based view on the global economy at present however is obviously strongly reliant on the U.S. economy with 61% of the portfolio in U.S stocks so we will also have a look at a few other index’s that are looking positive at present.
iShares Global Energy ETF - AMEX:IXC
This index seeks to track the S&P Global Energy Sector Index and appears is primarily invested in the Oil and Gas sector. This index is designed to measure the performance of 52 companies in the global energy sector. The company sectors include the following:
1. Oil & Gas Exploration and Production Companies
2. Integrated Oil & Gas Companies
3. Oil Equipment, Services & Distribution
Integrated Oil and Gas makes up 53% of the portfolio, with Oil and Gas Exploration making up another 22%, and Oil and Gas Storage & transportation 10%. The remainder of the portfolio is other Oil & Gas equipment, services and derivatives.
The Chart
As you can see the chart is forming an ascending triangle and has made a series of higher lows due to upwards price pressure. Should this continue we should eventually have a breakout above the ascending triangle. We are now above the 200 day moving average however it has plateaued and thus we do not want to lose the $39.41 level which would mean we have lost our most recent higher low and would also confirm we have lost the diagonal support line. For now it is positive and we have price pushing higher with higher lows each month.
Global X FinTech ETF - NASDAQ:FINX
The Global X FinTech ETF (FINX) is an exchange-traded fund that seeks to track the performance of the Indxx Global FinTech Thematic Index. These are companies that are involved in the development and use of financial technology (FinTech).
The ETF seeks to provide exposure to companies at the forefront of financial technology innovation, including those involved in payment processing, digital banking, blockchain technology, peer-to-peer lending, and other disruptive financial services.
Interestingly, Coinbase Global NASDAQ:COIN is its largest holding at 9%, then Intuit Inc NASDAQ:INTU at 8% and Fiserv Inc NYSE:FI at 6%. Other notables are PayPal, Fidelity and Block which are all in the top 10 holdings making up about 4 – 5% of the portfolio each.
This is a fascinating little index that gives you exposure to some of the more established financial entities whilst also providing exposure to the trending innovative financial tech plays. One extra thing I like about this tracked Index is that it is 51% exposed to Information Technology but then you have c.40% in Financials, something people just cannot do without.
The Chart
We have a breakout of a long running descending wedge. Price has fallen c. 65% from the highs made a series of lower lows and has now broken out of the wedge and strongly broken above the 200 day moving average. As I always say, an entry off the 200 DSAM is usually ideal but we have a long term potential change of direction here on the chart could be a signal for FinTech playing a major role over the coming decade in finance. This leads me to my last chart of the day.
Global X Blockchain ETF - NASDAQ:BKCH
The Global X Blockchain ETF ( NASDAQ:BKCH ) is an exchange-traded fund designed to track the performance of the Indxx Blockchain Index. This ) The ETF seeks to invest in companies positioned to benefit from the increased adoption of blockchain technology, including companies in digital asset mining, blockchain & digital asset transactions, blockchain applications, blockchain & digital asset hardware, and blockchain & digital asset integration.
Earlier this year I spotted a very promising opportunity in the Cleanspark Inc NASDAQ:CLSK Chart, I checked the major components of this ETF only to find CLSK as a top three holding making up 12% of the portfolio weighting in the ETF, this helped confirm my conviction to place a trade. Since investing and sharing the original chart this stock has increased >100%+. As I noted above, when you see large institutional indexes/or tracked indexes showing a lot of faith in a company and putting their money where their mouth is with these sorts of weightings, it can be a confirmation signal after finding a brilliant looking chart. Marathon Digital NASDAQ:MARA is the largest holding in the ETF at 17% and Coinbase comes at 2nd place at 14%. The remainder of the portfolio is collection of other blockchain related firms including PayPal, Block, Cipher Mining, Nvidia, Robinhood, Bakkt holdings, Galaxy Digital…I think you get the picture.
The Chart
This chart is very similar to the Fintech Chart however it has some subtle differences that make it a more favorable chart. The 200 DSMA is clearly on the ascend for a number of months and appears to have demonstrated itself as support. We have higher lows and now a higher high…. which says a lot. We also have the obvious breakout from the pennant. All in All this is beautiful looking chart however we should note that we had a strong pull back in summer 2023 and we could have another from the $60 level. If you are placing bids on this chart it should be for the long haul and as always, an ideal entry is off the 200 DSMA or your Dollar Cost Averaging for a long term hold.
These are a few of the charts that I track closely but rarely talk about, some of the major holdings in these stocks helped lead some of my investment decisions this year. If big money and funds are investing in a company or sector where the chart is also looking good, its was always an indication to me that money could be flowing towards these stocks, especially when making up such large positions within these large index funds.
If you enjoyed me covering index and the inferences drawn from them let me know and I’ll share some of the others I track.
Folks things are looking really good for the long term on all the above global indexes
Happy Christmas Everyone
PUKA

Crude Oil Review and Forecast
API Actual: 9.047M
API Consensus: 1.467M
EIA Crude Import Actual 0.259M
EIA Crude Import Previous: -0.385M
EIA Crude stock Actual: 8.701M
EIA Crude stock consensus: 1.160M
As Saudi Oil production had shrunk to nine million barrels per day in July since its last OPEC meeting with Russia to restrict supply amid signs of weakening global demand in slowing economy, Saudi, the largest oil supplier in the world had expressed its opinion on keeping the production to remain low until the end of this year. As foreseen through such decisions from the major suppliers, the most recent Crude inventory within the states has turned out to be way larger than expected.
Since September of 2023, the Crude oil future TVC:USOIL plunged by $-22.35 (-23.62%) to $72.28 per barrel during the last week trading session. Slower than expected recovery in economic activities(PPI Nov 2023) adding fear of the constant weakening of the oil demand, forecasting a skeptical view towards a short term recovery of the oil demand and its price as well.
The key major resistances are as follow:
Top: $77.8
Mid: $75.5
Low: $72.12
The weekly upside trend is still the last hope for the Bullish traders.
Once both the Four-hours and the daily candles closes below the $64-60 zone, we will then be able to finalize on such ambiguous consensus.
With OPEC+ meeting pushed back to this weekends, every commodity investors focus is on the meeting report, hoping for the decision to give them the better foresight of the future of the market.
The Best Futures Trading Hours in Crude:
CL opens for trading on the floor, called the pit session at 9AM EST
European trading closes at 11:30 AM EST
The best hours for trading are the most liquid, between 9:00AM and 11:30AM
Pit session closes at 2:30PM EST, when floor trading stops for the day
Therefore, the best trading in the afternoon is the last hour between 1:30PM to 2:30PM EST

Globant SA (NYSE: GLOB) Impressive Q3 Financial PerformanceGlobant SA (NYSE: GLOB) announced its impressive financial performance for the third quarter. The company surpassed analyst expectations, demonstrating its continued growth and success.
During this quarter, Globant reported earnings of $1.48 per share, which exceeded the analyst consensus estimate of $1.47 by 0.68 percent. This represents a significant increase of 16.54 percent compared to the earnings of $1.27 per share in the same period last year.
Furthermore, the company achieved remarkable quarterly sales of $545.28 million, surpassing the analyst consensus estimate of $545.23 million by 0.01 percent. This notable achievement signifies an impressive growth rate of 18.83 percent compared to the sales from the same period last year.
Globant’s ability to outperform analyst predictions in both earnings and sales showcases its strong business strategy and execution. This performance highlights the company’s commitment to delivering exceptional results and reinforces its position as a leader in the industry.
The stock performance of GLOB (Globant S.A.) was closely watched by investors. With a previous close of $183.09, the stock opened at $193.96 and had a day’s range of $193.96 to $206.99. The volume traded on that day was 1,243,797 shares, significantly higher than the average volume of 382,698 shares over the past three months. With a market cap of $7.6 billion, GLOB is a significant player in the technology services sector.
GLOB has been experiencing impressive earnings growth. In the last year, its earnings grew by 51.33%, and this year, it has grown by 13.20%. Looking ahead, the company is projected to have an earnings growth of 23.35% over the next five years. This positive trend in earnings growth indicates that GLOB is performing well and has a promising future.
In terms of revenue growth, GLOB has also shown remarkable progress. Last year, its revenue grew by 37.25%, which is a significant achievement. This growth indicates that the company is attracting more clients and generating higher sales. This positive revenue growth is likely to contribute to the company’s overall profitability and success.
Technical Analysist
Price Momentum
GLOB is trading near the top of its 52-week range and above its 200-day simple moving average.
What does this mean?
Investors have been pushing the share price higher, and the stock still appears to have upward momentum. This is a positive sign for the stock's future value.
