GMTUSDT

BTCUSDT H4In the H4 timeframe, I expect corrosion correction to the desired levels.
👤SecondChanceCrypto
📅15.May .22
⚠️(DYOR)

GMT/USDT 1HR CHART UPDATE BY Domino Crypto!!Hello, community members welcome to this GMT/USDT 1hr chart update by Domino crypto.
Don’t forget to hit the like button if you find this update helpful because this motivates me to bring this kind of update regularly.
Now, Let's get to the chart,
As we can see that above-mentioned chart is evident that GMT/USDT just broke out the neckline of this HEAD & SHOULDER PATTERN which is a bullish pattern.
GMT currently trading at the price level of $1.56.
Here I am expecting a retest towards the neckline which will be the confirmation to long GMT.
RSI also follows the lower trend line well and moves upside.
Some % below GMT also getting a back MA SUPPORT.
ENTRY:
leverage:-5x to 7x leverage
entry:-$1.49,$1.545
target:-40% to 50%
stoploss:- $1.407
NOTE: This is not financial advice. This is for education purposes only. I am not responsible for the profits or losses you generate from your investments.
DO YOUR RESEARCH BEFORE MAKING ANY TRADES.
Thank you.

Update GMT by STEPN scenario with price pattern predictionAnother target hit on this GMT short as $0.9-1.00 was hit.
$GMT didn't even need a H&S to hit target

GMT SCAM COIN - BIG Short Like LUNA, ANC and then GMT & APE?GMT - BIG Short Like LUNA, ANC and then GMT & APE?
GMT SHOT SIGNALNice to meet you, everyone
I'm an alt trader
I'm analyzing and recommending things that are similar to my personality among many alt coins
We have 26 minutes left

$GMT Short TradeGMT Looks bearish .
1- Bearish Rising Wedge Breakdown confirmed on 4hr time frame
2- Double Top Neckline Breakdown confirmed on 4 hr time frame
Short is active from both breaklines
Good Luck

My analysis On GMT/USDT
- Elliott wave in 15m
- Rising Wedge
- An Doji Appear on 15m/4h
--------------------------------------------------------------------------------------------------------
** Please support this idea with your likes and comments, it is the best way to keep it relevant and support me. **
--------------------------------------------------------------------------------------------------------

GMT brief correction ❌🧨Based on the chart, the price lost the previous supports and became close to channel support and lower support areas ✔️
and
we expect to see brief correction at least to our channel support ❌🧨
Please, feel free to ask your question, write it in the comments below, and I will answer.🐋

GMT - Scalping short ideaWe can take short since coin made false breakout and it's logical to expect continuation of the movement. Be aware about btc strip.
⭐️ BTC bearish
⭐️ Trend is bearish
⭐️ Volume at top
⭐️ 3rd touch
⭐️ Base is ready
⭐️ 105 ATR
Will enter when price squeezes to the level on lower timeframes, the base will form and the strip will get faster.
Fix profit by parts:
3% - 1/3
6% - 1/3, stoploss to breakeven
What's left, hold to the maximum
What do you think of this idea? What is your opinion? Share it in the comments📄🖌
If you like the idea, please give it a like. This is the best "Thank you!" for the author 😊
P.S. Always do your own analysis before a trade. Put a stop loss. Fix profit in parts. Withdraw profits in fiat and reward yourself and your loved ones

GMT possible trendBTC will soon hit its support around 30k and will rebound back. So there is a great chance of GMT also rebounding from this support. But GMT is facing its resistance which it had failed repeatedly. GMT might fail again this time. Let's see.
This is not a financial advice.

GMTUSDT - 1Dsee and watch :)
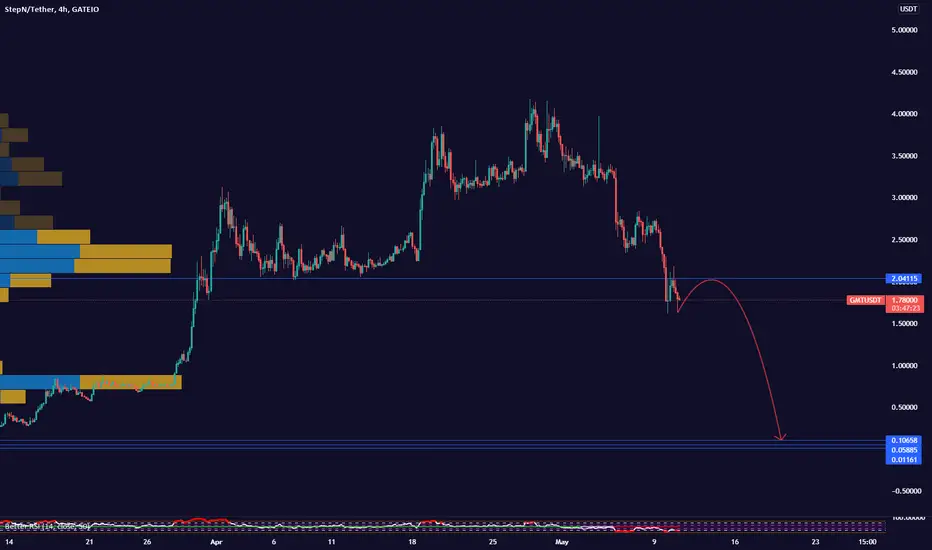
The $ 2 to $ 2.20 range is a good support range and if this range is broken it will be very bad and we will most likely see a heavy dump that will lower the price to the range of 70 to 80 cents ... If this is supported Range We will probably see an upward movement up to the range of $ 3 ...


GMT brief correction ❌🧨Based on the chart, the price has stuck in the channel for a while ✔️
we
expect to see brief correction at least to our channel support ❌🧨
Please, feel free to ask your question, write it in the comments below, and I will answer.🐋


Gmt-usdtif breake ..
.
This Analysis will be updated ...
⚠️(DYOR)
If you apperciate my work , Please like and comment , It Keeps me motivated to do better

GMT possible Elliott Wave TriangleWatching these converging trendlines. If it gets a break below would be a nice anchor for the count and complete a possible impulse. For me an ideal move for clarity would be a move down to the PTT but triangles can be tricky.

GMT WITH A SHORT BULL RUNGMT may pull up a bit from here.
This season is a bloody one, hence you have to trade with care.
Share your opinion

GMTUSDTHello Crypto Lovers,
Mars Signals team wishes you high profits.
This is a 4-hour-time frame analysis for GMTUSDT
It is clear that the price is fluctuating in the middle of the channel. It is expected to move to the first support line. If it moves upward, it is able to break the first resistance line and even move to the second resistance line.
Warning: This is just a suggestion and we do not guarantee profits. We advise you analyze the chart before opening any position.
Wish you luck

Bye bye Bull, welcome bearmost coins and tokens dumb hard. the same goes for GMT.
short term, it might re-test the green dash line. But overall
is sideway downward to < 0.9


GMT Price Target of the CorrectionI think GMT is heading to the $2.10 strong support from which it can consolidate before showing some strenght once again.
Looking forward to read your opinion about it.
