XAU/USD | Gold Sharp Sell-Off After ATH, Liquidity Void in Play!By analyzing the #Gold chart on the 4H timeframe, we can see that after our last analysis, price rallied to $4550 and delivered over 700 more pips of profit. After that strong move, gold entered a very aggressive correction. In less than 16 hours, price dropped from $4550 to $4300, which means a $250 or 2500 pips heavy sell-off.
Right now, gold is trading around $4329. This sharp drop has created a very large liquidity void, and I expect this gap to be filled in the short term with a bullish rebound. The expected short-term upside is around 300 to 800 pips, while the medium-term potential could reach 1500 to 2500 pips.
The key medium-term demand zone to watch is $4210 to $4269.This analysis will be updated.
Please support me with your likes and comments to motivate me to share more analysis with you and share your opinion about the possible trend of this chart with me !
Best Regards , Arman Shaban
Gold

XAUUSD – Retesting Support Before the Next Upside MoveHello, I'm Camila.
Observing the H4 chart, I can see that gold has proactively pulled back to rete afterhow the market is reacting at lower prices. Instead of continued selling pressure, the current candles show a clear loss of bearish momentum, while buying interest is beginning to re-emerge. This is typical behavior in a healthy uptrend, where the market reassesses its foundation before committing to the next move.
From a structural perspective, the bullish trend remains intact. Price is still trading above the ascending trendline, and there are no confirmed signals of a structural breakdown. The recent volatility appears to be more about rebalancing supply and demand than distribution. In momentum-driven uptrends, pullbacks to test support are not signs of weakness; they are often necessary steps to determine whether buyers are still committed to defending higher prices.
On the fundamental side, the broader backdrop continues to favor gold. Ongoing global economic and geopolitical risks remain unresolved, sustaining demand for safe-haven assets. At the same time, expectations that the Federal Reserve will maintain a relatively accommodative policy stance help limit upside pressure on the U.S. dollar and Treasury yields. However, with a busy U.S. economic calendar ahead, upcoming data releases could generate uneven intraday volatility, making it unlikely for gold to move in a straight line and more likely to continue its familiar “advance-and-pause” rhythm.
The area I am watching most closely is the current support zone, where price is now reacting. If gold continues to hold this area and shows clearer buying responses, the bullish structure will be further reinforced. In such scenarios, the market often completes its base-building process before resuming the broader trend that has already been established.
Wishing you disciplined and successful trading.

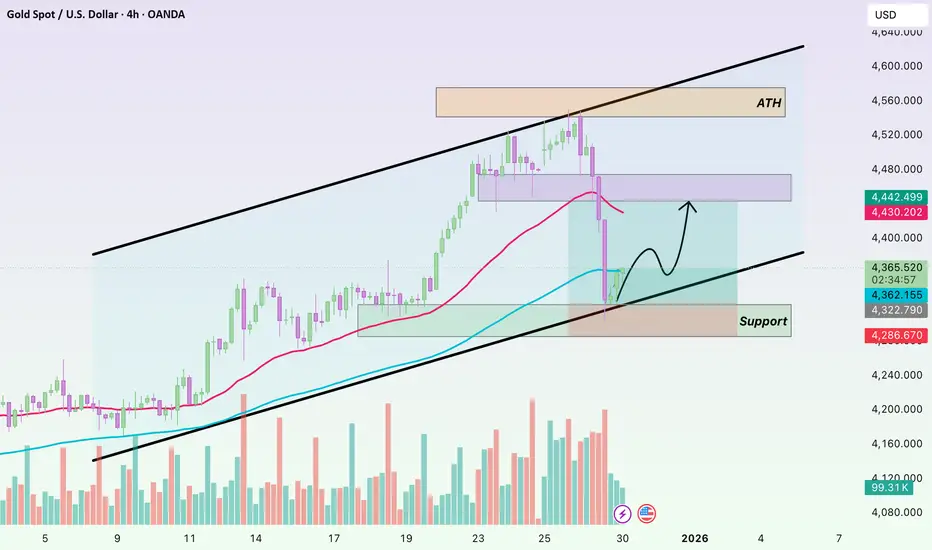
Gold - Breakout, Retest, Reload?Gold continues to respect a clean bullish structure 📈 on the 4H timeframe. After breaking above the previous all-time high, price has shifted that level into demand, confirming strength rather than exhaustion.
⚔️The rising blue trendline remains intact , and every pullback so far has been met with aggressive dip-buying, reinforcing the trend-following environment.
As long as price holds above the highlighted demand zone, the bias remains firmly bullish.
From here, the plan is simple and disciplined:
🏹I’ll be looking for longs on pullbacks into demand, in alignment with the trend, rather than chasing price higher. A clean reaction from this zone keeps the path open for continuation toward new highs.
⚠️ Disclaimer: This is not financial advice. Always do your own research and manage risk properly.
📚 Stick to your trading plan regarding entries, risk, and management.
Good luck! 🍀
All Strategies Are Good; If Managed Properly!
~Richard Nasr

XAUUSD: Bullish Trend Remains Intact in Rising ChannelHello everyone, here is my breakdown of the current XAUUSD (Gold) setup.
Market Analysis
Gold has confirmed a bullish shift after breaking out of a prior triangle structure, where price was previously compressed between descending resistance and ascending support. This breakout marked a clear change in market structure and initiated a strong impulsive move higher. After the breakout, price transitioned into a consolidation range, indicating temporary balance before continuation.
Currently, XAUUSD established a clear upward channel, respecting both the lower channel support and the ascending trend line. This structure confirms sustained bullish momentum with higher highs and higher lows. Price has continued to trend higher and recently pushed into a key Resistance Zone, where the market is currently showing signs of reaction and testing supply. Below current price, the former resistance has flipped into a well-defined Support Zone, which aligns with the prior breakout level and the lower boundary of the upward channel. This area has already shown buyer response, reinforcing its importance as a demand zone within the bullish structure.
My Scenario & Strategy
My primary scenario remains bullish as long as XAUUSD holds above the Support Zone and respects the upward channel structure. I expect buyers to defend this area and attempt another push toward the Resistance Zone. A successful breakout and acceptance above resistance would confirm continuation of the bullish trend and open the path toward higher targets.
However, a strong rejection at resistance followed by a breakdown below the support zone would weaken the bullish structure and suggest a deeper correction or consolidation. For now, price action continues to favor buyers while the ascending structure remains intact.
That’s the setup I’m tracking. Thank you for your attention, and always manage your risk.

XAUUSD – A Healthy Reset Before Trend ContinuationHello, I’m Camila.
Observing the XAUUSD H4 chart, I believe the market is unfolding exactly as a technical correction within a well-defined uptrend. After price was rejected at the upper resistance of the ascending channel, gold deliberately pulled back to retest the channel’s dynamic support. This move should not be interpreted as a trend reversal, but rather as a natural and rational response following a steep and extended rally.
What stands out to me is how price behaves upon reaching the support zone. Selling pressure has not expanded further; instead, downside momentum has clearly slowed, accompanied by signs of supply absorption at the highlighted support area. This is classic price behavior in a healthy uptrend: the market retraces to lower levels to assess whether buyers remain committed to defending the underlying structure.
From a structural perspective, the ascending channel remains intact. Price has not broken below the lower boundary of the channel, and the entire pullback still falls well within acceptable corrective limits. This indicates that the medium-term bullish trend remains unbroken. I see no clear evidence of distribution at this stage; rather, the market appears to be undergoing a temporary rebalancing of supply and demand before the primary trend resumes.
My preferred scenario is for gold to stabilize and consolidate around the dynamic support zone, marked as a BUY area on the chart. If buying interest continues to emerge and price maintains its higher-low structure, the market is likely to form a technical rebound. From there, gold could move back toward a retest of the upper resistance zone previously highlighted. A decisive breakout above that area would confirm trend continuation and open the door to higher targets in the next phase.
From a macro perspective, the broader backdrop continues to support this bullish outlook. Ongoing global economic and geopolitical uncertainties sustain demand for safe-haven assets, while expectations of a more accommodative Federal Reserve stance help cap U.S. dollar strength and Treasury yields. In this environment, pullbacks in gold are better viewed as strategic opportunities, rather than early signals of a trend reversal.
In summary, based on what the chart is showing, I consider the current decline to be a necessary step back before the next advance. Once the market completes its support test and buying strength is reaffirmed, gold is likely to revisit resistance and continue along the upward path already established.
Wishing you disciplined trading, a calm mindset, and decisions aligned with market structure.

XAUUSD Sellers Defend Resistance, Eyes on PullbackHello traders! Here’s my technical outlook on XAUUSD (4H) based on the current chart structure. Gold remains in a bullish structure after breaking above a descending resistance line, confirming a shift in control to buyers. Price then consolidated in a clear range, showing balanced market activity before continuing higher. The upside breakout from this range, supported by a rising trend line, confirms ongoing bullish momentum. Currently, XAUUSD is testing a key Resistance Level within the Seller Zone, where selling pressure may appear. Below, the former resistance has turned into a strong Support Level, aligned with the Buyer Zone near 4,440 and the previous breakout area. My scenario: as long as price remains below the Seller Zone and shows rejection from resistance, the bias turns bearish, with TP1 targeting a move back toward the Buyer Zone and trend-line support. A strong breakout and acceptance above resistance would invalidate the short scenario and suggest further upside continuation. Please share this idea with your friends and click Boost 🚀

YTD 2025 Market Performance Overview by ProjectSyndicate
🟡 1. YTD 2025 Market Performance Summary
Below is a snapshot of major asset class returns through 2025 YTD:
📊 Performance Infographic – YTD Returns (2025)
• Precious Metals
◦ 🥈 Silver: +150%
◦ 🥇 Platinum: +147%
◦ 🪙 Palladium: +92%
◦ 🟡 Gold: +64%
• Equity Markets
◦ 📈 Nikkei: +27%
◦ 📈 DAX: +22%
◦ 📈 QQQ: +22%
• Cryptocurrencies (Risk Assets)
◦ 🪙 Bitcoin (BTC): –4%
◦ 🪙 Ethereum (ETH): –10%
Insight: Classic safe havens precious metals vastly outperformed equities and digital assets through 2025, reflecting both macro uncertainty and the ongoing demand for real assets.
🌟 2. Key Investment Themes for 2025
🔶 A. Precious Metals Rally
Performance Drivers:
• Elevated inflation expectations and rate cut prospects pushed investors into hard assets.
• Silver’s industrial demand (EVs, solar, electrification) amplified its gain vs. gold.
• Platinum & palladium benefited from supply constraints and vehicle emissions tech demand.
• Safe-haven demand lifted gold to multi-decade highs.
🤖 B. AI Technology Sector
While we don’t have precise index returns in this report for AI technology stocks, broad AI adoption drove significant equity performance — especially among semiconductor and AI platform leaders:
• NVDA Nvidia — continued leadership in AI compute.
• AMD — robust gains from data-center and AI client demand.
🧬 C. Biotechnology & Innovation
Biotech remains a structural growth sector due to:
• Aging demographics and healthcare demand.
• New drug modalities and AI-assisted discovery.
• Continued regulatory approvals of new therapeutic classes.
Although biotech performance varies by sub-sector, its role in diversified growth portfolios remains strong.
⚠️ D. Crypto Markets — Flat to Red
• BTC and ETH posted slight declines YTD, contrasting sharply with metals and equities.
• Cryptocurrencies did not act as “digital gold” in 2025 — failing to preserve value relative to hard assets.
Implication: Risk on/off dynamics favored traditional safe havens over digital assets this year.
📅 3. 2026 Gold Price Forecasts — Institutional Consensus
Gold closed 2025 at record highs, and analysts project continued strength in 2026, with a wide range of forecast scenarios:
📈 Gold Price Forecasts for 2026
Forecast Source 2026 Target Notes
J.P. Morgan Global Research ~$5,055/oz (Q4) Strong demand & diversification drivers.
JP Morgan Private Bank / Argonaut ~$5,200–$5,300/oz Elevated institutional demand scenarios.
Goldman Sachs ~$4,900/oz Supported by central bank demand and rate cuts.
Bank of America ~$5,000/oz Broad institutional view.
UBS ~$4,500 (mid-year) Moderately bullish.
World Gold Council (Bear Scenario) ~$3,360–$3,990/oz Bearish if reflation reduces safe-haven demand.
Macro Consensus / Technical Models ~$4,000–$5,300/oz Consensus range based on surveys and models.
Longer-Term & High Estimates $6,000+ More speculative long forecast.
🧠 4. Strategy & Portfolio Implications
📌 Safe Haven Allocation
Given the robust 2025 performance and continued demand drivers, consider maintaining allocations to:
• Physical gold & ETFs
• Silver & industrial metals exposure
• Mining equities and royalty companies
📌 Growth & Innovation Exposure
Balance metals and defensive positioning with growth via:
• AI & semiconductors
• Biotechnology themes
• Select equities in cyclical markets
📌 Crypto Positioning
Given flat/red performance in 2025:
• Reassess crypto allocations relative to risk tolerance.
• Focus on long-term structural adoption catalysts if retaining exposure.
🏁 5. Conclusion
2025 reinforced the case for diversification across asset classes.
• Precious metals delivered standout returns — driven by safe haven demand, supply constraints, and monetary dynamics.
• AI technology and biotech remain secular growth themes, offering upside in equity portfolios.
• Crypto assets lagged traditional hedges, highlighting continued market segmentation in risk assets.
• 2026 gold price forecasts are broadly bullish, though with a wide range of scenarios — from conservative to highly aggressive institutional estimates.

XAUUSD – Trend Structure & Key Levels Reaction
Gold is currently respecting a clean ascending trendline, showing strong bullish structure after a corrective pullback. Price has reacted precisely from a marked support zone, confirming buyer interest and trend continuation potential.
The current move is approaching a major resistance zone, where reactions are expected. A healthy bullish scenario involves a pullback toward support or the trendline before continuation. Alternatively, rejection from resistance may trigger a deeper retracement into demand.
This idea focuses purely on market structure, trend alignment, and key supply & demand zones.
Wait for confirmation and manage risk accordingly.
Educational & technical analysis only. Not financial advice.

SOL/USDT | What is Solana doing? (READ THE CAPTION)By analysing the daily chart of SOL CRYPTOCAP:SOL , we can see that it is still struggling to make a move back up, currently being traded at 123.50. If this continues, a drop to 105 doesn't seem that far off.

Why Did XAUUSD Drop Sharply in the Latest Session?I don’t see this decline as abnormal. It is more the result of several factors aligning at the same time.
First, large-scale profit taking. Since the beginning of 2025, gold has gained more than 70%. As price approached the 4.55x area — a very strong psychological level — institutional money began locking in profits. Funds often distribute positions in a concentrated manner to optimize liquidity, which is why price dropped quickly instead of correcting gradually.
Second, the short-term macro backdrop has turned less supportive. The USD has seen a technical rebound, while US Treasury yields remain elevated around 4.1%, increasing the opportunity cost of holding gold. That alone is enough to create pressure when price is already in an overbought state.
Third, thin year-end liquidity. During the December 30–31 period, many funds have already closed their books. In such conditions, a single large sell order can push price much further than usual, making the move appear more aggressive than it actually is.
Finally, technical factors played a role. Price closed below the fast EMA, broke the short-term balance zone, and triggered stop-losses from trend-following long positions. This created a cascading sell effect that quickly dragged price down toward the 4.33x area.
The key takeaway: the larger structure remains intact. Price is still holding above the slower EMA and has not broken the H4 swing low around 4.28x–4.30x. Therefore, this move should be seen as a sharp correction within an uptrend, not a trend reversal signal.
Gold 30M – Support Hold After Strong Sell-Off Price broke the ascending trendline, showing **short-term bearish pressure** within a larger structure Strong support at 4,365–4,380**; holding this zone can trigger a corrective bounce.
* **Resistance at 4,430–4,445**; breakout above opens move toward 4,480–4,500 while a break below **4,360 invalidates the setup.

Gold (XAU/USD) Analysis: Gold Pullback After Strong Rally (READ)Today we are posting a new Gold analysis. After our last analysis, gold rallied strongly from $4337 to $4550, delivering more than 2100 pips of profit. After printing a new ATH at $4550, price faced strong selling pressure and has dropped to around $4461 so far.
The downside momentum is heavy, and my first bearish target is $4430. This level is very important. If price finds support there, we could see gold push higher again and move back toward levels above $4500.

GOLD 1H CHART ROUTE MAP UPDATE & TRADING PLAN FOR THE WEEKHey Everyone,
Please see our 1h chart levels and targets for the coming week.
We are seeing price play between two weighted levels with a gap above at 4542 and a gap below at 4517, as support. We will need to see ema5 cross and lock on either weighted level to determine the next range.
We will see levels tested side by side until one of the weighted levels break and lock to confirm direction for the next range.
We will keep the above in mind when taking buys from dips. Our updated levels and weighted levels will allow us to track the movement down and then catch bounces up.
We will continue to buy dips using our support levels taking 20 to 40 pips. As stated before each of our level structures give 20 to 40 pip bounces, which is enough for a nice entry and exit. If you back test the levels we shared every week for the past 24 months, you can see how effectively they were used to trade with or against short/mid term swings and trends.
The swing range give bigger bounces then our weighted levels that's the difference between weighted levels and swing ranges.
BULLISH TARGET
4542
EMA5 CROSS AND LOCK ABOVE 4542 WILL OPEN THE FOLLOWING BULLISH TARGETS
4568
EMA5 CROSS AND LOCK ABOVE 4568 WILL OPEN THE FOLLOWING BULLISH TARGETS
4596
BEARISH TARGETS
4517
EMA5 CROSS AND LOCK BELOW 4517 WILL OPEN THE FOLLOWING BEARISH TARGET
4487
EMA5 CROSS AND LOCK BELOW 4487 WILL OPEN THE FOLLOWING BEARISH TARGET
4467
EMA5 CROSS AND LOCK BELOW 4467 WILL OPEN THE SWING RANGE
4431
4404
EMA5 CROSS AND LOCK BELOW 4404 WILL OPEN THE SECONDARY SWING RANGE
4385
4362
As always, we will keep you all updated with regular updates throughout the week and how we manage the active ideas and setups. Thank you all for your likes, comments and follows, we really appreciate it!
Mr Gold
GoldViewFX

THE KOG REPORTTHE KOG REPORT:
In last week’s KOG Report we said we would be looking for the lower red box to be targeted, and if held, we wanted to long to test the high from there. Unfortunately, that level did not present itself ultimately resulting in the break above and then the red box targets being completed in one full sweep. We were a little stretched upside but Excalibur remained consistent and we managed to capture some decent trades not on upside but on the retracements for the RIPs as well.
Not a bad week at all not only on gold but the other pairs we trade and analyse.
So, what can we expect in the week ahead?
As we closed last week we have activations a little higher but without a pullback here I’m not comfortable entering new positions up here due to the shorter TF’s being overbought and sentiment still looking like it’s not convinced.
For that reason, and due to it being the last trading week of the 2025, we’re going to play caution here and instead look above for the RIPs unless our target level below is hit and we get a long from there.
So, we have the resistance level above at 4540 which will need to break for us to then target higher pricing, the pull back here should come from around the 4520 level which will need to hold us up. As long as it does, we see price attempting a new high but it’s that defence we want to watch for a clean reversal. If we can get that and the indicators align, short is the option for us attempting the break of 4520 and then the break of 4500 with the ideal target being the 4470 initially, 4455 and below that 4430-20 region.
The above is based on price remaining below the 4555-65 level.
RED BOXES:
Break above 4540 for 4555, 4565, 4570 and 4583 in extension of the move
Break below 4520 for 4510, 4504, 4490, 4479 and 4465 in extension of the move
Please do support us by hitting the like button, leaving a comment, and giving us a follow. We’ve been doing this for a long time now providing traders with in-depth free analysis on Gold, so your likes and comments are very much appreciated.
As always, trade safe.
KOG

Gold Pullback Toward 4,420 as Dollar Weakness Persists!Hey Traders,
In today’s trading session, we are monitoring XAUUSD for a potential buying opportunity around the 4,420 zone.
From a technical perspective, Gold remains firmly within a broader uptrend and is currently undergoing a controlled corrective phase. Price is approaching the 4,420 area, a key confluence zone combining trend support with a former support/resistance level — an area where buyers have previously stepped in.
On the fundamental side, the backdrop continues to favor Gold. The Federal Reserve’s December rate cut has reinforced downside pressure on the US Dollar, while incoming data keeps the door open for another potential rate cut at the January FOMC, further weighing on USD expectations. This persistent weak-dollar bias remains structurally supportive for Gold.
Additionally, concerns around Federal Reserve independence and rising political and geopolitical tensions are contributing to renewed safe-haven demand, providing an additional tailwind for the metal.
As long as price holds above the 4,420 region, the broader bullish structure remains intact, with pullbacks viewed as potential continuation opportunities rather than trend reversals.
Don't forget to boost the post and leave your opinion on the comment section.
Trade safe,
Joe

Gold - Today marks the official bullrun top!💣Gold ( OANDA:XAUUSD ) is creating its top formation:
🔎Analysis summary:
Over the course of the past couple of months, we witnessed an incredible rally of +140% on Gold. But this rally ended today, with Gold retesting a massive resistance trendline. And since Gold is totally overextended, it is now time for a healthy correction of -45%.
📝Levels to watch:
$4,500
SwingTraderPhil
SwingTrading.Simplified. | Investing.Simplified. | #LONGTERMVISION

GOLD 4H CHART ROUTE MAP UPDATE & TRADING PLAN FOR THE WEEKHey Everyone,
Please see our 4h chart route map and trading plan for the week ahead.
We are now seeing price play between two weighted levels with a gap above at 4545 and a gap below at 4484. We will need to see ema5 cross and lock on either weighted level to determine the next range.
We will see levels tested side by side until one of the weighted levels break and lock to confirm direction for the next range.
We will keep the above in mind when taking buys from dips. Our updated levels and weighted levels will allow us to track the movement down and then catch bounces up.
We will continue to buy dips using our support levels taking 20 to 40 pips. As stated before each of our level structures give 20 to 40 pip bounces, which is enough for a nice entry and exit. If you back test the levels we shared every week for the past 24 months, you can see how effectively they were used to trade with or against short/mid term swings and trends.
The swing range give bigger bounces then our weighted levels that's the difference between weighted levels and swing ranges.
BULLISH TARGET
4545
EMA5 CROSS AND LOCK ABOVE 4545 WILL OPEN THE FOLLOWING BULLISH TARGET
4609
EMA5 CROSS AND LOCK ABOVE 4609 WILL OPEN THE FOLLOWING BULLISH TARGET
4675
BEARISH TARGET
4484
EMA5 CROSS AND LOCK BELOW 4484 WILL OPEN THE FOLLOWING BEARISH TARGET
4413
EMA5 CROSS AND LOCK BELOW 4413 WILL OPEN THE FOLLOWING BEARISH TARGET
4335
EMA5 CROSS AND LOCK BELOW 4335 WILL OPEN THE SWING RANGE
4236
4173
EMA5 CROSS AND LOCK BELOW 4173 WILL OPEN THE SECONDARY SWING RANGE
4095
4040
As always, we will keep you all updated with regular updates throughout the week and how we manage the active ideas and setups. Thank you all for your likes, comments and follows, we really appreciate it!
Mr Gold
GoldViewFX

Gold Breaks Records This Christmas — What’s Next?For the first time in history, Gold ( OANDA:XAUUSD ) has reached new all-time highs during the Christmas period, setting a remarkable record.
The question now is whether gold will continue to rise.
It’s important to note that when an asset hits all-time highs, technical analysis can become a bit more challenging, and it’s crucial to consider previous support and resistance levels.
Personally, I find that taking long positions at all-time highs can be risky due to the high likelihood of overbuying, so I tend to be more cautious about entering new long positions.
This period is usually characterized by consolidation or mild directional moves, rather than strong breakouts.
Important trends and decisive moves in Gold often emerge after the holidays, when liquidity returns and institutional positioning resumes in early January.
At the moment, Gold has started to decline with the new week and is moving below the resistance zone($4,513-$4,492).
From an Elliott Wave perspective, it seems that the main wave 5 may have completed at these all-time highs, and the wave patterns are clearly visible, so we can wait for correction waves.
I expect that Gold may attempt to retest the support line, and if it breaks that support lines and the support zone($4,448-$4,426), it could potentially drop to around $4,393.
What do you think? Will 2026 be another bullish year for gold, or should we expect a correction? I’d love to hear your thoughts!
First Target: Support lines
Second Target: $4,393
Stop Loss(SL): $4,529(Worst)
Points may shift as the market evolves
💡 Please respect each other's opinions and express agreement or disagreement politely.
📌 Gold Analyze (XAUUSD), 1-hour time frame.
🛑 Always set a Stop Loss(SL) for every position you open.
✅ This is just my idea; I’d love to see your thoughts too!
🔥 If you find it helpful, please BOOST this post and share it with your friends.

Gold Don't let it CRACK!Nothing goes straight up forever, so don't let it CRACK! This is just basic charting stuff that everyone should be able to understand here.
A CRACK here does not mean it's done going up. How it cracks matters. We can reassess when more info comes in on the chart.
If you enjoy the work:
👉 Drop a solid comment
Let’s push it to 6,000 and keep building a community grounded in raw truth, not hype.

TheGrove | GOLD SELL | Idea Trading AnalysisYou can expect a reaction in the direction of selling from the specified resistance zone
GOLD moving higher as it tests the strong resistance level..
We expect a bearish move from the confluence zone.
Hello Traders, here is the full analysis.
I think we can soon see more fall from this range! GOOD LUCK! Great SELL opportunity GOLD
I still did my best and this is the most likely count for me at the moment.
-------------------
Traders, if you liked this idea or if you have your own opinion about it, write in the comments. I will be glad 🤝

Gold Drops More Than 200 USDAt the close of trading on December 29, gold plunged 201 USD to 4,331 USD. In the following session on December 30, prices edged slightly higher to around 4,350 USD.
The precious metal had set a new peak late last week at 4,548 USD, but the rally was quickly reversed. This move is largely attributed to aggressive profit-taking and year-end liquidation by short-term futures traders.
So far, although gold has shown some short-term volatility on the chart, the magnitude remains manageable. However, strong selling pressure may persist today and tomorrow, potentially leading to more significant price swings—especially if the current price channel is decisively broken.
If gold rebounds sharply in the coming days, today’s low could become the latest reaction low within the broader uptrend. In other words, price action over the next two sessions will be critical in determining gold’s direction in the weeks ahead.
From a technical standpoint, the next upside objective for February gold futures bulls is a break above the strong resistance at the record high of 4,548 USD. On the downside, bears are aiming to push prices below the key technical support at 4,200 USD.
What’s your view on where XAUUSD is heading next? Share your thoughts in the comments.

GOLD (xauusd): towards $5000?Hi!
Gold remains in a strong bullish structure, having formed a clear impulsive leg from late August, followed by a healthy corrective phase. The correction held above the prior breakout zone, confirming this area as demand rather than distribution. Price is currently consolidating just below a key resistance band around 4,350–4,380, which acts as the decision zone for the next major move.
If price breaks above this resistance with strong momentum and acceptance, the bullish continuation scenario remains valid. In that case, the first upside target lies near 4,694, followed by an extended projection toward the 5,020 area based on the impulse leg expansion.
Alternatively, failure to break higher may result in a deeper correction. A strong bearish break below the corrective structure would open the door for a move toward the major demand zone around 3,576, where buyers previously entered aggressively.
RSI remains elevated but constructive, suggesting momentum is still supportive of a breakout rather than exhaustion.
Disclaimer: As part of ThinkMarkets’ Influencer Program, I am sponsored to share and publish their charts in my analysis.

XAUUSD – Developing Structure & Daily RSI Bearish DivergenceGold is currently trading near the upper boundary of a developing rising structure on the daily chart. This structure is not yet fully confirmed, but price is reacting from a potential resistance zone while momentum is weakening.
Price is attempting to extend higher, however RSI (14) is forming a lower high — creating a bearish divergence. This does not necessarily signal a major trend reversal, but it does warn of possible exhaustion and a corrective phase.
Important context:
The current daily candle still has around 12 hours until close.
We are in the Christmas / year-end holiday period with thin liquidity, which increases the probability of sharp moves and profit-taking reactions.
Personal bias / expectation:
I do not expect a deep bearish reversal at this stage. My primary expectation is a phase of profit-taking and a controlled pullback rather than a full trend change.
Possible corrective objectives:
• Return to the previous ATH zone.
• Mean reversion into the mid of the developing structure / prior consolidation base.
Confirmation trigger:
A bearish displacement candle breaking below the most recent higher low would be the first sign that profit-taking is expanding.
Invalidation:
Strong daily acceptance above the current highs with improving RSI structure would delay or cancel the corrective scenario.
This is a technical perspective based on structure and momentum, not financial advice.
