Silver prices surge due to the supply tightnessSilver briefly hit another record high at 78, then stabilized at above 57 due to the concern over the lack of supply in LME and SHFE. Meanwhile, demand from not only Solar PV but also EV and data center continues to surge, putting more pressure on the storage.
Meanwhile, China’s silver exports hit a record 660 tons in Oct, underscoring strong demand amid tightening global supply.
However, the gold/silver ratio fell to 74, near the average 25-year of 69, which could limit the rally.
XAGUSD rebounded from EMA21 and formed higher swings within the ascending channel. Diverging bullish EMAs reinforce its uptrend.
A break above the channel’s upper bound near 60.00 could prompt a rally toward the potential resistance at 63.00.
By Van Ha Trinh - Financial Market Strategis at Exness
Gold

Gold Maintains Bullish Structure, Targeting 4,250–4,285Hello everyone,
On the XAUUSD 4H chart, gold has finally broken free from its consolidation phase, surging toward 4,238 USD after spending several sessions compressing around the 4,200 zone. The bullish structure remains intact and well-defined, with higher highs, higher lows, and a steady sequence of FVGs forming beneath price—acting as stepping stones that continue to support buyers.
Just below the current level, the 4,205–4,215 imbalance serves as a reasonable area for a shallow pullback. If sellers gain more traction, gold may retrace toward 4,174–4,150, where older imbalances converge with dense liquidity—likely strong enough to maintain the broader uptrend.
On the upside, buyers are now eyeing the 4,250 region, followed by the November high near 4,285.6 USD. A breakout above 4,286 could unlock a stronger rally toward 4,320–4,350 as momentum builds.
From a news perspective, this week is sensitive as markets digest key US data: PMI, ADP, jobless claims, and especially core PCE—the inflation gauge the Fed monitors most closely. According to Kitco, sentiment is leaning toward the possibility of earlier rate cuts, which continues to support gold’s upward bias. Analysts such as Colin Cieszynski and Jim Wyckoff also note that buyers are regaining confidence, adding further strength to the bullish narrative.

Gold is still showing us it's bearish intent on the macroEasy peasy reading on the week so far. Let me know if I missed anything. I'm here for the sharing of info 💎

Gold Update 02DEC2025: Multiple Options Are PossibleThe price has been stuck in the range as expected for wave 4
Let’s navigate this chaos and build viable paths on the chart
Option 1: Ending Diagonal wave 5 — pink marks
This option is based on the idea that wave 4 looks disproportionately large compared to wave 2
It could already be over after the first large move down to the $3,900 area
The current ascending zigzag may be shaping an Ending Diagonal in wave 5 to retest the former top around $4,400
Option 2: Triangle — orange marks
I left this path on the chart last time for visualization and it still could play out
Waves A and B could be completed with waves C, D, E ahead
Option 3: Large sideways consolidation (range, box) — white marks
This scenario implies a flat correction within the established $4,400–$3,900 range
Which path do you think the price will take?
Share your thoughts in the comments below

Stop!Loss|Market View: EURUSD🙌 Stop!Loss team welcomes you❗️
In this post, we're going to talk about the near-term outlook for the EURUSD currency pair☝️
Potential trade setup:
🔔Entry level: 1.16650
💰TP: 1.17291
⛔️SL: 1.16306
"Market View" - a brief analysis of trading instruments, covering the most important aspects of the FOREX market.
👇 In the comments 👇 you can type the trading instrument you'd like to analyze, and we'll talk about it in our next posts.
💬 Description: The mid-term outlook remains on the sellers' side, so given current prices, selling is appropriate, targeting at least 1.14000. In the short term, a further upward move is highly likely, aimed at breaking the resistance at 1.16600. In this case, a short-term buy could be looked for, but with targets no higher than 1.17500, as the mid-term move is likely to be downward.
Thanks for your support 🚀
Profits for all ✅

GOLD ANALYSIS 12/01/20251. Fundamental Analysis:
a) Economy:
• USD:
The USD continues to weaken as the market prices in Fed rate cuts in 2026. The downward pressure on the dollar provides strong support for gold.
• U.S. Stocks:
U.S. equities edged higher on rate-cut expectations, but the gains are modest → cash flow is not fully risk-on, so gold maintains its safe-haven role.
• FED:
The Fed has signaled the end of its tightening cycle and opened the door to rate cuts starting in Q1/2026 → a strong medium-term catalyst for gold.
• TRUMP:
The Trump administration prioritizes increased defense spending, tax cuts, and tighter trade policies against China. This increases geopolitical risks → continues to support gold prices.
• Gold ETF – SPDR:
SPDR remains inactive, neither buying nor selling. During a long-term uptrend, the fact that SPDR is not selling is a positive signal.
b) Politics:
• Middle East tensions rising again.
• Russia–Ukraine conflict not cooling down.
• U.S.–China trade tensions may escalate.
• China–Japan tensions: Coast guard vessels from both countries repeatedly approach the Senkaku Islands. Japan is increasing military cooperation with the U.S., and China is responding strongly.
• The Trump administration is increasing pressure on Venezuela, threatening to re-impose heavy sanctions if no policy changes occur.
→ Geopolitical risks are rising, continuing to support gold prices.
c) Market Sentiment:
• Market sentiment is neutral–bullish.
• Geopolitical risks + Fed pivot expectations help maintain defensive cash flow.
2. Technical Analysis:
• Gold has broken out of the consolidation triangle and is retesting the previous resistance trendline → now acting as support.
• MA50 & MA20 are trending upward, indicating sustained bullish momentum.
• The 4,186 – 4,200 zone is an ideal retest area for price to rebound.
• Short-term targets: 4,274 → 4,300 → 4,380.
• Only if price breaks below 4,146 will the short-term trend weaken.
Overall technical view: Uptrend established – wait for retest to BUY safely.
RESISTANCE: 4,244 – 4,274 – 4,380
SUPPORT: 4,186 – 4,146 – 4,095
3. Previous Market Session (28/11/25):
• Gold traded in a narrow range, tested the upper trendline, and bounced back.
• No major movement due to lack of big news and SPDR staying inactive.
• Buyers maintain underlying support but not yet strong enough for a breakout.
• Price action mainly technical-driven.
4. Strategy for Today (01/12/25):
🪙 SELL XAUUSD | 4277 – 4275
SL: 4281
TP1: 4269
TP2: 4263
🪙 BUY XAUUSD | 4191 – 4193
SL: 4187
TP1: 4199
TP2: 4205

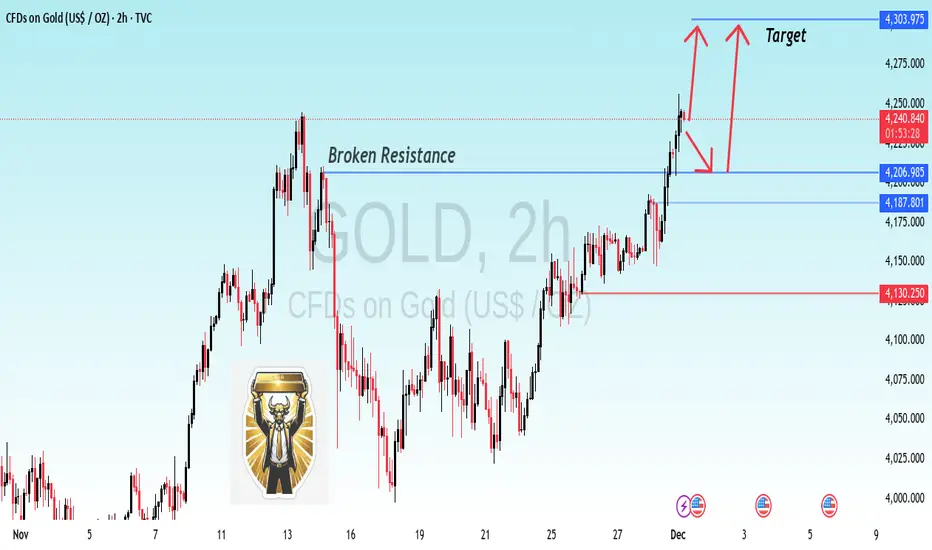
GOLD Breakout Confirmation Bulls trakin ControlUPDATE: Previous GOLD Idea Hit 100% Exactly as Expected! | JT_CHARTsMaster
The last analysis played out perfectly — GOLD followed the exact structure, respected the levels, and completed the move with full accuracy.
Thank you to everyone who supported the previous idea!
---
📌 Current Analysis (2H Timeframe)
Gold has broken the key resistance zone, and price is now retesting the breakout area.
After this clean retest, the market is showing signs of bullish continuation.
Key Points:
✔ Previous resistance now acting as support
✔ Break–retest–continuation structure is active
✔ Market is holding above the breakout zone
✔ Bullish momentum is building toward the next targets
---
📈 Expected Move
As long as gold stays above the breakout level, the probability of a move toward the next targets remains strong.
I’ve highlighted the expected upward move on the chart with arrows for clarity.
---
🙏 Thanks for Your Support
Your boosts, comments, and likes motivate me to share more accurate analyses like this.
👉 If you found this helpful, please Boost the idea and leave a comment — it really helps!
— JT_CHARTsMaster
XAUUSD: Bearish Correction Targets $3822 amidst Uptrend.Scenario: Bearish Corrective Move within a larger Uptrend.
Current Price (Approx.): $4,218.81
Chart Context: Price has already retraced from the recent high of $4,381.73 and is currently hovering near the 0.236 Fibonacci Retracement ($4,249.74) and above the 0.4 Fibonacci Retracement ($4,158.02).
Key Levels
Key Resistance Zone (Potential Reversal): $4,338 (Close to the recent high/start of the pullback).
Primary Target (Take Profit): $3,822 (Coincides with the 1.0 Fibonacci Retracement level of the structure shown, indicating a full retracement of the move from $3,822.46 to $4,381.73).

XAUUSD — Long-Term Bullish Structure Toward 4708.76Market Structure
Gold remains in a strong long-term bullish trend, supported by higher-timeframe momentum and repeated accumulation phases. The current price action is consolidating above major structural supports, keeping the long-term upside target 4708.76 valid.
Key Support Zones
Key Support Zone 1 — 3839
This is the primary structural floor. As long as price holds above 3839, the bullish trend remains intact and the path toward the higher target stays open.
A clean bounce from this zone would reinforce the bullish continuation.
If 3839 Breaks — Key Support Zone 2 — 2775
A decisive breakdown below 3839 would signal a deeper correction toward the secondary support at 2775.
This zone represents a major historical demand area, where large-scale buying interest is expected to reappear. A hold above 2775 would maintain the long-term bullish macro outlook.
Main Target
4708.76
This is the projected long-term extension target based on the broader impulse wave. As long as gold stays above 3839, the probability of reaching this upper target remains high.

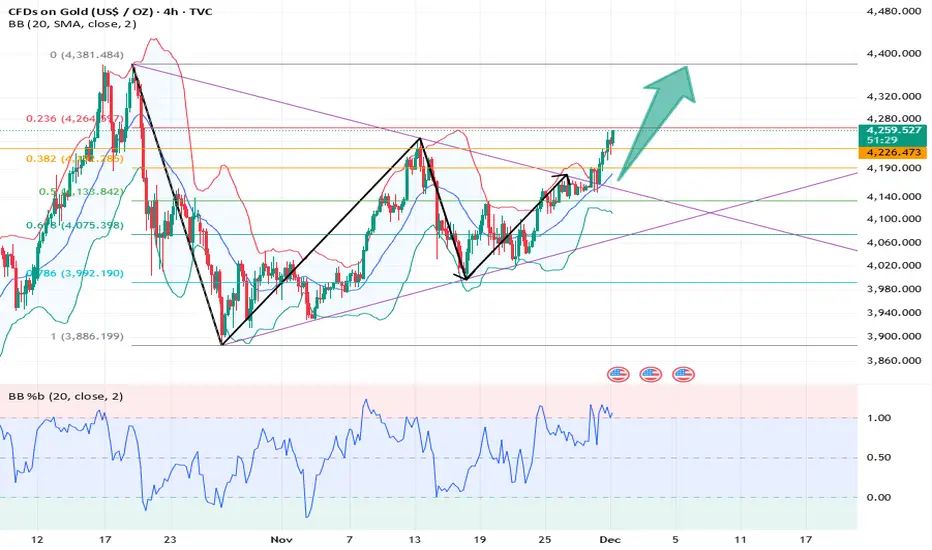
Will gold continue to rise?Gold closed with a doji candlestick on the daily chart, showing a slight increase. The latest 5-day and 7-day moving averages (MA5/MA7) have moved up to support at 4200/4183, while the 10-day and 7-day moving averages (MA10/MA7) remain in an upward crossover. On the short-term 4-hour chart, gold tested the upper Bollinger Band at 4264 before pulling back. On the hourly chart, the Bollinger Bands are narrowing, moving averages are closely aligned, and the RSI indicator is adjusting near the midline. Gold is currently in a period of consolidation and indicator correction. The key focus today is the strength of the pullback and correction; a decline followed by a rise is expected initially, with the Asian session focusing on the continuation of the pullback.
The current market is in a phase of upward momentum. Based on historical patterns, this typically represents the initial accumulation phase for potential high-level selling. A market turning point is expected as early as early December, and at the latest, mid-December. The momentum of this upward surge is likely to last for two to three days at the beginning of the month, i.e., from Monday to Wednesday this week. Once this short-term momentum weakens, a sharp reversal is possible, initiating a technical correction. Therefore, it is advisable to avoid blindly chasing the price higher during this period.
A clear understanding of the overall market trend is still necessary: we are undoubtedly in a major bull market cycle, and pullbacks are simply accumulating energy for a healthy upward trend in the future. Therefore, the strategic approach should be to "buy on dips." Specifically, in the short term, gold faces resistance in the $4290-$4300 range. $4300, as a key psychological level, will be an important resistance reference area, and the area around it can be seen as the focus of short-term bullish and bearish struggles. Before a fundamental reversal of the trend, every effective pullback should be considered a buying opportunity.
Key Levels:
First Support: 4200, Second Support: 4183, Third Support: 4160
First Resistance: 4250, Second Resistance: 4268, Third Resistance: 4290
Gold Intraday Trading Strategy:
BUY: 4190-4195, SL: 4180, TP: 4210-4220;
SELL: 4255-4260, SL: 4270, TP: 4240-4230;
More Analysis →

Gold Continued Support Feasible - Next Target for $4500? I believe if the oscillators play out, we can have another trendline support, even with aroon down, it could be quite minimal and a retracement for $4500 support per oz is possible. Gold as an asset and commodity seems to be getting scarcer and the demand for Gold including even in electronics is something I expect will increase. As always, none of this is investment or financial advice. Please do your own due diligence and research.

4265 AND MORE..Looking at the gold chart on the 4-hour timeframe, you can see that the price consolidated above 4161 exactly according to the previous analysis, broke the resistance of 4245 and advanced to 4265. Currently, gold is trading in the range of 4237. If it consolidates above the 4161 range, we can expect further growth in the 4265 and 4311 ranges
با بررسی چارت طلا در تایم فریم 4 ساعته مشاهده
میکنید که قیمت دقیقا طبق تحلیل قبلی طلا بالای 4161 تثبیت شد مقاومت 4245 را شکست و تا 4265 رشد کرد.
درحال حاضر طلا در محدوده 4237 درحال ترید می باشد.
در صورت تثبیت بالای محدوده 4161 میتونیم انتظار رشد بیشتر در محدوده های 4265 و 4311 داشته باشیم .

USDCAD outcome!USDCAD moving up in the second half of the NY session. 2 possible outcomes in the Asian and London session. Bounce off TrendLine or Continue to RESISTANCE.

Major $XAG Cup & Handle Continues to play outSilver really has been the commodity of choice the last month or so. The move north has gone parabolic. We looked at silver a few weeks back when it (and #XAU) printed Weekly double tops. Well, that clearly failed! Their price failed to fall lower before rocketing back north.
Of course we're hearing all sorts of tales about manipulation and institutions/banks/families being on the wrong side on this strong move north. This was heightened by the conspiracy tales flying around the outage at the CME last Friday.
Whilst that might all make for good tales and gossip ultimately we're only interested if it offers us an opportunity. Certainly on the longer timeframes there's not really anything to reverse the present climb. My only caveat is that whenever price goes vertical it can rarely maintain that. So watch this space!

XAUUSD Another correction below 3900 is likely.Last week (November 24, see chart below), we gave a buy signal on Gold (XAUUSD), which has already hit Target 1 at $4180 and is about to hit Target 2 at $4275:
This time we move on to the longer time-frames, namely the 1W, where Gold's 2-year Channel Up suggests that another correction is likely at this point.
The reason is the 1D MA100 (black trend-line), which Gold has hit 3 times out of the 4 corrections it has had within this 2-year pattern. October's pull-back saw it pull-back just above the 1D MA50 (red trend-line) but it didn't break, something that always happened during these past corrections.
At the same time, it is very likely to hit the 0.382 Fibonacci retracement level (has done so 2 out of 4 times) once the 1D MA100 contact is made, which gives us a medium-term Target at $3860. That would make a perfect Higher Low on the Channel Up.
Notice also how during the past 3 corrections, the 1W RSI always hit the Support Zone. If this is get hit before the price reaches $3860, it is technically a good idea to take profit earlier.
---
** Please LIKE 👍, FOLLOW ✅, SHARE 🙌 and COMMENT ✍ if you enjoy this idea! Also share your ideas and charts in the comments section below! This is best way to keep it relevant, support us, keep the content here free and allow the idea to reach as many people as possible. **
---
💸💸💸💸💸💸
👇 👇 👇 👇 👇 👇

Review and plan for 2nd December 2025Nifty future and banknifty future analysis and intraday plan.
This video is for information/education purpose only. you are 100% responsible for any actions you take by reading/viewing this post.
please consult your financial advisor before taking any action.
----Vinaykumar hiremath, CMT

XAUUSD Bullish Continuation With Structure Support – Intraday ViGold continues to respect its rising structure after building higher lows. The recent pullback was absorbed inside the marked support region, and price is now pushing back toward the upper range.
The structure suggests strength as long as price holds above the lower support band.
Key Technical Areas:
Support / Hold Zone: 4,186 – 4,220 region
Reaction Area: 4,235 – 4,245
Resistance / Upper Range: 4,280 – 4,295
Technical Outlook:
As long as price remains above the support zone, bullish continuation remains possible toward the upper range. A clear hold above recent highs may open further upside potential, while a breakdown below support would invalidate the structure.
This is a technical analysis idea for educational and charting purposes only.
If you want, I can also give you:
✅ A shorter version
✅ A caption for social media
✅ A more professional/advanced version
✅ A matching hashtag set

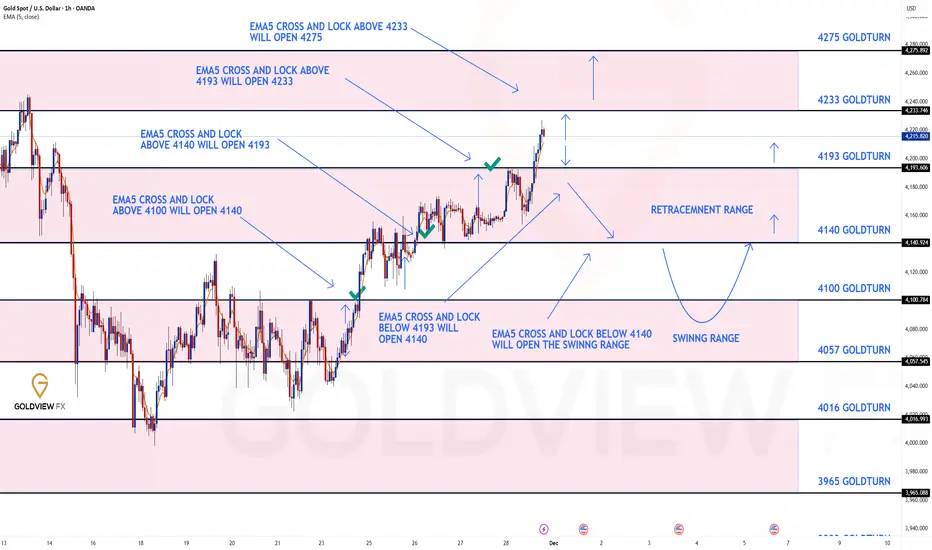
GOLD 1H CHART ROUTE MAP UPDATE & TRADING PLAN FOR THE WEEKHey Everyone,
Please see our 1h chart levels and targets for the coming week, which is still active and in play.
We are seeing price play between two weighted levels with a gap above at 4233 which is locked and a gap below at 4193 as support. We will need to see ema5 cross and lock on either weighted level to determine the next range.
We will see levels tested side by side until one of the weighted levels break and lock to confirm direction for the next range.
We will keep the above in mind when taking buys from dips. Our updated levels and weighted levels will allow us to track the movement down and then catch bounces up.
We will continue to buy dips using our support levels taking 20 to 40 pips. As stated before each of our level structures give 20 to 40 pip bounces, which is enough for a nice entry and exit. If you back test the levels we shared every week for the past 24 months, you can see how effectively they were used to trade with or against short/mid term swings and trends.
The swing range give bigger bounces then our weighted levels that's the difference between weighted levels and swing ranges.
BULLISH TARGET
4233
EMA5 CROSS AND LOCK ABOVE 4233 WILL OPEN THE FOLLOWING BULLISH TARGETS
4275
BEARISH TARGETS
4193
EMA5 CROSS AND LOCK BELOW 4193 WILL OPEN THE FOLLOWING BEARISH TARGET
4140
EMA5 CROSS AND LOCK BELOW 4140 WILL OPEN THE SWING RANGE
4100
4057
As always, we will keep you all updated with regular updates throughout the week and how we manage the active ideas and setups. Thank you all for your likes, comments and follows, we really appreciate it!
Mr Gold
GoldViewFX
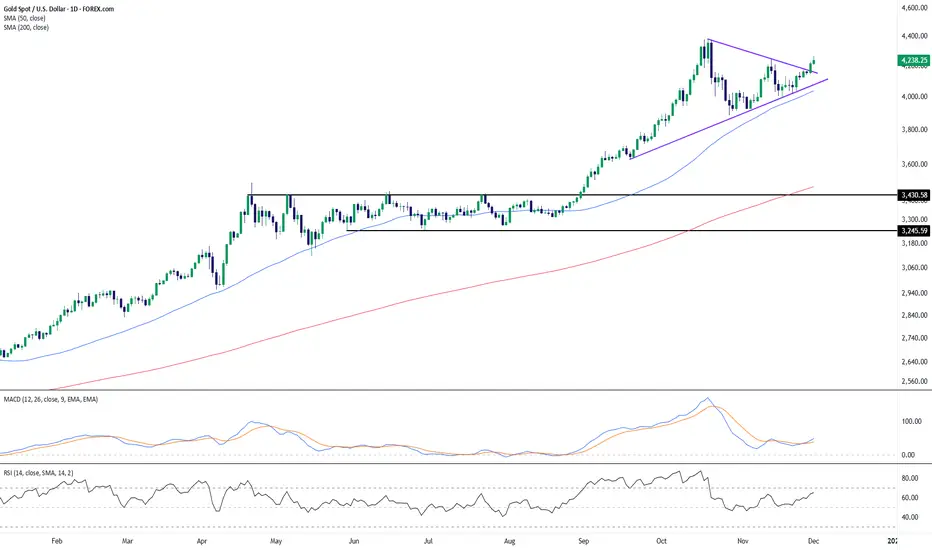
Gold Breaks Out of Triangle Structure as Trend Strength Remains Gold has pushed through the upper boundary of a contracting triangle formation, marking a continuation of the broader uptrend that has been intact since early in the year. The breakout follows several weeks of compression, with progressively higher lows aligning along a rising trendline, while buyers repeatedly tested the upper diagonal boundary.
The moving averages reinforce the constructive bias: price continues to trade well above both the 50-day SMA and the 200-day SMA, with the 50-day maintaining a strong upward slope. This places the current move firmly within a longer-term bullish structure, and the recent expansion in distance from the 50-day SMA highlights renewed upward momentum following the consolidation phase.
Momentum indicators are also showing early signs of improvement. The MACD lines have begun curling higher after a period of easing, suggesting that downside momentum has faded. RSI has climbed back into the mid-60s, reflecting strengthening buying interest without yet indicating overstretched conditions.
Overall, the breakout from the triangle aligns with the prevailing uptrend and indicates a return of bullish pressure. As always, how price behaves on any retest of the breakout area—or near the rising trendline—may provide additional insight into the durability of this momentum shift.
-MW
XAUUISD: Market Analysis and Strategy for December 1stGold Technical Analysis:
Daily Resistance: 4330, Support: 4150
4-Hour Resistance: 4265, Support: 4193
1-Hour Resistance: 4256, Support: 4226
The monthly chart's renewed upward movement reinforces the continuation of this year's bull market. Last Friday's strong rally indicates that the short-term upward trend has not been hindered, further strengthening bullish expectations for early December.
The daily chart continues last Friday's upward trend, with the "rounded bottom" candlestick pattern remaining intact. The Asian session also saw a strong upward breakout, with the Bollinger Bands expanding upwards, moving average support moving higher, and the MACD/KDJ indicators turning upwards. Today's accelerated breakout above previous highs is also a bullish signal. Short-term trading should follow the trend! Long-term holders can wait for the Fed's interest rate decision before considering buying opportunities!
Based on the 1-hour chart, gold continued its upward trend during the European session. The candlestick pattern is within an upward channel, and the short-term Bollinger Bands are narrowing upwards. Be aware of potential sideways consolidation followed by a rebound after indicator correction. Resistance is seen around 4260; a break above this level could lead to further gains towards 4300/4330. Support levels are around 4230/4222.
Trading Strategy:
BUY: 4230~4222
Selling should wait for a bearish pattern to emerge in real-time.
XAUUSD: possible scenario🛠 Technical Analysis: On the 4-hour timeframe, Gold is trading above the upper boundary of a large symmetrical triangle, where a "false breakout" scenario appears to be developing near the critical resistance at 4,250. The analysis anticipates a failure to sustain price action above this level, signaling a "bull trap" that could trigger a sharp reversal back within the triangle structure. A confirmed rejection here opens the path for a decline toward the immediate support at 3,917, with a medium-term objective at 3,700.
🌍 Fundamental Analysis: As full market liquidity returns following the US Thanksgiving holiday, the risk of volatility spikes and "fake-outs" remains high. Investors are turning their attention to this week's key US economic indicators, particularly today's ISM Manufacturing PMI and Friday's Non-Farm Payrolls (NFP) report. Any signs of US economic resilience could boost the Dollar and yields, weighing heavily on non-yielding assets like Gold and validating the technical rejection.
❗️ Trade Parameters (SELL) ❗️
➡️ Entry Point: Sell on confirmed return inside the triangle (approx. 4,140)
🎯 Take Profit: 3,917, medium-term target at 3,700
🔴 Stop Loss: Above the recent swing high/possible false breakout peak (approx. 4,350)
⚠️ Disclaimer: This is a potential trade idea based on current analysis; market conditions and price direction are subject to change based on news factors and volatility.

Gold bullish breakout supported at 4193The Gold remains in a bullish trend, with recent price action showing signs of a breakout within the broader uptrend.
Support Zone: 4193 – a key level from previous consolidation. Price is currently testing or approaching this level.
A bullish rebound from 4193 would confirm ongoing upside momentum, with potential targets at:
4284 – initial resistance
4313 – psychological and structural level
4350 – extended resistance on the longer-term chart
Bearish Scenario:
A confirmed break and daily close below 4193 would weaken the bullish outlook and suggest deeper downside risk toward:
4161 – minor support
4134 – stronger support and potential demand zone
Outlook:
Bullish bias remains intact while the Gold holds above 4193. A sustained break below this level could shift momentum to the downside in the short term.
This communication is for informational purposes only and should not be viewed as any form of recommendation as to a particular course of action or as investment advice. It is not intended as an offer or solicitation for the purchase or sale of any financial instrument or as an official confirmation of any transaction. Opinions, estimates and assumptions expressed herein are made as of the date of this communication and are subject to change without notice. This communication has been prepared based upon information, including market prices, data and other information, believed to be reliable; however, Trade Nation does not warrant its completeness or accuracy. All market prices and market data contained in or attached to this communication are indicative and subject to change without notice.

THE KOG REPORTTHE KOG REPORT:
In last week’s KOG Report we said we would be looking either price to push up into our red box and give us a short, or, price to attempt that 4040 level and bounce, giving us the opportunity to go long. We got in on that long, and then just carried it for most of the week, resulting in not many updates apart from the continued path and a successful week to close.
It was a bit nervy with the ranging, but our hot spots worked well, gave us added confidence and of course the algo performed exceptionally.
A fantastic week in Camelot, not only on Gold but the numerous other pairs we trade and analyse.
So, what can we expect in the week ahead?
Key levels here for the open are 4228 resistance and 4210 support. These are the levels that need to be monitored on the 15min red boxes for the break. A break above and we should see that high on the chart completed and potential for bears to come in and attempt the correction. While that flip is still active, above 4210 there is more upside to be had but the level sticking out to us this week is the 4260-70 region. This is the level that needs to break open and hold for us to go higher.
The issue I have at the moment is our liquidity indicators are suggesting a higher high but once that is made, there is a chance we get a sharp reversal and a clean rejection from one of these resistance levels can lead to a very aggressive decline all the way back down into the low 4000’s again. It’s a new day of a new month so caution is needed, the market may open with gaps, if that’s the case, best not to chase them, let it settle and then look for the set up.
RED BOXES:
Break above 4230 for 4237, 4247, 4250 and 4260 in extension of the move
Break below 4210 for 4199, 4195 and 4165 in extension of the move
Please do support us by hitting the like button, leaving a comment, and giving us a follow. We’ve been doing this for a long time now providing traders with in-depth free analysis on Gold, so your likes and comments are very much appreciated.
As always, trade safe.
KOG
