NZDCAD NZDCAD going short with 1:2 RR as overall it is in a downtrend with a strong pullback and confirmation to go short.
Gold

GOLD outcome.GOLD is pulling back in Asian session ans has been consolidating. Waiting for a climb going to London session.

XAUUSD – H4 Trend Structure Awaiting BreakoutXAUUSD – H4 Trend Structure Awaiting Breakout
Brian – Strategy to Buy on Pullback in Uptrend Channel
I. Strategy Summary
Gold continues its uptrend on H4, supported by the upward trendline from the 3,880–3,900 region.
The price is testing the resistance zone of 4,133–4,150, coinciding with the H4 supply and descending trendline, making short-term corrections likely.
Main strategy: wait for a pullback to support/FVG to buy with the trend, avoid FOMO buying at resistance.
Key levels to note: closing below 4,000 weakens the uptrend structure; below 3,884 risks shifting to a medium-term downtrend.
II. Macro Context
Unemployment Claims (weekly unemployment benefits):
Forecast: 226K
Previous: 220K
Higher-than-expected figures → indicate a weakening labor market, cooling economy, increasing the likelihood of the Fed easing sooner → real yields decrease, supporting gold.
Better-than-expected figures (lower than forecast) → support USD and bond yields, potentially causing short-term pressure on gold.
Geopolitical:
Trump's statement on easing "deadline" pressure for Russia–Ukraine negotiations ("the deadline will be when the issue is resolved") helps the market worry less about a hard deadline, but conflict risks remain. The demand for gold as a safe haven remains stable, not overly inflated but also unlikely to disappear entirely.
III. Fundamental Picture
Expectations for a rate cut cycle in 2025 continue to support gold as the market gradually prices in lower real interest rates in the medium to long term.
The demand for holding defensive assets persists amid slowing global growth and unresolved geopolitical hotspots.
In the short term, USD and US bond yields remain the two leading variables; any USD recovery can pull gold back to technical support areas, creating opportunities for buy-on-dip strategies.
IV. Technical Structure – H4 Trend Channel & FVG Zone
On H4, the price is moving within an uptrend channel, with the support trendline respected multiple times since the end of last month.
Above is the descending trendline connecting the nearest peaks, creating a price compression zone as the market approaches the 4,133–4,150 area. This is a confluence resistance zone:
The nearest swing high.
H4 supply zone.
Intersection with the descending trendline.
Notable price zones:
Resistance: 4,133–4,150 – a zone that may trigger short-term profit-taking and create a correction.
Near support/FVG: 4,078–4,080 – FVG zone combined with support after the previous breakout.
Psychological support: 4,000 – if H4 closes below this area, the uptrend structure weakens.
Medium-term reversal level: 3,884 – closing below here opens the risk of shifting entirely to a medium-term downtrend.
V. Trading Plan
Scenario 1 – Buy with the Trend (Priority)
Idea: wait for a shallow pullback to near support in the H4 uptrend channel and then buy.
Entry: 4,111–4,114
SL: 4,005
TP: 4,133 – 4,150 – 4,172 – 4,190
Scenario 2 – Buy Deep at FVG Zone
Idea: if a stronger pullback to FVG 4,078–4,080 occurs, take advantage of the good price zone to buy.
Entry: 4,078–4,080
SL: 4,073
TP: 4,100 – 4,115 – 4,142
VI. Risk Management & Notes
Limit opening new orders at the time of Unemployment Claims announcement due to potential volatility and spread widening.
If H4 closes below 4,000, reassess all current buy positions.
If H4/Daily closes below 3,884, consider the medium-term uptrend structure broken; prioritize staying out to observe or wait for a new downtrend scenario instead of continuing to look for buying points.

An Opportunity to Short GOLD You Can't MissOn the chart, gold continues to move smoothly within a clear downtrend channel, with highs and lows forming at progressively lower levels over time. Currently, the price is once again approaching the upper boundary of the channel and interacting with the same resistance area, where sellers have appeared multiple times before, pushing the market to reverse. This behavior indicates that the potential for a continued corrective move downward in line with the main trend remains intact.
In this context, I see a price decline toward the area around 4,080 as a logical and reasonable target for this corrective wave. As long as the price hasn’t decisively broken the upper boundary of the channel, I will continue to favor the scenario where the downward trend remains dominant, considering most upward movements as merely pullbacks within the existing structure.
This is not investment advice, but simply my personal viewpoint based on the current price action.

XAUUSD: Market Analysis and Strategy for November 25th.Gold Technical Analysis:
Daily Resistance: 4180, Support: 4000
4-Hour Resistance: 4155, Support: 4040
1-Hour Resistance: 4150, Support: 4100
Technically, the monthly chart maintains a strong upward trend, and the weekly chart indicates that bullish sentiment has persisted. 4040 is a key support level. After a significant rise, the daily chart suggests a continued bullish trend, with the Bollinger Bands expanding upwards and the moving averages moving higher. The 4000 support level has been confirmed and will likely provide strong support in the future. As mentioned in yesterday's analysis, "If gold recovers above 4085 in the short term, the upward trend can continue, with the 4140/4150 area to be watched again." This view has been confirmed, as 4150 has formed short-term resistance! Long-term holders can still wait for buying opportunities; the ideal long-term buying position for gold remains below 4000!
Looking at the 1-hour chart, gold rebounded after a decline in the European session. The Bollinger Bands are narrowing, and the candlestick pattern forms a rounded top, indicating a need to monitor the continuation of the downtrend. In the short term, the resistance level to watch remains around 4150.
Trading Strategy:
SELL: 4165~4170
BUY: 4097~4102
More Analysis →

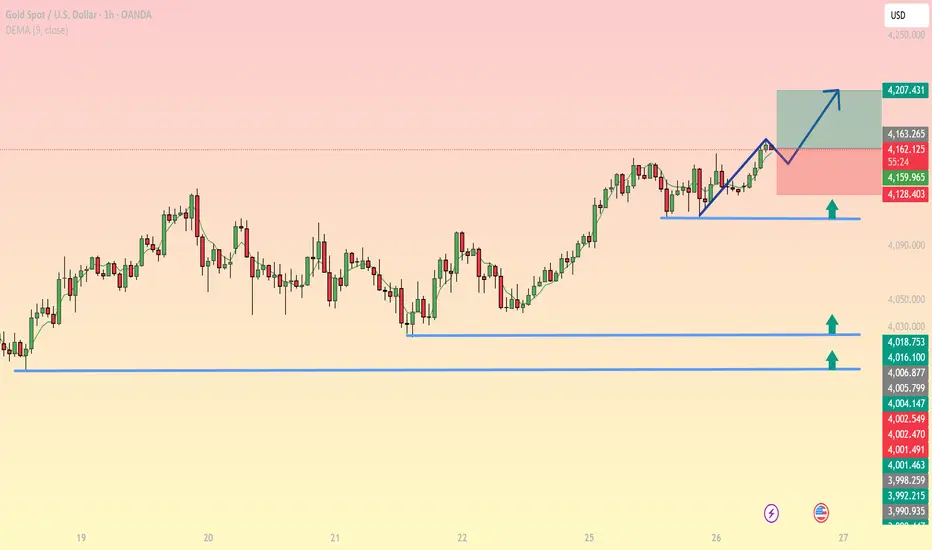
XAU/USD – Bullish Structure Intact as Price Retests Key HigherXAU/USD – Bullish Structure Intact as Price Retests Key Higher-Low Support
Gold continues to hold a solid bullish structure on the H1 timeframe, with price forming a clean higher low around 4128–4132 and bouncing strongly along the short-term rising trendline. The 9-EMA is pointing upward, confirming steady buying momentum.
This structure indicates that buyers are preparing for the next bullish expansion as long as price stays above the 4128–4135 support base.
Key Technical Levels
Major Support
4132 – 4128: Newly formed higher low and the strongest intraday demand zone.
4060 – 4030: Deep support, only tested if a strong correction occurs.
Major Resistance
4163 – 4167: Short-term resistance that needs to break for bullish continuation.
4207 – 4210: Fibonacci extension target and main upside objective.
Price Action & Momentum
Price consistently bounces from the 9-EMA → active buying pressure.
Rising trendline remains intact → bullish momentum sustained.
Small corrective candles near 4163 reflect weakening supply.
Bullish Trading Strategies (Primary Bias)
Scenario 1 – Buy the Retest (High-Probability Setup)
Wait for price to pull back into 4132 – 4135
Confirmation signals: pin bar, engulfing, or RSI holding above 50
Entry: 4132 – 4138
Stop Loss: below 4125
TP1: 4163
TP2: 4207
Scenario 2 – Breakout Entry
Buy after a clean H1 candle close above 4167
SL: 4148
TP: 4207
Bearish Scenario (If Market Invalidates Bullish Bias)
Only consider selling if:
Price breaks and closes below 4125 (H1 close)
Downside targets: 4080 → 4060
Market Outlook
The intraday trend remains strongly bullish, with expectations for an upside continuation toward the 4200+ zone. Watch closely how price reacts around 4163–4167 to confirm the next leg up.
GOLD opened with a significant increaseOANDA:XAUUSD opened the morning of November 26 with a significant gain, following a volatile session yesterday when the market absorbed two conflicting signals: unexpected progress in Russia-Ukraine peace talks and growing expectations that the Federal Reserve will cut interest rates as early as December.
In the European session yesterday, spot gold fell to a daily low of $4,109.47/ounce, as news that Ukraine had “basically” agreed to a US-proposed peace plan boosted global risk appetite. Market sentiment immediately reflected capital flows out of defensive assets.
However, in the New York session, gold reversed sharply, hitting a peak of $4,159.39/ounce, recovering nearly $50 from the previous low. At the end of Tuesday’s session, gold stood at $4,130.76/ounce, down slightly by 0.1%. By this morning, November 26, the price had returned to the $4,164/ounce area, up nearly 1% on the day.
Geopolitics: Peace Signals Weaken Need for Shelter, But Not Enough to Change the Game
Kyiv has agreed in principle to Washington’s peace proposal, according to US and Ukrainian officials. Some sensitive details remain to be worked out, but many contentious points have been tweaked. The Trump administration’s original 28-point plan has been whittled down to 19, with some provisions “at least worth considering,” according to The Washington Post.
Negotiations began in Geneva on November 23, and both Bloomberg and US officials described the process as streamlined to reach a quick deal. President Trump even declared a peace deal “very close.” This news immediately sent gold prices sharply lower yesterday, demonstrating that the market remains sensitive to geopolitical developments, even when peace signals are still preliminary.
Technical analysis and suggestions OANDA:XAUUSD
Gold price maintains the main uptrend on the daily chart, trading around $4,160/oz within the medium-term ascending channel. The price is currently above the short-term MA21 (~4,056) and has bounced from the support zone around Fib 0.382 (≈3.973); RSI is recovering slightly from the neutral zone, indicating weakening selling pressure.
The 4.128 (0.236 Fib) zone is the first short-term resistance; 4.216 is the key resistance that determines the possibility of opening a new bullish cycle (extremely important). If the price holds above 3.972–4.000 and closes sustainably above 4.128, the possibility of continuing to challenge 4.216 → 4.380 increases. Conversely, a break below 3.972 will weaken the bullish structure and open the door to the 3.846 (0.5 Fib) zone or lower.
Macro backdrop: Fed easing expectations and geopolitical risks continue to be the support base; positive news on interest rate cuts will increase the probability of a breakout above the 4.216 resistance.
BUY XAUUSD PRICE 4235 - 4233⚡️
↠↠ Stop Loss 4239
→Take Profit 1 4227
↨
→Take Profit 2 4221
SELL XAUUSD PRICE 4153 - 4155⚡️
↠↠ Stop Loss 4149
→Take Profit 1 4161
↨
→Take Profit 2 4167

Gold (XAUUSD): Possible buy setup in 30m timeframeGold (XAUUSD): Possible buy setup in 30m timeframe. Pass is clear, be strict to my tp and sl, otherwise you won't get any profit.
Cheers

Gold Weakens as Sellers Regain ControlHello everyone, gold is starting to lose its upward momentum when looking at the 4H chart: the price is hovering around 4,065 USD, right after a firm rejection from the 4,090–4,100 USD region. A series of small-bodied candles with long upper wicks suggests that buyers are slowing down, while sellers are stepping back in and taking control each time price approaches the supply zone above.
Technically, the Ichimoku cloud has flattened and begun tilting downward—a familiar sign of a weak, slightly bearish sideways market. Just overhead, the 4,090–4,100 USD zone aligns with an unfilled red FVG, forming a strong resistance layer that makes it difficult for gold to break higher. On the downside, the nearest support sits at 4,040–4,030 USD, where a green FVG and an old liquidity cluster previously triggered strong reactions.
The external backdrop doesn’t support gold either: the USD is recovering well following stronger-than-expected US economic data, the 10-year Treasury yield is holding around 4.1%, and US–EU equities continue rising thanks to Big Tech. Capital is moving away from safe-haven assets, leaving gold without much momentum to rebound in the short term.
Given all these signals, I lean toward one primary scenario: gold may pull back to retest the 4,040–4,030 USD zone in the coming sessions. If that area breaks cleanly, the next target would be 4,000 USD—a high-liquidity region that has produced strong bounces in the past. On the other hand, as long as 4,090 continues to reject price, gold is likely to remain in a tight 4,050–4,090 range rather than resume an immediate uptrend.
What do you think—will 4,040 hold this time, or will gold need to revisit 4,000 before finding new buying pressure?

Gold: Buyers Regain Control and Push the Trend FurtherHello everyone, the gold market is entering a fascinating phase — where each price swing seems to tell the story of buyers gradually reclaiming control. When placing the current technical structure alongside recent updates from Kitco News, one thing becomes clear: the probability of gold continuing higher in the coming sessions is stronger than any opposing signal.
During yesterday’s US session, gold held firmly above 4,100 USD/oz — a level that isn’t easy to sustain without meaningful underlying demand. What’s even more notable is that this happened while other markets were quiet because of the holiday mood. The ability of gold to stay resilient in such a muted environment suggests that accumulation is still flowing quietly beneath the surface.
This week, the market will face a series of key US data releases: Retail Sales, PPI, preliminary GDP, Jobless Claims, and PCE . Each of these is capable of acting as a fresh catalyst for gold — especially if US economic momentum cools or inflation continues to soften. That is precisely what the bullish side is hoping for.
At the same time, a report from El País hints that China may be purchasing more gold than what is officially disclosed. If true, this represents a persistent but hard-to-track source of demand — the kind of structural flow that can support a long-term uptrend even when surface-level sentiment wavers.
Technically, gold has broken out and closed firmly above the 4,080–4,100 FVG, with the Ichimoku cloud below forming a stable layer of support. The higher-low structure remains intact, signalling not just strength but control from the buyers. As a result, any pullback into support is likely to be accumulation rather than the start of a reversal.
Putting all these elements together, I lean toward a clear scenario: gold still has room to move higher. Price may first dip back to 4,100–4,080 to retest support before aiming for 4,200 — and if momentum cooperates, an extension toward 4,250, aligning with November’s high and a major technical barrier, is on the table.
With both news and technicals aligning convincingly, the bullish case remains my preferred outlook for now. What about you — what do you see on your chart?

GOLD → Psychological level retest before growth FX:XAUUSD breaks through consolidation resistance and renews its high to 4155. As part of a minor correction, a retest of 4100 may form and a battle for key support...
The probability of a Fed rate cut in December has risen to 81%. Fed members (Williams, Waller, Daly) supported the possibility of easing this year.
Progress in negotiations between the West and Ukraine with Russia reduces demand for defensive assets.
Gold remains sensitive to inflation and retail sales data. Strong figures could adjust rate expectations and limit growth, while weak data would support the bulls.
Technically, a retest of the 4110-4100 zone is forming. If the bulls hold their ground above this level, a new trading range of 4100-4150 could form.
Resistance levels: 4155, 4211
Support levels: 4111, 4100
The importance of the 4100 zone is that it is an area of imbalance and breakeven, a consolidation boundary, as well as a psychological level. Accordingly, the reaction to this area should be aggressive. If the reaction is weak, the price may be dragged below 4100. Otherwise, I expect consolidation above 4111 and further growth to 4155 (possibly to 4200).
Best regards, R. Linda!

Gold Setup: Breakout Levels MarkedGold is moving inside 4H symmetrical triangle and waiting for a proper breakout. Price is holding above the 4080-4120 and also above the rising trendline so the structure is still slightly bullish. If gold breaks above the upper trendline 4185 it can quickly move toward 4280 and then 4460. But if it breaks below the rising trendline 4060 and the support zone gold can fall toward 4000, 3900 and more to 3800.
Buy Setup
Buy Zone: 4080-4120 only if price shows support or a bounce
Breakout Buy: 4185 Above the upper black trendline
Targets: TP1 4280, TP2 4460, TP3 4555
Note
Please risk management in trading is a Key so use your money accordingly. If you like the idea then please like and boost. Thank you and Good Luck!

Gold Breakout and Potential RetraceHey Traders, in today's trading session we are monitoring XAUUSD for a buying opportunity around 4,080 zone, Gold was trading in a downtrend and successfully managed to break it out. Currently is in a correction phase in which it is approaching the retrace area at 4,080 support and resistance area.
Trade safe, Joe.

XAU/USD: Bullish Push to 4158?As the previous analysis worked exactly as predicted, FX:XAUUSD is eyeing a bullish push on the 1-hour chart , with price rebounding from a key support zone near cumulative sell liquidation, converging with a potential entry area that could ignite upside momentum if buyers defend against short-term dips. This setup suggests a reversal opportunity amid recent consolidation, targeting higher levels with strong risk-reward.
Entry between 4020-4032 for a long position🎯. Targets at 4158 (main). Set a stop loss at 3990 to limit exposure📊, yielding a risk-reward ratio of approximately 1:3 . Monitor for confirmation via a bullish candle close above entry with rising volume, leveraging gold's safe-haven appeal.🌟
Fundamentally , gold is attempting to stabilize above $4,000 after a sharp pullback, with early signs of a short-term rebound as markets digest fading Fed rate cut hopes and await key US data. Forecasts indicate an average of $3,675/oz by Q4 2025, but recent surges to $4,239 highlight volatility driven by ETF flows and central bank policies. 💡
📝 Trade Setup
🎯 Entry Zone (Long): 4020 – 4032
🎯 Target (TP1): 4158
❌ Stop Loss: 3990
⚖️ Risk-to-Reward: Approximately 1:3, offering a solid reward structure with defined downside.
What's your outlook on this setup? Drop your thoughts below! 👇

Gold H1 – Pre-NFP Liquidity Hunt as US–China Tone Warms🟡 XAUUSD – Intraday Smart Money Plan | by Ryan_TitanTrader (25/11)
📈 Market Context
Gold is approaching a key premium zone while markets react to fresh geopolitical headlines. Earlier today, Donald Trump confirmed he had a “very good call” with President Xi of China, highlighting strong bilateral relations and continued cooperation.
This matters for gold because:
• Warmer US–China relations often reduce geopolitical risk premiums, pressuring gold.
• The timing is critical: markets are entering NFP week, a period where institutions frequently engineer liquidity grabs.
• Traders may see a USD-supportive environment ahead of NFP, especially if risk sentiment stabilizes.
In short, gold is sitting in a zone where liquidity sweeps are highly probable before a larger move develops.
🔎 Technical Analysis (1H – SMC Structure)
• Market Structure
Price is climbing toward a major liquidity cluster around 4170–4172, aligning with previous equal highs and an unmitigated supply block.
Below, the FVG demand zone at 4102–4100 serves as today’s discount reaction zone.
• Premium Sell Zone (1H Supply)
4170 – 4172
• Buy-side liquidity sits above prior highs
• Clear premium zone relative to current swing structure
• Likely target for engineered sweep ahead of NFP volatility
• Discount Buy Zone (1H Demand)
4102 – 4100
• FVG imbalance + BOS origin
• Confluence with discount retracement levels
• Strong RR for bullish reaction after sell-side sweep
• Liquidity Map
• Buy-side: 4172 → 4180
• Sell-side: 4100 → 4092
Expect the classic SMC sequence:
Sweep → CHoCH → Displacement → Retest → Expansion.
🔴 Sell Setup – Premium Reaction
Entry: 4170 – 4172
Stop-Loss: 4180
Take-Profit:
→ 4138 (imbalance fill)
→ 4115 (mid-range liquidity)
→ 4102–4100 (discount zone retest)
📌 Must wait for liquidity sweep + bearish CHoCH on M5–M15.
🟢 Buy Setup – Discount Reaction
Entry: 4102 – 4100
Stop-Loss: 4092
Take-Profit:
→ 4135 (intraday reaction)
→ 4160 (premium edge)
→ 4170 (buy-side liquidity sweep)
📌 Valid only after sell-side liquidity is taken.
⚠️ Risk Management Notes
• Expect extra volatility as markets price in US–China optimism ahead of NFP.
• Liquidity traps are common during Asian/London sessions—wait for confirmation.
• Avoid taking positions inside the chop zone 4125–4150 without structure shifts.
• Treat both scenarios as liquidity plays, not trend continuation trades.
📝 Summary
Gold is approaching a major liquidity pocket as geopolitical sentiment improves following Trump’s positive call with President Xi.
With NFP approaching, institutions are likely to sweep liquidity above 4170 or below 4100 before establishing direction.
Key Levels Today
🔴 Sell Zone: 4170–4172
🟢 Buy Zone: 4102–4100
Prepare for the typical pre-NFP pattern:
Accumulation → Sweep → Displacement → Retest → Target.
📍 Follow @Ryan_TitanTrader for daily Smart Money updates.

Pre Open heads up on Gold. And overall draw. Bullish it isCOMEX:GC1!
Looking for higher prices on Gold. It should deliver towards the buyside and successive highs from here on. Need a CISD on the 4H timeframe

Gold 30-Min — Volume Sell Reversal Triggered⚡Base : Hanzo Trading Alpha Algorithm
The algorithm calculates volatility displacement vs liquidity recovery, identifying where probability meets imbalance.
It trades only where precision, volume, and manipulation intersect —only logic.
✈️ Technical Reasons
/ Direction — SHORT / Reversal 4134 Area
☄️Bearish rejection confirmed through sharp candle body.
☄️Lower-high forming beneath resistance supply region.
☄️Volume decreasing confirms exhaustion in price rally.
☄️Sellers regained imbalance with heavy top rejection.
☄️Algorithm detects fading demand and shift to control.
⚙️ Hanzo Alpha Trading Protocol
The Alpha Candle defines the day’s real control zone — the first battle of momentum.
From this origin, the Volume Window reveals where the next precision strike begins.
⚙️ Hanzo Volume Window / Map
Window tracked from 10:30 — mapping true market behavior.
POC alignment exposes institutional bias and breakout potential zones.
⚙️ Hanzo Delta Window / Pulse
Delta window monitors real buying vs. selling power behind each move.
Tracks volume aggression to expose who controls the candle — buyers or sellers.
When Delta aligns with Volume Map, momentum becomes undeniable.

Pre open Heads Up. Index NSYECME_MINI:NQ1!
Looking for bearish prices on the Index triads for this NYO while the overall thought process is bullish on the HTF

Gold (XAUUSD): Possible buy setupGold (XAUUSD): Possible buy setup. Here again, with another buy setup. Path is clear.
Cheers

Gold Momentum ShiftYesterday's gold momentum shifting towards downside. I'm bullish ahead of US open.

Gold – Watching for Bearish ReversalFundamental backdrop
Gold’s broader fundamental environment remains supportive: central-bank demand is historically strong, and geopolitical tensions continue to keep gold attractive as a safe haven. At the same time, short-term upside can still be limited if economic data comes in strong or yields push higher, which tends to pressure non-yielding assets like gold.
So the macro tone is mixed: long-term supportive, but near-term not necessarily bullish unless risk-off intensifies.
Technical view
On the 2H chart, the recent upward movement looks more like a corrective structure rather than a true impulsive reversal. The slope is soft, momentum isn’t convincing, and the structure fits a relief rally inside a broader bearish context.
I’m watching the resistance zone around 4183–4211 . Price may not need to reach the top of this zone to turn down — sometimes the market reverses slightly below when liquidity is already tapped.
For me, the key is confirmation , not the exact level. I want to see:
A break in short-term structure (BOS / CHoCH)
Clear rejection from supply
Momentum shifting back to sellers
If that rotation shows up, I expect the next bearish leg to unfold, potentially mirroring the size of the previous downswing.
Bias & target
My broader bias remains bearish , with a medium-term target below ~3900 unless structure is invalidated.
No early entries — waiting for confirmation is essential in this type of corrective environment.
Invalidation
A clean breakout and hold above the resistance zone would force me to reconsider the bearish view.

Gold (XAUUSD): Sell setup confirmedGold (XAUUSD): Sell setup confirmed. Price just gave us an opportunity to sell gold.
Cheers

Gold (XAUUSD): 15m timeframe idea, sell setupGold (XAUUSD): 15m timeframe idea, sell setup. I still believe in this trade, even more with the current pattern.
Cheers
