Gold Returns to a Sensitive Zone – Is the Downtrend Already DoneHello everyone, gold is undergoing a rather deliberate correction after dropping from 4,110. Price is now moving around 4,078–4,066 — low enough to make buyers cautious, yet not deep enough to trigger panic. I want to share my personal view on the most likely bearish scenario at the moment.
1. What is the market showing us?
On the H2 chart, price is sitting right at the edge of the Ichimoku cloud, supported by a green FVG and a thin buffer zone at 4,045–4,035. The sequence of small red candles last night resembles profit-taking rather than a trend reversal. It feels like the market is “offloading for comfort”, not capitulating.
The most notable area is the 4,045–4,035 support cluster:
this zone overlaps the nearest FVG and also marks the accumulation base from 19–20 November. It behaves like a natural stopping point — where price tends to return to gather liquidity before choosing its next direction.
2. The news factors pressuring gold
September’s NFP came in at 119k (vs 50k forecast), pushing rate-cut expectations lower. The USD strengthened, and the Fed gained more reasons to stay cautious as October’s report was combined into November.
At the same time, US and EU equities strengthened thanks to Big Tech leaders, with Nvidia’s strong earnings pulling capital out of safe-havens. The 10Y yield hovering around 4.1% and oil dropping to 59.5 USD further reduced gold’s appeal.
Overall, this is a news-driven pullback — a familiar “sentiment reset” after a heated rally.
3. The highest-probability bearish scenario (in my view)
I lean toward the scenario where price continues drifting toward 4,045–4,035 to gather liquidity and tap the FVG, then forms a rejection wick and rebounds toward the resistance zone at 4,095–4,115.
This is a technical rebalance after news, not a signal of a long-term trend reversal. As long as 4,000 holds, the market still has enough momentum for the next bullish leg.
Gold

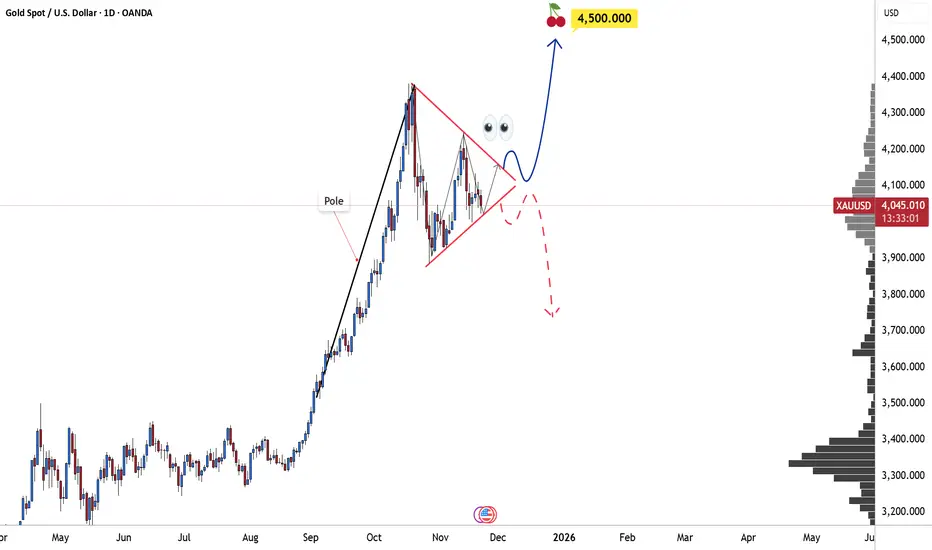
Gold at a Turning Point: Will It Rise or Fall?As we zoom in and take a closer look at how GOLD is moving, one thing becomes immediately clear:
The market has just shown a powerful upward surge, but now something intriguing is happening. The price is compressing, forming a tight, small triangle, a sign that the market is building up energy. In moments like this, there are usually two potential paths, but given the bullish context, I can almost feel that a breakout to the upside is the more likely scenario.
What do you think? Do you agree with me?
Let me know your thoughts in the comments! And trust me, joining the TradingView community is one of the best ways to improve your skills as a trader every single day.
Just a reminder: this isn't financial advice, but rather my personal take on the chart.
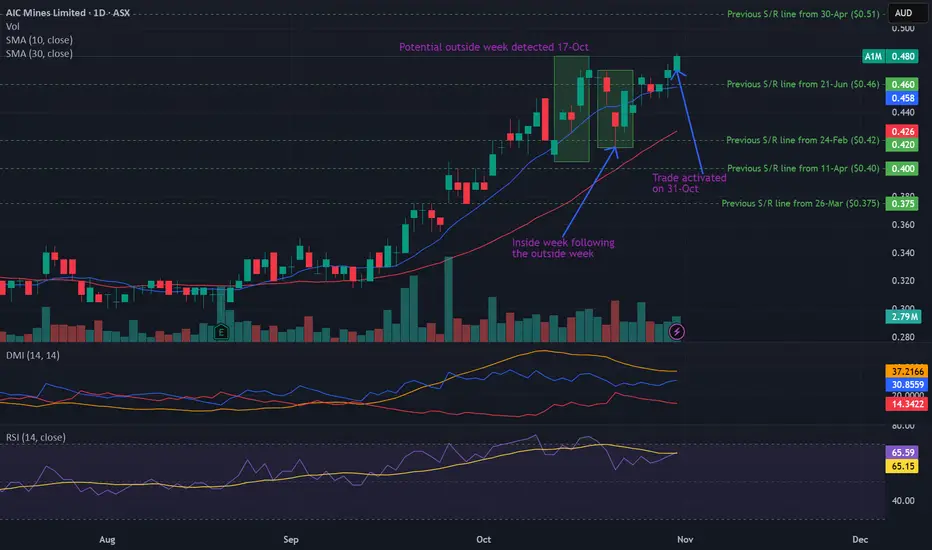
Potential outside week and bullish potential for A1MEntry conditions:
(i) higher share price for ASX:A1M above the level of the inside week following the potential outside week noted on 17th October (i.e.: above the level of $0.47).
Stop loss for the trade would be:
(i) below the low of the inside week on 22nd October (i.e.: below $0.415), should the trade activate.
GOLD Bullish Breakout! Buy!
Hello,Traders!
GOLD broke out of the bullish flag, confirming bullish momentum after absorbing sell-side liquidity. With structure shifting upward, price may extend toward the buy-side liquidity resting at the marked target level.Time Frame 5H.
Sell!
Comment and subscribe to help us grow!
Check out other forecasts below too!
Disclosure: I am part of Trade Nation's Influencer program and receive a monthly fee for using their TradingView charts in my analysis.

XRP all time highXRP is starting to reverse. Next week could be the week when it starts climbing to reach and break all time highs before or beginning of NEW YEARS.

GOLD DAILY CHART ROUTE MAPHey everyone,
Here’s the Daily Chart idea we’ve been tracking. The swing move into 4145 has now produced a candle body close above that level, which keeps the long term gap open toward 4325. We also saw a rejection with a candle body close below 4145, leaving 3165 open beneath. However, note that this rejection touched the channel half line, which based on our uniquely drawn goldturn channel typically provides strong support.
We’re seeing that support play out now with a bounce off the half-line.
At the moment, our key levels are:
Primary support: Channel half-line
Secondary support: 3961
Primary resistance: 4145
Long range gap target: 4325, which becomes more significant if we see the EMA5 cross and hold above 4145.
We’ll keep everyone updated as the week progresses.
Mr Gold
GoldViewFX

Gold H1 – Is This Just a Range or a Break Incoming?🟡 XAUUSD – Intraday Smart Money Plan | by Ryan_TitanTrader (21/11)
📈 Market Context
Gold continues to trade inside a compressed intraday range as markets react to the latest discussion on whether the Federal Reserve is likely to cut interest rates anytime soon.
According to new reports, policymakers remain cautious, and early rate-cut expectations are fading as inflation progress slows.
This shift pushes USD stronger, increases Treasury yields, and temporarily weakens gold’s bullish momentum.
Key takeaways from the news:
• Fed officials note that inflation is “still not where it needs to be,” reducing the probability of early rate cuts.
• Markets have scaled back expectations for a Q1 cut, keeping USD supported.
• Higher yields → tighter financial conditions → gold struggles to break premium levels.
• Institutions are likely engineering liquidity grabs on both sides before committing to a new directional move.
Price is currently sitting near the 4030–4045 zone, right above discount liquidity, waiting for a catalyst to break out of the short-term compression.
🔎 Technical Analysis (1H / SMC Structure)
• Market Structure:
Gold has completed a clear CHoCH + short-term bearish sequence and is now compressing into the discount zone around 4030.
• Premium Sell Zone (4H Supply):
4128–4130 aligns with unmitigated supply + buy-side liquidity resting above internal highs.
• Discount Buy Zone:
4030–4028 sits inside the last clean demand zone where a previous sweep occurred.
• Liquidity Map:
→ Buy-side liquidity: above 4128–4135
→ Sell-side liquidity: below 4028–4020
Institutions are likely to sweep one side before delivering direction.
🔴 Sell Setup (Premium Reaction Zone)
• Entry: 4128 – 4130
• Stop-Loss: 4140
• Take-Profit:
→ 4080 (minor imbalance fill)
→ 4045 (range EQ)
→ 4030–4028 (discount demand retest)
📌 Execution rule: Wait for liquidity sweep into the zone + bearish CHoCH on M5–M15 before entering.
🟢 Buy Setup (Discount Reaction Zone)
• Entry: 4030 – 4028
• Stop-Loss: 4020
• Take-Profit:
→ 4060 (short-term reaction level)
→ 4095 (inefficiency fill)
→ 4120 (premium retest)
📌 Valid only if price sweeps the 4030–4028 pocket and shows bullish displacement from discount.
⚠️ Risk Management Notes
• USD strength may spike unexpectedly as rate-cut bets fade — reduce position size during volatility.
• Avoid trading inside the 4045–4085 chop zone unless a clean structure break forms.
• Manage trades aggressively once liquidity levels are taken.
• Expect engineered manipulation during low-volume Asian hours.
📝 Summary
Gold is compressing inside a narrow intraday range as markets reassess the likelihood of Fed rate cuts.
SMC structure suggests a two-sided liquidity sweep before a decisive move:
• Sell Zone: 4128–4130 (premium supply)
• Buy Zone: 4030–4028 (discount demand)
Expect classic accumulation → sweep → displacement patterns until macro conditions create a new trend.
📍 Follow @Ryan_TitanTrader for more Smart Money updates.

XAUUSD: Market Analysis and Strategy for November 21Gold Technical Analysis:
Daily Resistance: 4150, Support: 4000
4-Hour Resistance: 4110, Support: 4010
1-Hour Resistance: 4085, Support: 4020
Technically, the weekly chart is likely to close with a doji today. Yesterday's daily chart closed with a doji, indicating a slowdown in the short-term upward trend and exacerbating the expectation of sideways consolidation. The Bollinger Bands are also narrowing, and the effectiveness of the 4040 support level needs to be monitored today. Meanwhile, the 4000 level is being tested again. If 4020 is broken, a short-term sell signal can be adopted. If the price can hold above 4085, a buy signal can be adopted, with the 4140/4150 area to be watched again. Long-term holders can still look for buying opportunities around the 3930/3920 level;
Looking at the 1-hour chart, gold rebounded after the European session, but after breaking below 4080, there's a possibility of further downside in the short term. Watch for support around 4020;
For the European and American sessions, the plan is to consider buying if a stabilization signal appears around 4005/4000.
Trading Strategy:
SELL: 4078~4085.
BUY: 4005~4000.
More Analysis →
XAUUSD Possible Sell Setup“Price has reacted from the higher-timeframe supply and respected the descending trendline. Current structure shows confirmed bearish order-flow with BOS/ChoCH sequences. The pullback is now testing fresh supply. Below the 4080 zone, bias remains bearish, with downside targets at 4040 and 4020 demand levels.”
XAUUSD Possible Sell Setup
Entry: 4075–4080
SL: 4092
TP: 4040 / 4020
Bias: Price rejected supply and is respecting the downtrend.

XAU/USD | Gold Rebounds Strongly After Hitting Key Demand Zone!By analyzing the #Gold chart on the 4-hour timeframe, we can see that after reaching $4105, the price dropped again and made a sharp move down into the $4026 demand zone I mentioned in the previous analysis. As soon as gold touched this zone, strong buying pressure kicked in, pushing the price back up to around $4080.
The next short-term supply zones to watch are $4090, $4100, and $4109.
The medium-term supply zones are $4150, $4172, and $4193.
Keep an eye on gold’s reaction in these areas, they can trigger new pullbacks or confirm further upside movement.
Please support me with your likes and comments to motivate me to share more analysis with you and share your opinion about the possible trend of this chart with me !
Best Regards , Arman Shaban

sell and short area for long term short setupone hour sell area for short, maybe long term. all signals are sell oriented, make sure you have your own idea and trade, I am not responsible for any trade taken according to my setup.

XAUUSD – Where Smart Money Strikes Today🌐 MARKET CONTEXT
Gold begins today’s session after a phase of controlled volatility, where price continued to sweep both sides of the range but failed to commit to a direction. The broader intraday structure remains bearish, with price rejecting premium levels and forming consistent lower highs.
Recent Drivers:
USD shows moderate resilience following firm Fed communication
Market sentiment cautious ahead of late-week economic announcements
No significant safe-haven inflow → neutral risk environment
Session Expectations:
London Session: Likely to trigger early liquidity sweeps above premium wicks
NY Session: Expected to deliver the main directional push
Bias: Bearish unless price reaches deep discount zones and prints a CHoCH
Price is currently trading within the middle of the intraday range → best setups remain at extremes (premium sells / discount buys).
📉 TECHNICAL ANALYSIS (SMC + LIQUIDITY STRUCTURE)
Market Structure
M30 structure remains bearish (Lower Highs → Lower Lows)
Current equilibrium zone: 4060–4080
Inducement stacking above 4147 and 4081
Liquidity Map
Buy-Side Liquidity (BSL): Above 4147 and 4081
Sell-Side Liquidity (SSL): Below 4033 and deeper cluster at 3993
These layers show engineered liquidity designed to trap impatient traders.
Imbalances (FVG Zones)
Bearish FVG: 4147–4148 → strong premium rejection zone
Minor FVG: 4079–4081 → ideal scalp sweep zone
Discount FVGs: 4033 and 3993 → high-quality buy reactions
🔑 KEY PRICE ZONES (Clear & Engaging Explanations)
4148–4147 ▶️ Premium Liquidity Trap – High-Probability Sell
This zone holds a clean bearish OB + untouched BSL above 4147.
Institutional traders typically use this area to trigger breakout buyers before reversing the move sharply downward.
4079–4081 ▶️ Mid-Premium Inducement – Scalp Rejection Zone
A compact liquidity pool sitting just above equilibrium.
Market often sweeps here during London session to induce buys before dropping.
4035–4033 ▶️ Discount Reaction Zone – Reliable Scalping Demand
Micro OB + SSL alignment makes this zone ideal for sharp intraday rebounds.
Expect fast reactions with minimal drawdown.
3995–3993 ▶️ Deep Discount Pool – Strong Reversal Zone
This region contains layered SSL + higher-timeframe discount confluence.
If price taps this zone, a significant intraday reversal becomes highly probable.
⚙️ TRADE SETUPS (SMC-Based, High Precision)
✔️ SELL SETUP 1 – Premium Rejection
Entry: 4148–4147
Stop-loss: 4126
TP1: 4135
TP2: 4105
TP3: 4080
Logic: BSL sweep + FVG mitigation → strong bearish displacement expected.
✔️ SELL SCALP – Mid-Range Liquidity Sweep
Entry: 4079–4081
Stop-loss: 4087
TP1: 4065
TP2: 4048
TP3: 4033
Logic: Sweep of inducement above mini-BSL before continuation down.
✔️ BUY SCALP – Intraday Discount Rebound
Entry: 4035–4033
Stop-loss: 4027
TP1: 4048
TP2: 4070
Logic: SSL sweep triggers a micro CHoCH → quick bullish bounce.
✔️ BUY SETUP 2 – Deep Discount Reversal
Entry: 3995–3993
Stop-loss: 3987
TP1: 4010
TP2: 4040
TP3: 4070
Logic: Key institutionally favoured zone → strong liquidity-driven reversal.
🧠 NOTES / SESSION PLAN
Only trade at extremes — avoid mid-range to prevent chop
Expect engineered fake-outs at London open
NY session likely delivers true directional movement
Wait for M5/M15 confirmation: CHoCH + BOS before executing
Avoid buying near premium zones to avoid falling into liquidity traps
🏁 CONCLUSION
Gold maintains a bearish M30 structure, favouring sell setups at 4147 and 4081.
Discount zones at 4033 and 3993 offer high-probability buy opportunities for intraday rebounds or full reversals.
Stay disciplined.
Let liquidity be your guide.
Strike only when the trap is set.

Breakout from a triangle pattern indicates a potential direction#XAUUSD OANDA:XAUUSD TVC:GOLD
From a trend perspective, gold is currently in a triangle consolidation range. As time goes on, the short-term resistance is also moving downwards. Therefore, gold did not provide us with a suitable opportunity to participate in trading last night. Gold is currently continuing its decline and may further test the 4025-4015 support level. If it pulls back to this level, we can consider a small long position in gold.
BEAR TRAP? - PATH TO 5KIllustrated, I am trying to visualize what the path to 5k could look like SHOULD this be a bear trap and 4000 major support price to hold ground.
Fundamentals keep getting bullish for gold, and demand at a central bank level simply does not stop.
The Fiat currency as we know it, is slowly loosing credibility, and the major shift toward a digital era backed by gold is not fiction anymore and rather quite potential.
The US MUST do what it can to save their reputation and economy, by devaluating the USD dollar and re-valuating the price of Gold, in order to artificially lower their debt. At least that's one way they're trying to pull this off...
REMEMBER: The reasons for WHY things happen almost never matter; what truly matters is WHAT is happening...
Gold is stuck in a corrective phase, and in my humble opinion, it's closer to the next bullish move than many might think.
GOOD LUCK,
persa

Gold Weak Below 4084 as Market Awaits PMI DataGOLD – Technical & Fundamental Outlook
FX:XAUUSD attempted a bounce from the 4030 support and is currently trying to approach the 4085 resistance, but overall momentum still appears weak.
From the fundamental side, recent data was mixed — NFP showed growth while the unemployment rate increased, creating higher volatility. Rate-cut expectations also remain muted, with markets pricing around 40% probability for another Fed cut, keeping the Fed cautious about premature easing.
Today, gold traders will monitor the PMI data, which may shape intraday volatility and short-term direction.
Technically Gold maintains a bearish structure in both the short and medium term while trading below 4084.
Below 4084, price is expected to retest 4030,
and a break below this zone can extend the decline toward 4008 – 3982,
as long as the fundamental backdrop remains unchanged.
On the upside, a 1H candle close above 4084 would invalidate the bearish setup
and open the door for a move toward 4104.
Pivot Line: 4051
Resistance: 4084, 4104, 4133
Support: 4030, 4008, 3982

Gold (XAUUSD): 15m timeframe idea, sell setupGold (XAUUSD): 15m timeframe idea, sell setup. Wait for price to close below the level. in this way both 1h and 15m are aligned and there is high chance to win both. I am already in 1h, waiting to add more with 15m.
Cheers

Gold 30-Min — Volume Sell Reversal Triggered⚡Base : Hanzo Trading Alpha Algorithm
The algorithm calculates volatility displacement vs liquidity recovery, identifying where probability meets imbalance.
It trades only where precision, volume, and manipulation intersect —only logic.
✈️ Technical Reasons
/ Direction — SHORT / Reversal 4065 Area
☄️Bearish rejection confirmed through sharp candle body.
☄️Lower-high forming beneath resistance supply region.
☄️Volume decreasing confirms exhaustion in price rally.
☄️Sellers regained imbalance with heavy top rejection.
☄️Algorithm detects fading demand and shift to control.
⚙️ Hanzo Alpha Trading Protocol
The Alpha Candle defines the day’s real control zone — the first battle of momentum.
From this origin, the Volume Window reveals where the next precision strike begins.
⚙️ Hanzo Volume Window / Map
Window tracked from 10:30 — mapping true market behavior.
POC alignment exposes institutional bias and breakout potential zones.
⚙️ Hanzo Delta Window / Pulse
Delta window monitors real buying vs. selling power behind each move.
Tracks volume aggression to expose who controls the candle — buyers or sellers.
When Delta aligns with Volume Map, momentum becomes undeniable.

Gold key support at 4009The Gold remains in a bullish trend, with recent price action showing signs of a corrective pullback within the broader uptrend.
Support Zone: 4009 – a key level from previous consolidation. Price is currently testing or approaching this level.
A bullish rebound from 4009 would confirm ongoing upside momentum, with potential targets at:
4110 – initial resistance
4150 – psychological and structural level
4220 – extended resistance on the longer-term chart
Bearish Scenario:
A confirmed break and daily close below 4009 would weaken the bullish outlook and suggest deeper downside risk toward:
3975 – minor support
3933 – stronger support and potential demand zone
Outlook:
Bullish bias remains intact while the Gold holds above 4009. A sustained break below this level could shift momentum to the downside in the short term.
This communication is for informational purposes only and should not be viewed as any form of recommendation as to a particular course of action or as investment advice. It is not intended as an offer or solicitation for the purchase or sale of any financial instrument or as an official confirmation of any transaction. Opinions, estimates and assumptions expressed herein are made as of the date of this communication and are subject to change without notice. This communication has been prepared based upon information, including market prices, data and other information, believed to be reliable; however, Trade Nation does not warrant its completeness or accuracy. All market prices and market data contained in or attached to this communication are indicative and subject to change without notice.

GOLD: Bullish Continuation & Long Signal
GOLD
- Classic bullish formation
- Our team expects growth
SUGGESTED TRADE:
Swing Trade
Buy GOLD
Entry Level - 4037.7
Sl - 4028.4
Tp - 4056.7
Our Risk - 1%
Start protection of your profits from lower levels
Disclosure: I am part of Trade Nation's Influencer program and receive a monthly fee for using their TradingView charts in my analysis.
❤️ Please, support our work with like & comment! ❤️

XAU/USD – Bullish Recovery Structure on H1XAU/USD – Bullish Recovery Structure on H1, Buyers Preparing for a Potential Breakout
Gold is developing a clear W-pattern on the H1 timeframe, signaling that bullish momentum is gradually returning after a prolonged consolidation phase. Price continues to form higher lows while respecting major support zones, indicating a possible bullish continuation for today’s session.
Market Structure & Price Behavior
After the sharp drop, XAU/USD is forming two equal lows and recovering with a higher-low structure.
The previous descending trendline has been broken, and price is building a base for a potential upward leg.
Short-term EMAs are starting to turn upward, reflecting improving bullish momentum
RSI remains neutral, giving enough room for an upside move.
Key Technical Levels
Support Zones:
• 4020 – 4030
• 3995 – 4005 (major support – bottom of the W-pattern)
Resistance Zones (Bullish Targets):
• 4140 – 4150 (neckline of the W-pattern)
• 4200 – 4220 (strong supply area)
• 4260 – 4280 (extended target if breakout accelerates)
Trading Strategies for Today
1. Trend-Following Buy Setup
Wait for a dip toward 4020 – 4030 or 4000 – 4005.
SL: below 3990
TP: first target at 4140 – 4150, extended to 4200 – 4220 if momentum strengthens.
2. Breakout Buy Setup
Buy when price closes firmly above 4145 on H1.
SL: below 4125
TP: 4200 – 4220
Outlook
The forming W-pattern and stable support levels indicate a bullish bias unless the market breaks below 3990, which would invalidate the current structure. Until then, buyers maintain a clear technical advantage.

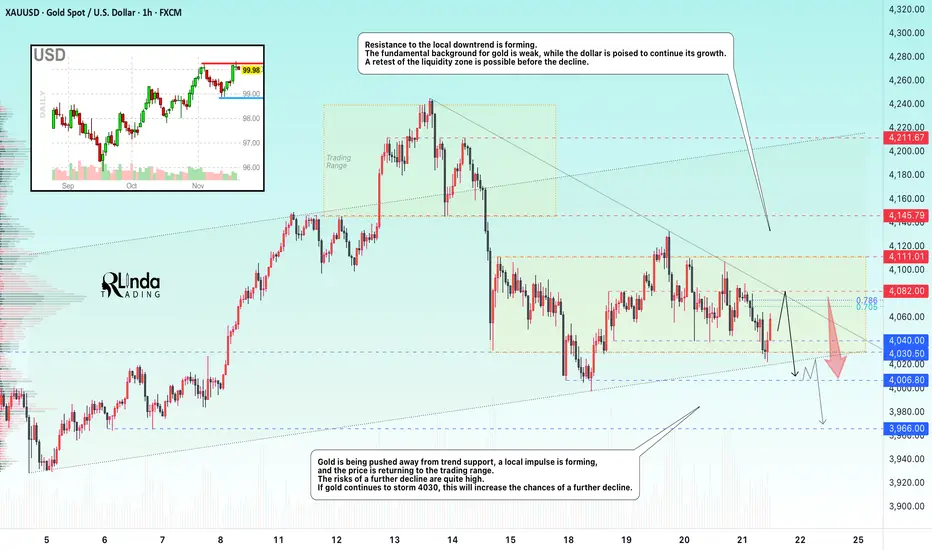
GOLD → Mixed data forms a symmetrical triangle FX:XAUUSD is bouncing off support at 4030, with bulls trying to maintain the current trend. The fundamental backdrop is currently weak for gold, which is why there are bears in the market. The PMI report is coming up...
Mixed US employment data (NFP growth to 119K, but unemployment rose to 4.4%) has created uncertainty. The probability of a Fed rate cut in December remains at 40%. Fed officials remain cautious, warning of the risks of premature easing.
Focus on the 4070-4082 area and local trend resistance...
Gold is awaiting new signals from PMI data. A breakout of the range is likely if there are significant deviations from forecasts (Manufacturing PMI: 52, Services PMI: 54.8)
Technically, a symmetrical triangle is forming on the chart, which could keep the market within its boundaries if the fundamental background remains unchanged. However, a breakout of either boundary could trigger a distribution in the direction of the break
Resistance levels: 4080, 4110
Support levels: 4040, 4030, 4006
In the medium term, gold currently looks weak. The reaction to support is weakening, a cascade of levels and a downward resistance line are forming. The market may test the 4080 area, but if the PMI is weak, gold will return to attack the trend support. However, a break above 4082 and a close above this zone could give us a chance for growth.
Best regards, R. Linda!
Gold Analysis: Buyers vs Sellers Near Critical LevelsHello traders! Let’s take a look at XAUUSD (Gold). XAUUSD is currently trading within a broad corrective structure, moving between a well-defined Resistance Level near $4,100 and a strong Support Level around $4,030. Throughout the recent sessions, Gold has repeatedly reacted to these two key zones, forming clear ranges and turnarounds visible on the chart. Earlier, price created a large Range Phase, followed by a sharp rejection from the upper boundary of the descending Resistance Line, confirming continued selling pressure from higher levels. The repeated “Turned Around” reactions along this trendline show that sellers remain active every time price approaches the upper trend boundary. After breaking below the Seller Zone around $4,100, Gold retraced into the lower structure and entered the Buyer Zone, which aligns with both horizontal support and the ascending Support Line of the current bullish correction. This confluence makes the $4,030–$4,050 region a major demand area. Recently, XAUUSD bounced strongly from the Support Line, but the recovery stalled at the Seller Zone, where price is now showing signs of rejection once again. This confirms the zone as a significant barrier for buyers. A rejection from this level may trigger another downward movement toward the Support Level around $4,030, where buyers previously stepped in aggressively. As long as Gold trades below the descending Resistance Line and the $4,100–$4,110 area, the market retains a bearish-to-neutral tone. Only a clean breakout above this zone would signal a shift toward a stronger bullish phase and open the path to higher resistance levels. As long as XAUUSD remains below the $4,100 Resistance Level, sellers retain the advantage. I expect price to potentially reject the Seller Zone and move back toward the $4,050–$4,030 Support Level. A rejection from resistance sends price down toward $4,030, where buyers may attempt another defense. Break below this level opens the door for deeper correction. Overall, the market currently favors selling pullbacks into resistance, while the Support Line remains the key area for defending bullish structure. Please share this idea with your friends and click Boost 🚀

DeGRAM | GOLD will rebound from the $4000 level📊 Technical Analysis
● GOLD/USD is rebounding from the 4,000–4,060 support area, which aligns with the rising trendline that has held multiple times since early November.
● Price is forming a higher-low structure and breaking above short-term compression, opening room toward 4,132 and potentially 4,200 if buyers sustain momentum.
💡 Fundamental Analysis
● Gold is supported by easing Treasury yields and renewed demand as markets price in softer U.S. inflation and increasing geopolitical hedging.
✨ Summary
Support: 4,000–4,060. Targets: 4,132 → 4,200. Medium-term bullish bias above trendline support.
-------------------
Share your opinion in the comments and support the idea with a like. Thanks for your support!
