Gold: silence on the charts—because the real money already movedThe gold market isn't reacting — it's confirming. The Israeli strikes on Iran? That’s the trigger. But the move started earlier. Price was already coiled, already positioned. All the market needed was a headline. And it got it.
Price broke out of the accumulation channel and cleared $3,400 — a key structural level that’s acted as a battleground in past rotations. The move from $3,314 was no fluke — it was a textbook build: sweep the lows, reclaim structure, flip the highs. Volume spiked exactly where it needed to — this wasn’t emotional buying. This was smart money pulling the pin.
Technicals are loaded:
— Holding above $3,396–3,398 (0.618 Fibo + demand re-entry zone)
— All major EMAs (including MA200) are now below price
— RSI strong, no sign of exhaustion
— Candles? Clean control bars — breakout, retest, drive
— Volume profile above price = air pocket — resistance is thin to nonexistent up to $3,450+
Targets:
— $3,447 — prior high
— $3,484 — 1.272 extension
— $3,530 — full 1.618 expansion — key upside target
Fundamentals:
Middle East is boiling. Iran is ready to retaliate. Israel is already escalating. In moments like these, gold isn't just a commodity — it's capital preservation. The dollar is rising — and gold still rallies. That means this isn’t about inflation, or rates. It’s about risk-off. Pure, institutional-level flight to safety.
Tactical view:
The breakout is done. Holding above $3,396 confirms the thesis. Pullbacks to that zone? Reloading points. While gold remains in the channel and momentum is clean, the only side that matters right now — is long.
When price moves before the news — that’s not reaction. That’s preparation. Stay sharp.
Gold

PAXUSDT 4H Levels week ending 6/13/25Paxos Gold (PAXG) is a crypto asset backed by real gold reserves held by Paxos, a for-profit company based in New York. Each PAXG token is redeemable for 1 troy fine ounce of gold custodied in vaults by Paxos and its partners, and its market value is meant to mirror the physical gold it represents.
I'm looking for PAX to make a move towards the previous day high at the least.

GOLD Sellers In Panic! BUY!
My dear friends,
My technical analysis for GOLD is below:
The market is trading on 3330.6 pivot level.
Bias - Bullish
Technical Indicators: Both Super Trend & Pivot HL indicate a highly probable Bullish continuation.
Target - 3338.3
Recommended Stop Loss - 3326.5
About Used Indicators:
A pivot point is a technical analysis indicator, or calculations, used to determine the overall trend of the market over different time frames.
Disclosure: I am part of Trade Nation's Influencer program and receive a monthly fee for using their TradingView charts in my analysis.
———————————
WISH YOU ALL LUCK

"XAU/USD Bearish Setup: Rising Channel Breakdown AnticipatedPrevious Resistance Zone (Red Rectangle):
The chart shows a clear resistance zone between ~3,340 and ~3,370 USD.
Price was rejected sharply from this zone earlier (marked by the large blue dot at the swing high).
Current Rising Channel (Blue Channel):
A rising wedge or ascending channel is forming, typically a bearish continuation pattern when found in a downtrend.
Price is currently testing the upper boundary of this pattern.
Bearish Projection (Red Path & Arrows):
The chart creator expects a rejection from the top of the channel, leading to a breakdown and a move toward the next key support at ~3,246.94 USD.
A large red arrow and projected box highlight the short setup zone with an implied favorable risk/reward ratio.
Support Target:
Blue horizontal line at 3,246.94 marks the next significant support level, likely a take-profit target for short sellers.
Macro Factors:
Three small icons indicate upcoming U.S. economic events, possibly influencing XAU/USD volatility and confirming the move.
✅ Summary:
Bias: Bearish
Pattern: Rising Channel (bearish structure)
Entry Zone: Around 3,350–3,360 USD (top of channel)
Target Zone: ~3,246 USD
Risk: Invalid if price closes strongly above the resistance zone (~3,370 USD)

Gold 1hr -Don't Know when is the next movement ? This for You🔥 Gold – 1h Scalping Analysis (Bearish Setup)
⚡️ Objective: Precision Breakout Execution
Time Frame: 1h- Warfare
Entry Mode: Only after verified breakout — no emotion, no gamble.
Your Ultimate key levels
👌Bullish After Break : 3392
Price must break liquidity with high volume to confirm the move.
👌Bullish After Break : 3415
Price must break liquidity with high volume to confirm the move.
👌Bullish After Break : 3435
Price must break liquidity with high volume to confirm the move.
👌Bearish After Break : 3375
Price must break liquidity with high volume to confirm the move.
👌Bearish After Break : 3325
Price must break liquidity with high volume to confirm the move.
☄️ Hanzo Protocol: Dual-Direction Entry Intel
➕ Zone Activated: Strategic liquidity layer detected — mapped through refined supply/demand mechanics. Volatility now rising. This isn’t noise — this is bait for the untrained. We're not them.
🩸 Momentum Signature Detected:
Displacement candle confirms directional intent — AI pattern scan active.
— If upward: Bullish momentum burst.
— If downward: Aggressive bearish rejection.
🦸♂️ Tactical Note:
The kill shot only comes after the trap is exposed and volume betrays their position.

GOLD: Strong Growth Ahead! Long!
My dear friends,
Today we will analyse GOLD together☺️
The price is near a wide key level
and the pair is approaching a significant decision level of 3,431.19 Therefore, a strong bullish reaction here could determine the next move up.We will watch for a confirmation candle, and then target the next key level of 3,422.53.Recommend Stop-loss is beyond the current level.
❤️Sending you lots of Love and Hugs❤️

Bull market continues? Beware of the possibility of a pullback📰 Impact of news:
1. The geopolitical situation between Israel and Iran deteriorates
📈 Market analysis:
In the short term, gold is expected to rise further. Relatively speaking, there is still room for further increase. If it continues to rise today, it depends on the test of 3440 points, which is the opening position of the previous decline. In the short term, pay attention to the 3340-3350 resistance. If it can break through and stay above it, the 3468-3493 line we gave in the morning can still be used as a reference, and it is even expected to reach 3500. But at the same time, the RSI indicator in the hourly chart is approaching the overbought area, so we still need to be vigilant about the possibility of a pullback.
🏅 Trading strategies:
SELL 3440-3450
TP 3430-3420
BUY 3415-3400
TP 3420-3440
If you agree with this view, or have a better idea, please leave a message in the comment area. I look forward to hearing different voices.
TVC:GOLD FXOPEN:XAUUSD FOREXCOM:XAUUSD FX:XAUUSD OANDA:XAUUSD

GOLD ROUTE MAP UPDATEHey Everyone,
Great finish after completing each of our targets throughout the week with ema5 lock confirmations on our proprietary Goldturn levels. Yesterday we finished off with 3388 and stated we would look for ema5 cross and lock above 3388 to open 3428 and failure to lock will follow with a rejection.
- This played out perfectly with the cross and lock confirmation and then the target hit at 3428 completing the range.
BULLISH TARGET
3318 - DONE
EMA5 CROSS AND LOCK ABOVE 3318 WILL OPEN THE FOLLOWING BULLISH TARGETS
3352 - DONE
EMA5 CROSS AND LOCK ABOVE 3352 WILL OPEN THE FOLLOWING BULLISH TARGET
3388 - DONE
EMA5 CROSS AND LOCK ABOVE 3388 WILL OPEN THE FOLLOWING BULLISH TARGET
3428 - DONE
We’ll be back now on Sunday with our multi-timeframe analysis and trading plans for the week ahead. Thanks again for all your likes, comments, and follows.
Wishing you all a fantastic weekend!!
Mr Gold
GoldViewFX

XAUUSD H4 Outlook – CHoCH Confirmed & Discount Pullback in Motio👋 Hey traders!
Here’s your fresh H4 XAUUSD Outlook for June 9, 2025 — real-time structure, sniper zones, and bias clarity, right where price is sitting. Let’s dive in 👇
📍 Bias: Bearish short-term → clean CHoCH & liquidity sweep, targeting discount retracement
🔹 1. 🔍 H4 Structure Summary
CHoCH (Lower) confirmed after recent LH at 3384.
Price failed to reclaim supply → now trading back below the 3350 level.
Multiple internal CHoCHs + bearish OB at 3368 showing clear short-term rejection.
Market is shifting from a bullish continuation into a retracement leg.
🔹 2. 🧭 Key H4 Structure Zones
Zone Type Price Range Structure Notes
🔼 Supply Zone (Flip Trap) 3360 – 3384 Clean CHoCH, FVG, + OB rejection area — major sell trigger
🔽 Mid-Demand Range 3272 – 3252 Retest OB + FVG cluster, ideal reaction zone for possible bounce
🔽 Deep Discount Zone 3174 – 3145 Last major accumulation + bullish origin block
🔹 3. 📐 Price Action Flow
Previous HH → LH → CHoCH confirms internal structure break.
Liquidity swept above LH at 3384, trapping late bulls.
Now targeting equilibrium zone around 3260–3280 as next H4 liquidity base.
🔹 4. 📊 EMA Alignment (5/21/50/100/200)
EMA5 and EMA21 are starting to cross down.
Price has lost momentum above EMA50 → retracement expected into EMA100/200 territory (sub-3280).
Full bullish EMA stack remains — but this is a controlled correction inside trend.
🔹 5. 🧠 RSI + Momentum View
RSI has dropped below 50 → bearish control short-term.
Momentum flow fading after multiple rejection wicks from premium zones.
📌 Scenarios
🔽 Retracement Flow in Progress
Price likely heading to 3272–3252 demand block for reaction
If this zone fails → we open door to 3174–3145 clean swing zone
🔼 Invalidation
Bullish pressure only regains control on break + hold above 3384
Until then: favor selling the supply + letting price reach discount
✅ GoldFxMinds Final Note
We’ve officially shifted into retracement mode on H4. The game now is to either:
Sell retests into supply, or
Wait for clean confirmations at demand for new longs
Let price come to your zone. No emotion — just structure.
💬 Drop your chart view below or ask if you’re unsure where to position next.
Locked in for next move,
— GoldFxMinds 💡

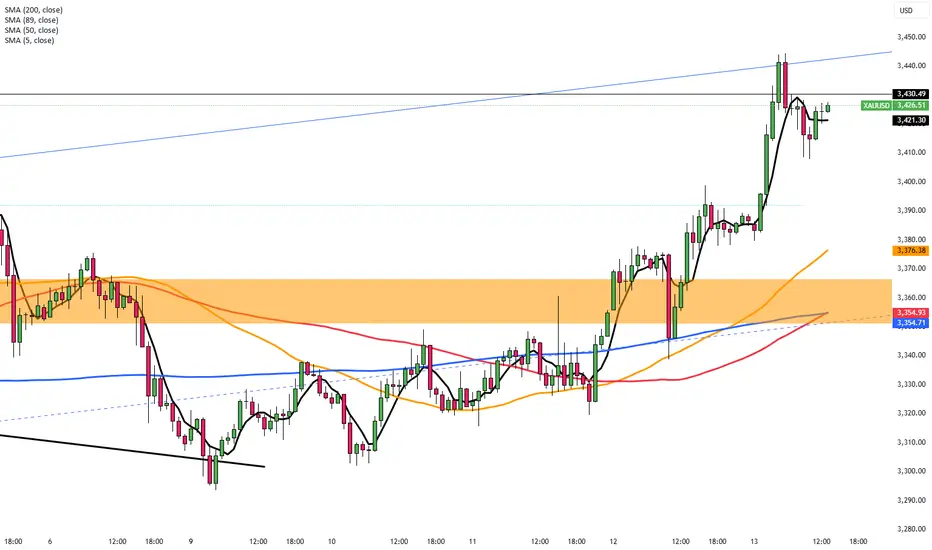
Analysis of the latest gold trend on June 13:
Gold multi-period resonance analysis
1. Daily level - trend strengthening stage
Structural breakthrough: The price effectively stood above the 3350 neckline (the upper edge of the previous oscillation range), and the daily closing was "engulfing the positive line", confirming the bullish dominance.
Moving average system: 5/10/20-day moving averages are arranged in a bullish pattern, MACD double lines diverge upward from the zero axis, and RSI (14) remains above 60 without overbought.
Key pressure: 3390-3400 area (weekly Fibonacci 78.6% retracement level).
2. 4-hour level - momentum verification
Wave structure: The 3320 low point can be regarded as the end of wave C, and the current running is sub-wave 3 of driving wave 3, with a theoretical target of 3415 (1.618 extension level).
Volume and price coordination: The rise is accompanied by an increase in trading volume, while the Asian session pullback is reduced, indicating that the selling pressure is limited.
3. 1-hour level - short-term trading anchor point
Time-sharing support:
Strong defensive position 3356 (starting point of Asian morning session + Bollinger middle rail)
Bull lifeline 3348 (previous high conversion support + V-shaped retracement 61.8% position)
Intraday channel: Currently running along the rising channel (lower rail 3355/upper rail 3395)
Today's three-dimensional trading strategy
▶ Main long plan
Best entry area: 3362-3355 (4-hour EMA10 and channel lower rail overlap area)
Position allocation: 50% main position, stop loss 3345 (stop loss moves up after breaking through the previous high)
Target 1: 3385 (equal amplitude measurement after breaking through the Asian session high)
Target 2: 3400 (reduce position by 50% in the daily pressure zone)
Target 3: 3415 (clear position at the wave theory target position)
▶ Auxiliary short opportunities
Counter-trend conditions: first touch 3408 and appear:
1-hour chart pregnancy line/evening star
MACD top divergence + shrinking trading volume
Operation: light position short (position ≤ 20%), stop loss 3418, target 3380
▶ Breakthrough chasing order strategy
Break above 3402: fall back to 3392 to chase long, stop loss 3385, target 3425
Break below 3348: rise and rebound to 3352 to short, stop loss 3360, target 3330
Dollar Week Review and thoughtsMy General thoughts on dollar and keeping my bearish bias going forward into next week.
Still bullish silver gold cable fibre and looking to see what happens with aussie to get in again
Have a good weekend!!

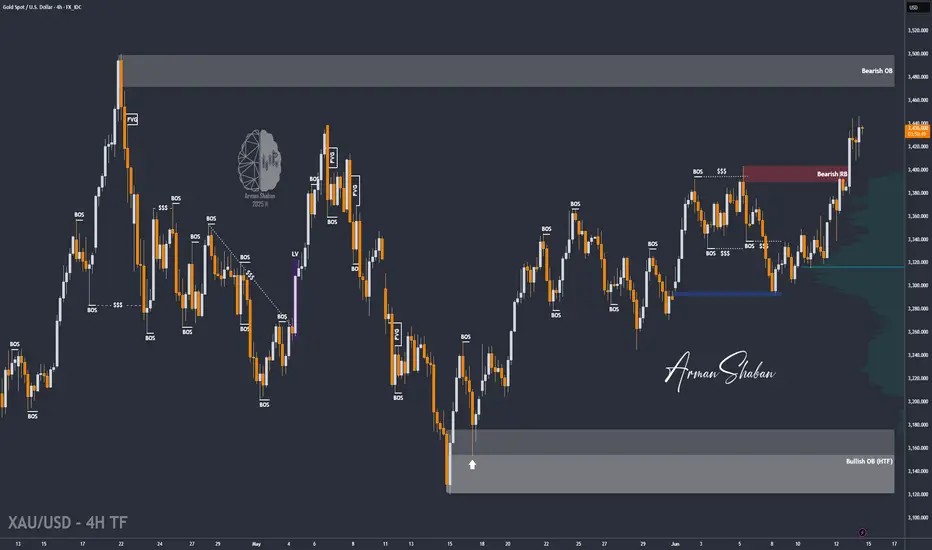
Gold Breaks $3400 – Targets $3500 Amid Tensions (READ)By analyzing the gold chart on the lower timeframe, we can see that today, following Israel's missile and airstrike attacks on Iran, gold experienced a sharp rally. As anticipated last night, gold finally managed to break through the strong $3400 resistance, surging over 600 pips to reach $3447.
Currently, gold is trading around $3438, and given the escalation in geopolitical tensions, I expect further upside movement.
The next potential targets are $3449, $3469, and possibly $3500.
⚠️ Due to ongoing conflict and extreme volatility, it's advised to avoid trading or proceed only with minimal risk exposure.
Please support me with your likes and comments to motivate me to share more analysis with you and share your opinion about the possible trend of this chart with me !
Best Regards , Arman Shaban
Gold will grow a little more and then make correctionHello traders, I want share with you my opinion about Gold. After forming a downward wedge and several rejections near the support line, the price eventually broke out to the upside, signaling a reversal. This breakout was followed by a strong upward impulse, and Gold quickly shifted into a consolidation phase, creating a wide sideways range structure. Inside this range, we observed multiple rebounds from the lower boundary and a gradual rise toward the resistance level. Recently, the price exited the range upward after testing the buyer zone and breaking above the support area. However, this breakout seems impulsive and may need a correction. Currently, Gold trades slightly above the 3400 level, which aligns with the support area and the previous range border. In my view, the price may make a short upward move, followed by a return to the current support level. That’s why I set my TP at 3400 points, which corresponds to the support area and acts as a potential bounce zone in case of a retracement. Please share this idea with your friends and click Boost 🚀
Disclaimer: As part of ThinkMarkets’ Influencer Program, I am sponsored to share and publish their charts in my analysis.

GOLD poised for breakout GLD & /gcAfter going on a huge run to 317 we have spent a significant time now basing out and consolidating we’ve come down into that 300 range and tested and built up quite a bit of support
With the Iranian intentions we could kickstart the next move in gold 317 is the breakout. I am looking to play this breakout on an intra day pull back with some calls one month out for a swing Trey looking at the 320 or 325 strike price

GOLD - Price can correct to support level and then bounce upHi guys, this is my overview for XAUUSD, feel free to check it and write your feedback in comments👊
Gold entered a Rising Channel structure, demonstrating stable growth with higher highs and higher lows.
After testing and breaking through the $3265 support level, the price pulled back slightly and then resumed its upward momentum.
This move confirmed buyer strength and renewed interest in the mid-channel zone.
Recently, Gold successfully retested the $3365–$3375 support area, turning it into a local springboard.
Now price is gaining traction above this zone and appears to be preparing for a continuation of the current trend.
I expect it to rise toward the $3450 target — the upper resistance of the channel.
If this post is useful to you, you can support me with like/boost and advice in comments❤️
Disclaimer: As part of ThinkMarkets’ Influencer Program, I am sponsored to share and publish their charts in my analysis.

As conflict escalates, gold is cautiously long📰 Impact of news:
1. The geopolitical situation between Israel and Iran deteriorates
📈 Market analysis:
The worsening geopolitical situation caused a surge in gold prices. The intraday short-term support points of 3420, 3402, and 3380 will all become key support for testing bulls. If the European session is strong, 3420 cannot be lost. If it falls back and loses, it will move closer to the top and bottom conversion position of 3402. If you go long later, you must pay attention to the weakening of the upward momentum. If the European session continues to break the high of 3440, then the US session can be seen around 3468-3493. If the upward momentum in the European session weakens, we need to watch out for a short-selling counterattack and a sharp decline. The geopolitical situation is unstable. Bros must strictly control SL when trading independently.
🏅 Trading strategies:
BUY 3420-3402-3380
TP 3390-3400-3420-3460-3490
If you agree with this view, or have a better idea, please leave a message in the comment area. I look forward to hearing different voices.
OANDA:XAUUSD FX:XAUUSD FOREXCOM:XAUUSD FXOPEN:XAUUSD TVC:GOLD

SPY/QQQ Plan Your Trade For 6-13 : Harami-Inside PatternToday's pattern suggests the markets may stall into a sideways price range.
After the news of Israel targeting Iran in a preemptive strike late yesterday afternoon, the markets moved dramatically lower while Gold & Silver moved higher on the news.
I, personally, see this market trend as a shift in thinking ahead of a long Father's Day weekend.
I see traders trying to position their accounts/trades for uncertainty.
I believe we could see a bit of a shift today - particularly in Metals and the QQQ/NASDAQ/BTCUSD.
Overall, I strongly suggest traders prepare for extreme volatility this weekend as any further news of a counter-strike or further military action in the Middle East could roil the markets.
Happy Friday the 13th - everyone.
Going to be an interesting day to say the least.
Get some.
#trading #research #investing #tradingalgos #tradingsignals #cycles #fibonacci #elliotwave #modelingsystems #stocks #bitcoin #btcusd #cryptos #spy #gold #nq #investing #trading #spytrading #spymarket #tradingmarket #stockmarket #silver

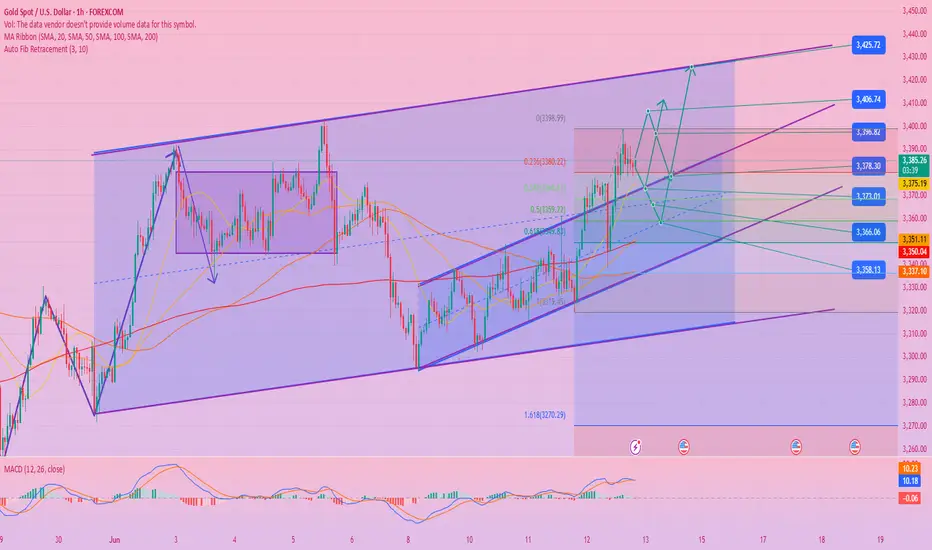
Gold/XAUUSD Possible Move 13 June 2025 The market continues to exhibit strong bullish momentum within a well-respected ascending channel. After an impulsive breakout to the upside, price is now retracing in a healthy corrective move, offering high-probability buying opportunities at two well-defined demand zones.
🔍 Technical Structure:
Price is trending inside an ascending parallel channel, with clear respect for both the median and outer trendlines.
A significant bullish impulse pushed price above previous local highs, suggesting institutional interest and continuation potential.
Currently, price is retracing and approaching two key demand areas that align with bullish continuation setups.
🎯 Key Buy Zones:
✅ Zone 1: 3,408 – 3,412
Minor mitigating demand zone, likely to act as support if the market retraces slightly.
Ideal for aggressive long entries if price shows confirmation (e.g., bullish engulfing, LTF structure shift).
✅ Zone 2: 3,380 – 3,385
Deeper unmitigated demand zone, aligned with a potential liquidity sweep and strong institutional support.
Considered a high-probability entry area for larger impulse moves.
🌍 Fundamental Context:
Recent geopolitical tensions in the Middle East, can lead to sharp intraday moves, with 100+ pip 5-minute candles not being out of the question.
Given this backdrop, demand zones become critical areas for smart money entries as traders seek to align technical levels with macro drivers.
📈 Trade Signal:
Bias: 🔵 Bullish
Buy Zone 1: 3,408 – 3,412
SL: Below 3,395
TP: 3425, 3440, trail till 3,470
R:R: ~1:3
Buy Zone 2: 3,380 – 3,385
SL: Below 3,368
R:R: ~1:4
🧠 Final Note:
Watch for price reaction at both zones. Use LTF confirmation before entry and respect your risk management. With news-driven volatility in play, quick movements are expected, offering excellent trade opportunities for prepared traders.
GOLD (XAUUSD): Waiting For Another Breakout
Following the latest news, I think you would agree with me that
Gold will most likely rise more.
Your technical confirmation can be a bullish breakout of the underlined
blue resistance and a daily candle close above 3435.
It will be an important trigger that will push the prices way up to a current ATH.
❤️Please, support my work with like, thank you!❤️
I am part of Trade Nation's Influencer program and receive a monthly fee for using their TradingView charts in my analysis.

Gold Flight to Safety 1. Flight to Safety Supports Gold
Ongoing geopolitical risks — whether from Middle East tensions, rising friction in Asia, or persistent uncertainty in Eastern Europe — are keeping investors on edge. In times of heightened risk aversion, gold remains a go-to asset for capital preservation. This "flight to safety" theme has been a key pillar of support for gold's upward move.
2. Trade Concerns Back in Focus
Renewed trade-related concerns, particularly around U.S.-China relations and global tariff discussions, have reignited fears of supply chain disruptions and global economic slowdown. These macro uncertainties further enhance gold’s appeal as a hedge against economic instability.
3. Fed Rate Cut Bets Offer Tailwind
Market expectations are increasingly pricing in Federal Reserve rate cuts, possibly starting later this year. Lower interest rates reduce the opportunity cost of holding non-yielding assets like gold, making it more attractive to investors. The dovish tilt in Fed expectations is thus providing an underlying bid for gold.
4. Rebounding US Dollar Caps Further Upside
While fundamental drivers remain supportive, a recent rebound in the US Dollar Index (DXY) is limiting gold’s upside momentum. Since gold is priced in dollars, a stronger USD tends to weigh on demand from foreign buyers, acting as a natural headwind for further gains in XAU/USD.
Trading Implications:
Bullish bias remains intact as long as geopolitical and economic uncertainty persist and Fed rate cut expectations stay on the table.
Watch for key resistance near recent highs; potential profit-taking may emerge if USD strength accelerates.
Near-term support zones include previous consolidation levels and moving averages on the 4H and daily charts.
Important to monitor US economic data and Fed commentary — any shift in rate outlook could cause sharp gold repricing.
Key Support and Resistance Levels
Resistance Level 1: 3444
Resistance Level 2: 3460
Resistance Level 3: 3483
Support Level 1: 3377
Support Level 2: 3360
Support Level 3: 3340
This communication is for informational purposes only and should not be viewed as any form of recommendation as to a particular course of action or as investment advice. It is not intended as an offer or solicitation for the purchase or sale of any financial instrument or as an official confirmation of any transaction. Opinions, estimates and assumptions expressed herein are made as of the date of this communication and are subject to change without notice. This communication has been prepared based upon information, including market prices, data and other information, believed to be reliable; however, Trade Nation does not warrant its completeness or accuracy. All market prices and market data contained in or attached to this communication are indicative and subject to change without notice.

Gold Surges Amid Middle East TensionsGold surged more than 1% to exceed $3,440, approaching record levels amid a sharp rise in safe-haven demand. The gains came after Israel's strike on Iran’s nuclear facilities, fueling concerns over a wider regional conflict. Uncertainty surrounding potential US tariffs added to market jitters. Additionally, softer US inflation data increased expectations for Federal Reserve rate cuts, enhancing gold's appeal as a non-yielding asset.
Resistance is seen at $3,430, while support holds at $3,350.
GOLD Will Move Higher! Long!
Please, check our technical outlook for GOLD.
Time Frame: 2h
Current Trend: Bullish
Sentiment: Oversold (based on 7-period RSI)
Forecast: Bullish
The market is approaching a key horizontal level 3,423.03.
Considering the today's price action, probabilities will be high to see a movement to 3,467.03.
P.S
Please, note that an oversold/overbought condition can last for a long time, and therefore being oversold/overbought doesn't mean a price rally will come soon, or at all.
Disclosure: I am part of Trade Nation's Influencer program and receive a monthly fee for using their TradingView charts in my analysis.
Like and subscribe and comment my ideas if you enjoy them!

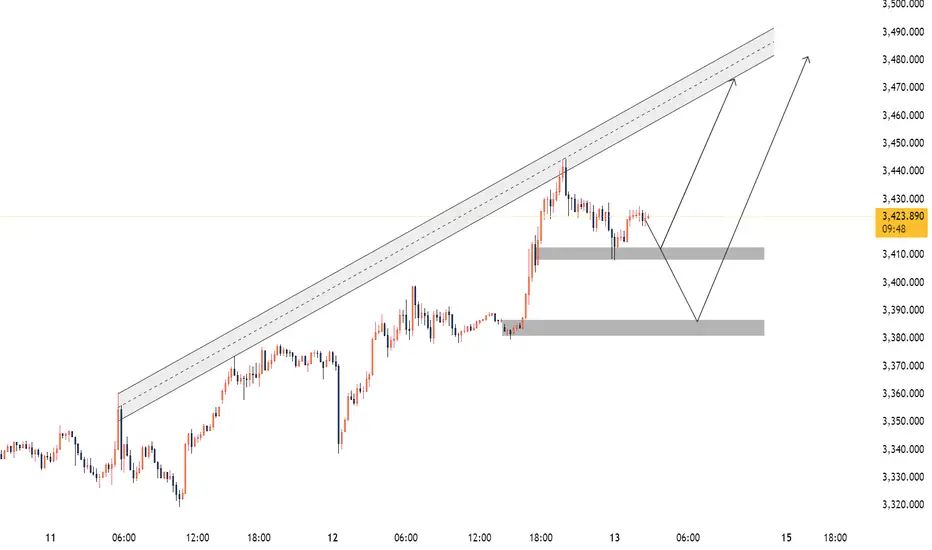
GOLD PATH TO 3500We see a visible path to 3500 on the xauusd market.
After the breakout at 3400 which extended to 3440's clearing a solid supply zone, gold then had a retracement and rallied back to 3420's which has a solid outlook on the 4hour time frame.
Do not forget that today is friday so dont push the moves .
.......Further breakdown on the lower timeframe
