The bullish trend remains unchanged; we remain bullish on gold.#XAUUSD OANDA:XAUUSD TVC:GOLD
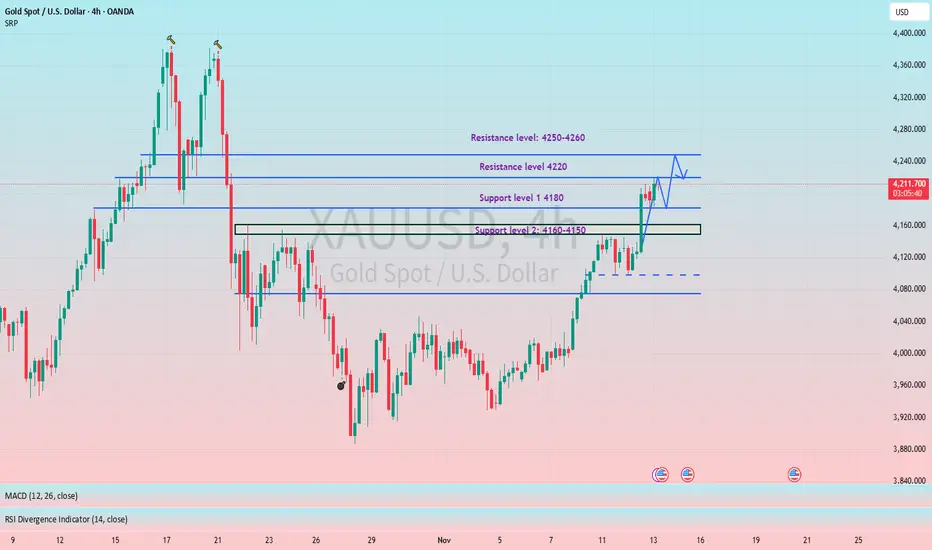
The daily chart is above the MA5 moving average, indicating that the bullish trend remains unchanged. However, we do not chase the price at high levels. Our core strategy is to wait for a pullback to support before going long. From the hourly chart, gold is fluctuating within the 4220-4180 range in the short term. If gold retraces to the short-term support of 4190-4180 during the European session, it is advisable to continue to go long on gold, with key support at 4160-4150. If the price rebounds to the previous high of 4250-4260, then yesterday's strategy remains valid.
Gold
GOLD break all time high!GOLD is back on the rise. Lets's see if after news it will continue rising and a potential all time high.

Hellena | GOLD (4H): LONG to resistance area 4219.Colleagues, I am not abandoning the idea that the upward movement is not over yet.
It seems that the correction in wave “4” is very long and I think that it may continue to the support area 3807 and there is an important nuance - it is quite difficult to label all this movement as wave “C”, because it contradicts some rules of wave construction, but there are exceptions and I tend to interpret the downward movement in this way.
There is one more option, which does not contradict the rules and it is a “shortened wave ”5" at 4377, and then (ABC) looks more adequate, but I will not display this option. In both cases, I expect a resumption of the move to at least the 4219 area.
Fundamental context
Against the current macro backdrop, gold remains well-supported: the U.S. dollar is under pressure, and bond yields continue to decline after recent weaker economic data. This environment sustains demand for safe-haven assets.
Short-term pullbacks and profit-taking after record highs appear natural — overall interest in gold stays strong, particularly amid expectations of further Fed policy easing.
Manage your capital correctly and competently! Only enter trades based on reliable patterns!

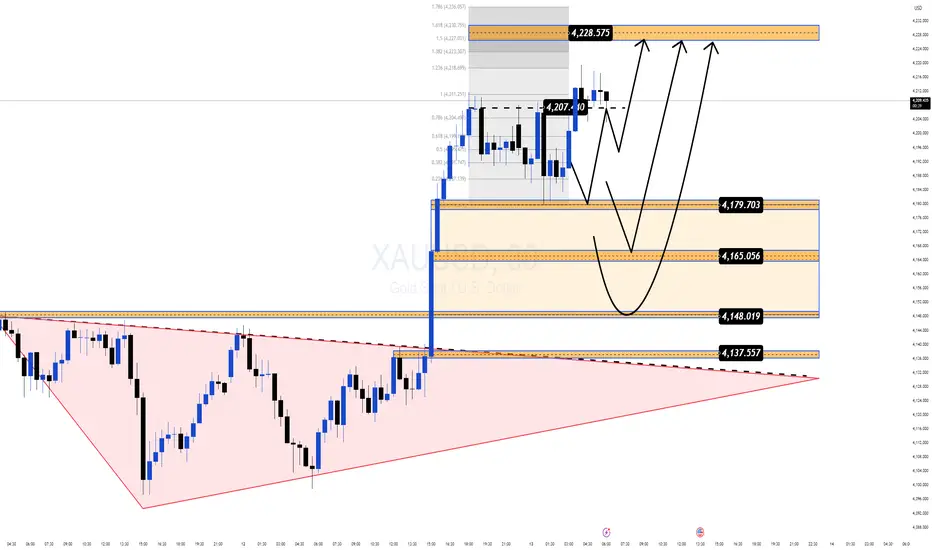
Gold Hits a 3 Week High but the Real Move Might Still Be LoadingGold just tapped $4,213 — the highest level in three weeks, powered by growing expectations of a dovish Fed and optimism around the potential reopening of the US government.
But the real story isn’t the headline spike — it’s the structure forming right beneath it.
📌 Why this zone matters right now
Price is pulling back into $4,179–$4,165, a clean Demand zone aligning with Fibo + breakout structure.
Buyers remain firmly in control despite a mild USD recovery.
The market swept liquidity around $4,207, hinting at accumulation before the next expansion.
The broader pattern resembles a falling-wedge breakout, often appearing before strong upside continuation phases.
🎯 Most Probable Scenario (Mind Insight)
Gold is in a “compression before expansion” phase.
Once this squeeze resolves, momentum is likely to continue in the direction that’s already dominant — and right now, that’s the bulls.
🔶 MMF BUY Zone
$4,179 → $4,165
Looking for a shallow pullback before the next leg.
🔼 Bullish Targets
• $4,207 (liquidity tap)
• $4,228 (Fibo 1.618)
• $4,236 (Fibo 1.786 — major reaction zone)
🧠 Key Takeaway
As long as Gold holds above $4,165, the bullish structure remains intact and the upside expansion toward the upper Fibo cluster stays in play.
Stop!Loss|Market View: USDCHF🙌 Stop!Loss team welcomes you❗️
In this post, we're going to talk about the near-term outlook for the USDCHF currency pair☝️
Potential trade setup:
🔔Entry level: 0.79540
💰TP: 0.81119
⛔️SL: 0.79070
"Market View" - a brief analysis of trading instruments, covering the most important aspects of the FOREX market.
👇 In the comments 👇 you can type the trading instrument you'd like to analyze, and we'll talk about it in our next posts.
💬 Description: The franc, like most major currency pairs, is looked for a potential buy against the USD. However, its movements in favor of the USD are likely to be more modest than, for example, AUDUSD, NZDUSD, or USDCAD. Nevertheless, there is still buy priority for this pair, and based on current prices, potential long positions can be considered with a target of 0.81120. As an alternative scenario, it's better to look for possible long positions near the support level at 0.78870, but only if an entry point forms (for example, a false breakout).
Thanks for your support 🚀
Profits for all ✅
❗️ Updates on this idea can be found below 👇

Stop!Loss|Market View: USDCAD🙌 Stop!Loss team welcomes you❗️
In this post, we're going to talk about the near-term outlook for the USDCAD currency pair☝️
Potential trade setup:
🔔Entry level: 1.39721
💰TP: 1.41321
⛔️SL: 1.39021
"Market View" - a brief analysis of trading instruments, covering the most important aspects of the FOREX market.
👇 In the comments 👇 you can type the trading instrument you'd like to analyze, and we'll talk about it in our next posts.
💬 Description: Strengthening of the USD is expected in the near future, as noted in previous reviews. Against this backdrop, the Canadian dollar could demonstrate one of the most effective moves in favor of the USD. The buying zone is currently located in the range of 1.39400 - 1.40010. The most likely scenario is an upward reversal from this area with a target of resistance at 1.41400.
Thanks for your support 🚀
Profits for all ✅
❗️ Updates on this idea can be found below 👇

XAU/USD – Key Levels Ahead of U.S. Data🌐 MARKET CONTEXT
Gold is trading in a pivotal moment as safe-haven demand remains elevated while the Federal Reserve’s future policy path becomes less certain. The recent report noted that gold prices reached over $4,213/oz on November 13, 2025.
Trading Economics
Meanwhile, broader macro commentary highlights that escalating global uncertainty is sustaining gold’s safe-haven appeal.
World Bank Blogs
Sentiment currently:
Risk-on for gold when geopolitical/fiscal concerns intensify or real yields fall.
Risk-off for gold if the USD strengthens or the Fed signals fewer rate cuts than expected.
For the upcoming London → New York sessions: expect heightened sensitivity to U.S. inflation/job data and strong reactions near structural zones. The bias today remains conditionally bullish, but we must remain alert for bearish reversal if price fails at key supply zones.
📉 TECHNICAL ANALYSIS (SMC + Liquidity Structure)
The price is showing signs of consolidation near major structural zones — this suggests a build-up of liquidity rather than a clean breakout.
Key structure to watch:
If support zones hold and we see a Change of Character (CHoCH) (i.e., lower-low becomes higher‐low) → bullish continuation.
If price reaches a major supply zone and shows a sweep or fake breakout then rejection → potential Break of Structure (BOS) to the downside.
Liquidity zones:
Demand clusters around the 4,081–4,083 and deeper around 3,990–3,988 represent potential absorption/accumulation areas.
Supply is concentrated near 4,080–4,078 (and the newly defined higher sell zone) — watch for liquidity hunt above and returning drop.
Confirmation cues: look for wicked candles, liquidity sweeps, mitigation bars, or M5/M15 structure break before entry.
🔑 KEY PRICE ZONES
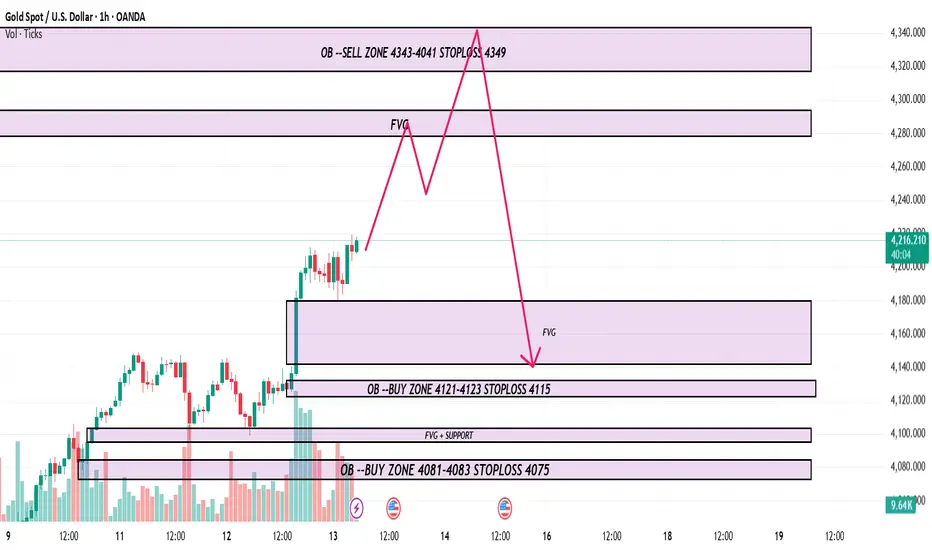
4,343 – 4,041 ▶️ Sell Zone – High-range supply cluster where short-bias may apply.
4,121 – 4,123 ▶️ Buy Zone – Structural demand zone for medium-term long setups.
4,081 – 4,083 ▶️ Buy Zone – Intraday demand / reversal potential.
3,990 – 3,988 ▶️ Buy Zone (deep support) – High reward if touched with confirmation.
Stop-loss levels:
Sell stop-loss: 4,349
Buy stop-loss (4,121 zone): 4,115
Buy stop-loss (4,081 zone): 4,075
Buy stop-loss (3,990 zone): 3,982
⚙️ TRADE SETUPS
✅ BUY SCENARIO 1 – STRUCTURAL DEMAND (MID)
Entry: 4,121 – 4,123
Stop-loss: 4,115
TP1: ~4,150 TP2: ~4,190 TP3: Open
Logic: Price returns to demand zone → confirmation required (sweep + rejection) → structural long.
✅ BUY SCENARIO 2 – INTRADAY REACTION DEMAND
Entry: 4,081 – 4,083
Stop-loss: 4,075
TP1: ~4,105 TP2: ~4,140 TP3: Open
Logic: Pull-back into middle zone -> quick reaction long for London session.
⚠️ SELL SCENARIO – SUPPLY REJECTION
Entry: 4,343 – 4,041
Stop-loss: 4,349
TP1: ~4,000 TP2: ~3,950 TP3: ~3,900
Logic: Price into upper supply zone → watch for rejection pattern or liquidity sweep above → short trigger.
🧠 NOTES / SESSION PLAN
Focus on buy setups in London session from 4,081 zone and deeper 3,990 zone.
Shift to sell setup if price moves into 4,343–4,041 and shows rejection during New York session.
Avoid entering immediately before major U.S. economic releases; look for confirmation (M5/M15) after news.
Risk-management: each trade max ~2% account risk; adjust size accordingly. Trail stop once TP1 achieved.
Expect choppy price action and fake moves; patience and structure confirmation are key.
🏁 CONCLUSION
Today’s plan: Bias leans bullish conditionally, with multiple buy zones at 4,121–4,123, 4,081–4,083, and 3,990–3,988 offering structured opportunities. However, a strong sell trigger remains valid at the supply zone 4,343–4,041, if rejection occurs. Trade should be guided by confirmation, strict risk control, and alignment with SMC structure.
Stop!Loss|Market View: SILVER🙌 Stop!Loss team welcomes you❗️
In this post, we're going to talk about the near-term outlook for SILVER ☝️
Potential trade setup:
🔔Entry level: 50.07771
💰TP: 45.90144
⛔️SL: 51.62853
"Market View" - a brief analysis of trading instruments, covering the most important aspects of the FOREX market.
👇 In the comments 👇 you can type the trading instrument you'd like to analyze, and we'll talk about it in our next posts.
💬 Description: As noted earlier regarding gold, despite the aggressive short-term strengthening of metals, medium- and long-term selling pressure remains. Both gold and silver are trading near key resistance levels, indicating a potential reversal. A further approach to 52 is not ruled out for silver, so shorter-term selling is looked for if the price approaches 50, and it's best to wait for the price to close below 50.
Thanks for your support 🚀
Profits for all ✅
❗️ Updates on this idea can be found below 👇

Moon Boys don't want you to see this Bitcoin/Gold chart !Hi Guys,
We have a massive head & shoulders on the Bitcoin / Gold chart that almost nobody talks about! With all the major players being openly bullish on Bitcoin and while everyone is waiting for the AI bubble to burst ..Bitcoin will be the first one to react considering how easy it can be sold and how volatile it usually is.
The charts don't lie and all markets are clearly at the top so protect you capital at all cost while you still can.
Let me know what do you guys think about this.

What's the point of buying now ?Gold is overbought at levels which is basically not seen in modern history. Being long right now makes no sense. I'm personally short.
Disclaimer: I've been a gold bug all these years

GOLD: Look For Bullish Breakout From The +FVGIn this Weekly Market Forecast, we will analyze the Gold (XAUUSD) for the week of Nov. 10-14th.
Gold has been consolidating in a +FVG since last week... and it is still holding! Wait for price to break the high of the consolidation and then look for long setups.
Be mindful that price may sweep the sell side LQ before it moves higher.
Enjoy!
May profits be upon you.
Leave any questions or comments in the comment section.
I appreciate any feedback from my viewers!
Like and/or subscribe if you want more accurate analysis.
Thank you so much!
Disclaimer:
I do not provide personal investment advice and I am not a qualified licensed investment advisor.
All information found here, including any ideas, opinions, views, predictions, forecasts, commentaries, suggestions, expressed or implied herein, are for informational, entertainment or educational purposes only and should not be construed as personal investment advice. While the information provided is believed to be accurate, it may include errors or inaccuracies.
I will not and cannot be held liable for any actions you take as a result of anything you read here.
Conduct your own due diligence, or consult a licensed financial advisor or broker before making any and all investment decisions. Any investments, trades, speculations, or decisions made on the basis of any information found on this channel, expressed or implied herein, are committed at your own risk, financial or otherwise.

Gold Testing H4 Supply – Eyes on Retrace SetupAfter a clean bullish expansion last week, Gold is now testing a 4H bearish FVG around 4,200–4,240. Price is currently holding below the day’s open (4,203), suggesting potential short-term weakness.
If we stay below 4,203, I’ll look for a corrective move toward the 4H bullish FVG just below the previous day’s low (around 4,060–4,090).
Above 4,220, the bullish continuation remains valid.
Currently in observation mode — waiting for intraday confirmation before engaging any short bias.

Gold (XAUUSD): Possible buy setupGold (XAUUSD): Possible buy setup. Wait for a candle close to buy.
Cheers

GOLD H1 – Awaiting CPI Data for Next Big Move🟡 XAUUSD – Intraday Smart Money Plan | by Ryan_TitanTrader (12/11)
📈 Market Context
Gold remains in a controlled retracement phase after a strong impulsive leg last week. The market is now consolidating within a defined 1H range, showing clear reactions near short-term EMAs as traders await today’s U.S. CPI release, a key driver of intraday volatility.
• A higher-than-expected CPI could reignite USD strength and push gold toward the discount zone.
• A softer CPI print may trigger a renewed push into the premium zone, inviting liquidity grabs above 4200.
Institutional flows remain balanced between short-term profit-taking and position building ahead of the inflation print, suggesting engineered liquidity sweeps before the real move unfolds.
🔎 Technical Analysis (1H / SMC Style)
• Structure: Market structure is still bullish but showing distribution signs at the top of the range.
• Premium Zone: 4201–4199 aligns with unmitigated supply — a prime area for potential sell-side reaction if CPI sparks a bullish liquidity sweep.
• Discount Zone: 4083–4081 overlaps with the 0.618 Fibonacci retracement and sits just above EMA100 — an ideal re-accumulation area for institutional buys.
• Liquidity: Equal lows near 4080 and equal highs near 4200 make both sides vulnerable to engineered stop-hunts before direction is confirmed.
🔴 Sell Setup (Premium Reaction Zone)
• Entry: 4,201 – 4,199
• Stop-Loss: 4,210
• Take-Profit Targets:
→ 4,140 (first liquidity pocket)
→ 4,102 (mid-range equilibrium)
→ 4,083 (discount zone confluence)
📌 Only valid if CPI causes a liquidity sweep into premium, followed by M5–M15 bearish BOS confirmation.
🟢 Buy Setup (Discount Reaction Zone)
• Entry: 4,081 – 4,083
• Stop-Loss: 4,074
• Take-Profit Targets:
→ 4,102
→ 4,140
→ 4,199
📌 Only valid if price sweeps 4080 liquidity and reclaims structure with bullish BOS on M15 timeframe.
⚠️ Risk Management Notes
• Wait for CPI-induced volatility before executing any setup.
• Avoid mid-range trades between 4100–4140 — this is equilibrium noise.
• Reduce size pre-news; volatility spikes can trigger premature stops.
• Scale partials at each liquidity pocket and trail stop-losses accordingly.
✅ Summary
Gold is consolidating ahead of CPI, with dual liquidity zones clearly defined:
• Sell zone: 4201–4199 (premium reaction area)
• Buy zone: 4083–4081 (discount re-entry area)
The market is likely to hunt one side of liquidity before revealing true intent. Traders should remain patient, trade from extremes, and align entries with confirmed structure shifts.
FOLLOW @Ryan_TitanTrader for real-time SMC updates ⚡

Gold continuation patternHere's exactly my idea, confirm it before you enter a trade! daily and 3H timeframe gaps. recommended to hit that gap only before it retraces back to 3600-3700 or above zone again.
Wait for that entry buy zone again. Or if you want to short this idea. look on 3H swept.
Chart is on daily. we might see 4180-4200, that's my short zone!
If you're having a good thoughts comment yours. this is a free community. Been dealing this moves. It's my base fibonacci level 1.61 above/retrace! before the price continues higher.
Follow for more. Watch only my zones entry buy/sell , Long/short! choose wisely.
To invest in my idea direct/private me here! with 70-30 split profit!

GOLD → Consolidation above 4100...FX:XAUUSD consolidates above $4,100 ahead of a key vote in the US House of Representatives on reopening the government. The rise is supported by weak employment data and expectations of Fed policy easing...
Key factors: Losses of more than 11,000 jobs per week until the end of October have heightened concerns about the labor market. The probability of a Fed rate cut in December has risen to 68%. Lower government bond yields and a weaker dollar have supported gold.
The resumption of data publication after the shutdown may change market sentiment (it is important to monitor actual data).
Gold retains its upside potential, but a short-term correction is possible. The outcome of the vote in Congress will determine the immediate dynamics.
Resistance levels: 4148, 4161
Support levels: 4097, 4075, 4046
If the bulls keep gold above 4100-4120, then in the short term, the market will be able to test resistance for a breakout. However, as a primary retest, I expect a rebound before the breakout and growth, provided that the fundamental background remains unchanged and continues to support the market...
Best regards, R. Linda!

GOLD volatility, monetary policy and political riskThe global OANDA:XAUUSD went through a volatile trading session on Tuesday, as prices fell more than $50 in the North American session before recovering around $30, ending the day in the green. As of Wednesday morning, November 12, spot gold stood at around $4,128/ounce, up around $2 on the day.
The main drivers of this development came from two opposing factors: the prospect of the Federal Reserve (Fed) possibly cutting interest rates in December, and capital withdrawals from gold ETFs after a long rally.
Policy pressures and labor market signals
U.S. private payrolls data, according to preliminary estimates from ADP Research, showed a weekly average of 11,250 job cuts in the four weeks ended October 25. The weaker-than-expected figure sent the dollar to a low of 99.29, giving gold a chance to rebound.
The move comes just as Washington is about to end its longest government shutdown in history, which has stalled the release of economic data. Investors are hoping the reopening of the government will quickly bring a wave of pent-up data that will help better determine the true state of the U.S. economy.
“As the government reopens, we’re going to start seeing more cracks in the economy,” said Marc Chandler, chief strategist at Bannockburn Global Forex. This expectation reinforces the belief that the Fed will begin its easing cycle in December. According to the CME FedWatch tool, the probability of a rate cut has risen to 64%, while Fed Governor Milan hinted at the possibility of a 50 basis point cut due to a weak labor market and slowing inflation.
ETF Profit Taking, Gold Temporarily Adjusts
However, gold’s rally was capped by profit-taking in the ETF market. Bloomberg data shows gold ETFs have seen four straight weeks of outflows, after eight weeks of net buying. “Every 1% move in the gold price translates into about 10 tonnes of ETF outflows,” said Michael Haigh, head of FIC research at Société Générale.
The reversal reflects investors’ defensive sentiment after gold peaked at $4,380 an ounce in mid-October, a new record high amid political uncertainty and expectations of lower interest rates. Still, safe-haven demand was strong enough to help prices recover to $4,126.77 by the end of Tuesday’s session, up 0.3%.
US Politics: A lull ahead of data
The US Senate has passed a deal to reopen the government, while the Republican-controlled House is expected to approve it this week, before it goes to the White House for President Trump to sign into law. The reopening of the government not only ends the government shutdown but also sets the stage for a new cycle of data releases, including official jobs and inflation reports.
Medium-term outlook: Gold demand remains strong
Despite short-term volatility, fundamentals remain supportive of gold. The precious metal has risen more than 55% year-to-date, on track for its biggest gain since 1979. “The medium-term support from global easing to central bank demand remains intact,” said Christopher Wong, a strategist at OCBC.
Summary
The gold market is operating in a cycle of monetary policy expectations and geopolitical safe-haven sentiment. As the Fed moves closer to easing and delayed data looms, price volatility is likely to remain high.
However, with sustained central bank buying and global risks remaining intact, gold remains a strategic asset in a reshaping global financial landscape.
Technical analysis OANDA:XAUUSD
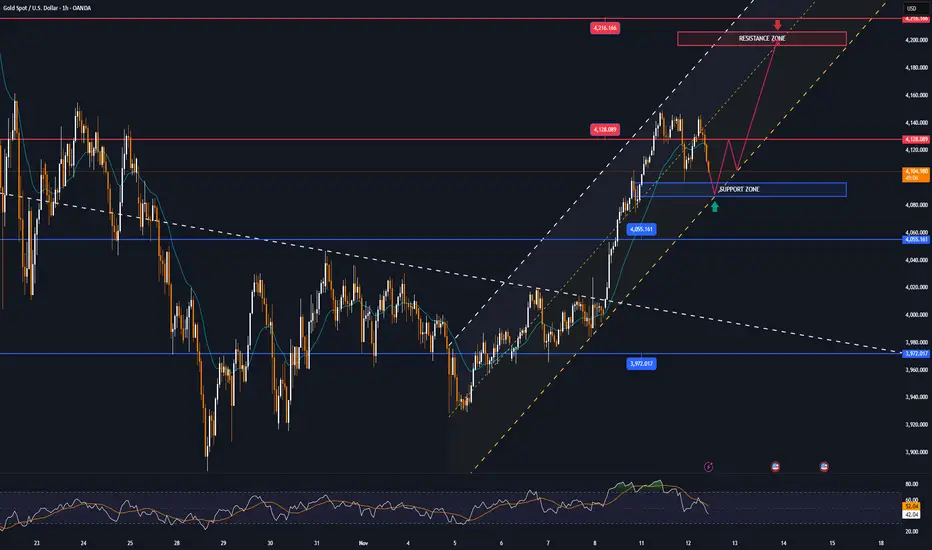
Gold prices are maintaining a short-term uptrend channel formed from the October bottom. After a deep correction around $3,970 – $3,850/ounce (corresponding to the Fibonacci levels of 0.382 and 0.5), the price has bounced back and is currently trading around $4,123, close to the technical resistance zone of Fib 0.236 at $4,128.
The moving average (MA21) is currently at $4,055, acting as a dynamic support zone in the short term. The recent candlestick structure shows that the bullish momentum is being consolidated with a series of higher lows, while the RSI has recovered towards 55, confirming that the bullish momentum is regaining the upper hand.
If gold holds above the $4,055 zone, the next upside targets are:
• Near resistance: $4,216 – $4,220 (psychological level and 0.236 Fibonacci resistance zone).
• Extended resistance: $4,308 – $4,380 (historic old peak zone).
On the contrary, if the price loses $4,055, the $3,972 – $3,846 zone will become the main support zone to watch, corresponding to the lower boundary of the current uptrend channel.
The overall trend remains bullish, provided the $4,055 support zone holds. The current phase is a recovery accumulation phase, which could open up a further rally towards $4,300 if US economic data continues to be weak and the Fed reinforces easing expectations.
SELL XAUUSD PRICE 4201 - 4199⚡️
↠↠ Stop Loss 4205
→Take Profit 1 4193
↨
→Take Profit 2 4187
BUY XAUUSD PRICE 4090 - 4092⚡️
↠↠ Stop Loss 4086
→Take Profit 1 4098
↨
→Take Profit 2 4105
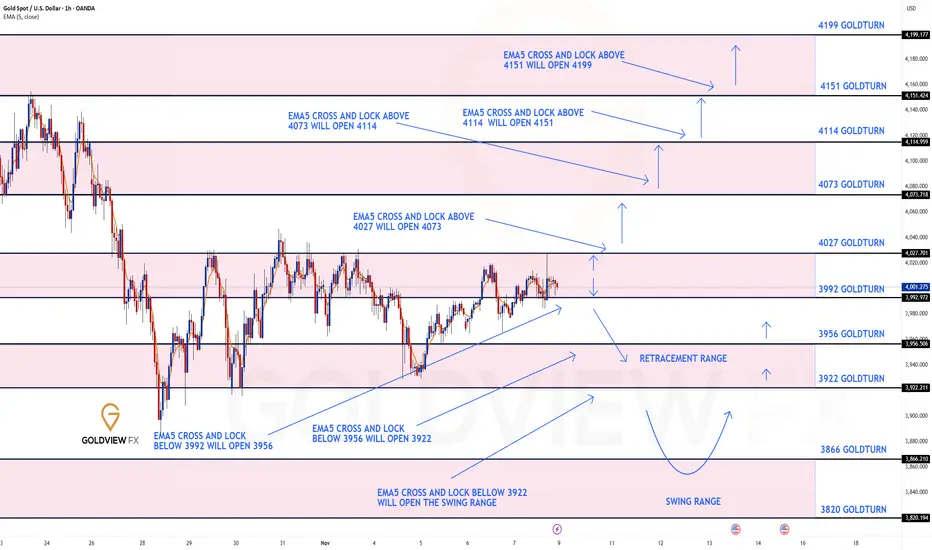
GOLD 1H CHART ROUTE MAP UPDATE & TRADING PLAN FOR THE WEEKHey Everyone,
Please see our updated 1h chart levels and targets for the coming week.
We are seeing price play between two weighted levels with a gap above at 4027 and a gap below at 3992. We will need to see ema5 cross and lock on either weighted level to determine the next range.
We will see levels tested side by side until one of the weighted levels break and lock to confirm direction for the next range.
We will keep the above in mind when taking buys from dips. Our updated levels and weighted levels will allow us to track the movement down and then catch bounces up.
We will continue to buy dips using our support levels taking 20 to 40 pips. As stated before each of our level structures give 20 to 40 pip bounces, which is enough for a nice entry and exit. If you back test the levels we shared every week for the past 24 months, you can see how effectively they were used to trade with or against short/mid term swings and trends.
The swing range give bigger bounces then our weighted levels that's the difference between weighted levels and swing ranges.
BULLISH TARGET
4027
EMA5 CROSS AND LOCK ABOVE 4027 WILL OPEN THE FOLLOWING BULLISH TARGETS
4073
EMA5 CROSS AND LOCK ABOVE 4073 WILL OPEN THE FOLLOWING BULLISH TARGET
4114
EMA5 CROSS AND LOCK ABOVE 4114 WILL OPEN THE FOLLOWING BULLISH TARGET
4151
EMA5 CROSS AND LOCK ABOVE 4151 WILL OPEN THE FOLLOWING BULLISH TARGET
4199
BEARISH TARGETS
3992
EMA5 CROSS AND LOCK BELOW 3992 WILL OPEN THE FOLLOWING BEARISH TARGET
3956
EMA5 CROSS AND LOCK BELOW 3956 WILL OPEN THE FOLLOWING BEARISH TARGET
3922
EMA5 CROSS AND LOCK BELOW 3922 WILL OPEN THE SWING RANGE
3866
3820
As always, we will keep you all updated with regular updates throughout the week and how we manage the active ideas and setups. Thank you all for your likes, comments and follows, we really appreciate it!
Mr Gold
GoldViewFX
XAUUSD : 4H Elliott wave at correction stageNow Correction stage
Short-term pattern :
Long to zone 4045 - 4193
Invalid if drops below 3884
Buy entry zone 3945-3975 if it breaks the yellow trendline
, will double confirm to C and end of X
Stop loss 3884
(If it can meet that green arrow zone, we wait and see a rejection candle for short again)
PS.
Medium-term pattern: Gold should drop below 3885, and wait for its reversal to get the bullish Long-term trend again

Gold (XAUUSD): Buy setupGold (XAUUSD): Buy setup. A good setup is appearing in 1H timeframe. Wait for break and buy.
Cheers

XAU/USD: Bullish Climb to 4225?FX:XAUUSD is positioning for a bullish climb on the 1-hour chart , with price respecting an upward trendline as dynamic support, bouncing from a key support zone that could fuel an upside extension toward multiple resistance levels if buyers sustain momentum. This setup offers a strategic entry amid recent volatility, with potential for breakout if volume picks up.
Entry between 4075-4105 (entry possible at current levels with strict risk management). Targets at 4180 (first) and 4225 (second), yielding a risk-reward ratio greater than 1:3 overall .Set a stop loss on a close below 4063 to limit downside exposure. 🌟 Monitor for confirmation via a strong bullish candle above entry with increasing volume, leveraging gold's safe-haven status.
Fundamentally , today's US economic data, including MBA Mortgage Applications at 13:00 UTC and Fed's Waller speech at 16:00 UTC, could sway USD strength and thus gold prices—hawkish Fed tones might cap upside, while softer data supports bulls. Recent analysis notes gold slipping below $4140 on a double top, signaling short-term pullbacks but with rebound potential testing pivotal resistance. 💡
📝 Trade Setup:
🎯 Entry Zone: 4075 – 4105 (entry possible at current levels with strict risk management)
💰 Targets:
1️⃣ 4180 – initial resistance zone
2️⃣ 4225 – secondary target / take-profit zone
❌ Stop Loss: Close below 4063
📈 Risk-to-Reward: Greater than 1:3 overall, depending on execution and scale-out strategy
What's your take on this gold move? Comment below!💡

GOLD: Cup & Handle Breakout Targets 4384 - 4413Gold (XAU/USD) has confirmed a bullish Cup and Handle breakout on the 4-hour timeframe, signaling a potential continuation of its upward trend. The neckline around 4,120–4,140 has been broken decisively with strong momentum and rising volume, confirming buyer dominance. After this breakout, the price is trading near 4,180, and the projected measured move suggests a potential upside of around 267 points (≈6.45%), targeting the 4,384–4,413 resistance zone. This zone aligns with previous structural resistance, making it an ideal short- to medium-term target. If momentum sustains, an extended move toward 4,450+ remains possible.
On the downside, 4,120 now acts as immediate support and could be retested before another push higher, while 4,000 remains the major support below which the bullish pattern would be invalidated. Overall, the outlook remains strongly bullish, with a clear breakout confirmation and favorable risk-to-reward structure for long positions.

GOLD STRONG BREAKOUT|LONG|
✅XAUUSD executed a clean market structure shift after accumulating below discount. With a strong displacement candle, bulls target premium inefficiency toward the next liquidity pocket. Time Frame 4H.
LONG🚀
✅Like and subscribe to never miss a new idea!✅
