Gold - The final resistance breakout!Gold - TVC:GOLD - prepares a final rally:
(click chart above to see the in depth analysis👆🏻)
Over the past 12 months, Gold rallied more than +70%. However the past three months clearly rejected a major horizontal resistance. But price action on the smaller timeframe remains incredibly bullish. Therefore an all time high breakout will most likely follow.
Levels to watch: $3.500
Keep your long term vision!
Philip (BasicTrading)
Gold

Gold Miners Stocks Go 'The Rife Game' in Town. Here's WhyGold mining stocks have emerged as one of the top-performing asset classes in 2025, driven by a combination of surging gold prices, improved profitability, and shifting investor sentiment.
Here’s fundamental and technical analysis of the key factors behind this outperformance, by our @PandorraResearch Super-Duper Beloved Team :
Record-High Gold Prices Fuel Margins
Gold prices surpassed $3,000 per ounce in March 2025 for the first time in history, marking a 14% year-to-date increase. This rally stems from:
Safe-haven demand amid geopolitical tensions, economic and political uncertainty including U.S. trade policy volatility.
Central bank buying , particularly by China, India, Turkey, and Poland, to diversify away from the U.S. dollar.
Anticipated interest rate cuts , which reduce the opportunity cost of holding non-yielding assets like gold.
Higher gold prices directly boost miners’ revenues.
For example, the NYSE Arca Gold Miners Index NYSE:GDM returned nearly 30% YTD by early March, outpacing both physical gold OANDA:XAUUSD (+14.5%) and the S&P 500 SP:SPX (-3.8%). Companies like Agnico Eagle Mines NYSE:AEM and Wheaton Precious Metals NYSE:WPM reached all-time highs, while ASX-listed miners such as Evolution Mining ASX:EVN (+39.5% YTD) and West African Resources ASX:WAF (+56.6% YTD) outperformed Australia’s broader market.
Margin Expansion and Shareholder Returns
Gold miners are leveraging rising prices to improve profitability:
Stabilized costs for labor, energy, and equipment have widened profit margins.
Free cash flow growth enabled dividend hikes and share buybacks. U.S. Global Investors, for instance, offers a 3.91% annualized dividend yield.
Undervalued stocks: Many miners traded at historically low valuations relative to gold prices, creating buying opportunities. Barrick Gold NYSE:GOLD (P/E 15.6) and Newmont Corp NYSE:NEM (P/E 15.5) remained attractively priced despite gains.
Royal Gold NASDAQ:RGLD , a streaming company with a 60.3% operating margin, exemplifies how non-traditional miners capitalize on gold’s rally without direct operational risks.
Sector-Specific Catalysts
Mergers and acquisitions. Consolidation activity has increased, with larger firms acquiring high-potential projects.
Copper exposure. Miners like Evolution Mining benefit from rising copper demand, diversifying revenue streams.
Institutional upgrades. Analysts at Macquarie and Morgan Stanley endorsed Newmont and Evolution Mining, citing currency tailwinds and free cash flow potential.
Macroeconomic and Market Dynamics
Dollar weakness. A declining U.S. dollar enhances gold’s appeal as a hedge.
Equity market volatility. With the S&P 500 struggling, investors rotated into gold equities for diversification (0.3 correlation to broader markets).
Fiscal deficits. U.S. budget imbalances and inflationary pressures reinforced gold’s role as a store of value.
Outlook for 2025
Analysts project further gains, with gold potentially reaching $3,300 per ounce. Miners are expected to sustain momentum through:
Operational efficiency improvements to align with higher gold prices.
Continued capital discipline , avoiding overinvestment in new projects.
Dividend growth , as seen with U.S. Global Investors’ monthly payouts.
Technical Outlook
The main technical graph for Gold Miners ETF AMEX:GDX indicates on further Long-Term Bullish opportunity, to double the price over next several years, in a case of the epic $45 mark breakthrough.
Conclusion
In summary, gold miners’ 2025 rally reflects a confluence of macroeconomic uncertainty, disciplined capital management, and gold’s structural demand drivers. While risks like cost inflation persist, the sector’s fundamentals and valuation upside position it as a compelling component of diversified portfolios.
--
Best 'Golden Rife' wishes,
@PandorraResearch Team 😎

GOLD - Selling opportunity on the horizonLooking at gold.
We have a nice bearish continuation orderflow on the 15min TF.
We have a nice potential inducement level of liquidity that we are more than likely to take before moving lower.
This is a reduced risk entry due to where we are on the higher TF as we are pulling into a potential demand zone on the higher timeframe.
ITS REALLY IMPORTANT to remember where we are in terms of structure and as we well know Gold doesn't tend to fall for to long as it remains bullish the majority of the time. so in regards to the HTF like I mentioned above we are still bullish so we are expecting a reversal for the longer term at some point in the near future so this could be a case of get what we can from the market and then look for our LTF orderflow to switch Bullish before then looking for them long entries

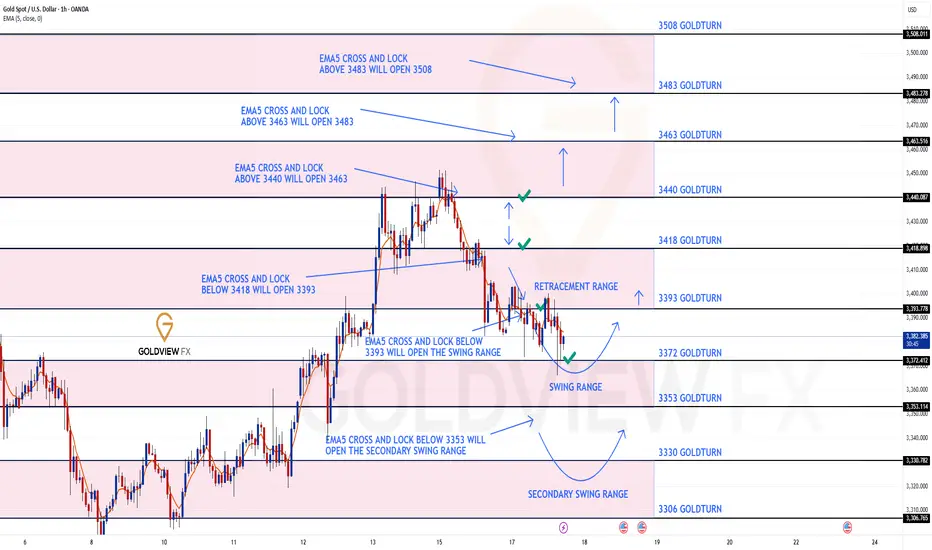
GOLD ROUTE MAP UPDATEHey Everyone,
Another great day on the markets with our chart idea playing out, as analysed!
Yesterday we started with our Bullish target at 3440 hit, followed with no EMA5 cross and lock, confirming the perfect rejection and showcasing the accuracy of our levels. This rejection went on to hit our Bearish target, followed by EMA5 cross and lock opening 3393, which was also hit perfectly.
🔄 Update:
After testing 3393, we got the EMA5 cross and lock, opening the swing range. The first level was tested perfectly and gave the bigger bounce. Let’s see if it completes the full swing back to 3393, or if it goes for the full swing test below.
We will keep the above in mind when taking buys from dips. Our updated levels and weighted levels will allow us to track the movement down and then catch bounces up.
We will continue to buy dips using our support levels, taking 20 to 40 pips. As stated before, each of our level structures gives 20 to 40 pip bounces, which is enough for a nice entry and exit. If you back-test the levels we shared every week for the past 24 months, you can see how effectively they were used to trade with or against short/mid-term swings and trends.
🌀 The swing ranges give bigger bounces than our weighted levels - that's the difference between the two.
BULLISH TARGET
3440 - DONE
EMA5 CROSS AND LOCK ABOVE 3340 WILL OPEN THE FOLLOWING BULLISH TARGETS
3463
EMA5 CROSS AND LOCK ABOVE 3463 WILL OPEN THE FOLLOWING BULLISH TARGET
3483
EMA5 CROSS AND LOCK ABOVE 3483 WILL OPEN THE FOLLOWING BULLISH TARGET
3508
BEARISH TARGETS
3418 -DONE
EMA5 CROSS AND LOCK BELOW 3418 WILL OPEN THE FOLLOWING BEARISH TARGET
3393 DONE
EMA5 CROSS AND LOCK BELOW 3393 WILL OPEN THE SWING RANGE
3372 - DONE
3353
EMA5 CROSS AND LOCK BELOW 3353 WILL OPEN THE SECONDARY SWING RANGE
3330
3306
As always, we will keep you all updated with regular updates throughout the week and how we manage the active ideas and setups. Thank you all for your likes, comments and follows, we really appreciate it!
Mr Gold
GoldViewFX
Falling below 3380,testing 3365,the low position remains bullish📰 Impact of news:
1. Geopolitical tensions in the Middle East
2. Iran nuclear talks
3. Retail sales data
📈 Market analysis:
After rebounding to the 3400 line, gold encountered resistance and fell back to test the support level of 3380. Although it was very close to the point of 3405 we gave, I did not enter the trade because gold has been in the middle section in the short term and has not rebounded to the ideal point.
There are too many long orders at high levels in gold. The international situation is so tense that gold is still slowly declining, but the geopolitical situation is still continuing. In addition, the retail sales data is bullish. Then, as the trading strategy given at noon, it is expected to test the short-term support of 3365-3355 below. I will consider going long in this range
🏅 Trading strategies:
BUY 3365-3355
TP 3380-3390-3400
If you agree with this view, or have a better idea, please leave a message in the comment area. I look forward to hearing different voices.
TVC:GOLD FXOPEN:XAUUSD FOREXCOM:XAUUSD FX:XAUUSD OANDA:XAUUSD

GOLD - WAVE 5 BULLISH TO $3,622 (UPDATE)Gold is currently going through a strong 'accumulation' phase for buyers, hence why we're seeing these choppy price actions, trying to liquidate buyers. It won't surprise me if we see dips lower, but overall we remain bullish as long as Gold is ABOVE THE WAVE 2 LOW. Breaking below this low, will invalidate bullish structure.
Wave 2 Invalidation Level - $3,245❌

GOLD MARKET ANALYSIS AND COMMENTARY - [Jun 16 - Jun 20]The unrest in the Middle East this week has boosted safe-haven demand for gold, pushing it above $3,400 an ounce.
While gold has broken several recent technical resistance levels, it is unlikely that it will hit a new record high next week. The ongoing conflict between Israel and Iran provides safe-haven support, but historically, gold rallies driven by geopolitical events tend to be short-lived.
Gold is currently outperforming the US dollar, which has struggled to attract safe-haven funds.
Iran launched a retaliatory airstrike on Israel on Friday night (June 13), Reuters reported. Air raid sirens sounded across Israel and authorities urged residents to take shelter in shelters.
The Israeli military said Iran fired nearly 100 missiles, most of which were intercepted or missed their targets.
Israel's Channel 12 reported two people were seriously injured, eight were moderately injured and 34 suffered shrapnel injuries.
Iran's Islamic Revolutionary Guard Corps said it had carried out military operations against dozens of targets in Israel.
The Iranian Revolutionary Guards' news website released a message that evening saying the "powerful and precise" counterattack was in retaliation for Israel's "invasion" of many parts of Iran and the killing of many senior military commanders, nuclear experts and Iranian civilians, including children.
Wider Middle East Conflict Could Erupt
Israel destroyed Tehran's military command system early Friday and struck key Iranian nuclear facilities. The Fars news agency, which is affiliated with Iran's Revolutionary Guards, cited data saying the Israeli attack killed dozens of people in Iran and wounded more than 300.
Israel has carried out large-scale airstrikes on multiple locations in Iran since early Friday, bombing Iranian nuclear facilities and military targets.
Reuters said Israel's attacks on Iran during the day and Iran's retaliation have raised concerns about a broader conflict in the region.
All Eyes on the Fed
While gold will continue to be affected by geopolitical developments, market attention will also be on the Federal Reserve, particularly Chairman Powell, who will speak after next week’s monetary policy meeting.
Economists generally expect the Fed to keep rates unchanged. However, expectations are growing that Powell could begin paving the way for a rate cut later this year.
The latest inflation data and signs of a slowing US economy have given the Federal Reserve room to cut rates. However, growing geopolitical uncertainty may prompt some market participants to adjust their expectations.
Overall assessment of the basic environment
The gold market in particular will still receive absolute support when there are too many risks appearing, from geopolitical developments to interest rate prospects, and tariffs. Major conflicts in the Middle East, Russia - Ukraine, trade war between the US and the rest of the world, ... are all sudden risk support that makes gold likely to surge in the short term. Therefore, in general vision, gold is considered the top safe-haven asset in the global unstable environment and it tends to increase in price in the current context.
Economic Data to Watch Next Week
Monday: State Manufacturing Survey, Bank of Japan Monetary Policy Meeting
Tuesday: US Retail Sales
Wednesday: US Weekly Jobless Claims, US Housing Starts, Federal Reserve Monetary Policy Meeting
Thursday: US Markets Closed for Black Lives Matter Day, Swiss National Bank Monetary Policy Meeting, Bank of England Monetary Policy Meeting
Friday: Philadelphia Fed Manufacturing Survey
Technical Outlook Analysis OANDA:XAUUSD
On the daily chart, gold has almost achieved all the bullish targets noted by readers in last week's weekly issue, initially at $3,371, then at the full price point and finally at $3,435. Gold can still continue to increase in price as technical conditions still absolutely support the short-term trend channel, while the long-term trend channel and the nearest support is the EMA21.
In terms of momentum, the Relative Strength Index (RSI) is sloping up after receiving support from 50 and is still far from overbought territory, indicating that there is still a lot of room for upside ahead.
To sum up, as long as gold remains within/above the price channel, it remains bullish in the short term. Any dips that do not break below the price channel should only be considered as short-term corrections or a new buying opportunity.
Finally, the notable positions will be listed as follows.
Support: 3,400 – 3,371 USD
Resistance: 3,435 – 3,500 USD
SELL XAUUSD PRICE 3497 - 3495⚡️
↠↠ Stop Loss 3501
BUY XAUUSD PRICE 3374 - 3376⚡️
↠↠ Stop Loss 3370

$DXY Dollar stays weak but is it bottommed?Have not many ANY trades based on the US Dollar. Have not been convinced in either way, yet.
TVC:DXY has been weaker lately but not by much. Well, at least compared to its previous low.
However, LONGER TERM we see it's biz as usual.
It is currently fairly oversold on the weekly chart & could be primed to change direction.

GOLD Massive Long! BUY!
My dear friends,
GOLD looks like it will make a good move, and here are the details:
The market is trading on 3389.4 pivot level.
Bias - Bullish
Technical Indicators: Supper Trend generates a clear long signal while Pivot Point HL is currently determining the overall Bullish trend of the market.
Goal -3396.3
Recommended Stop Loss - 3385.8
About Used Indicators:
Pivot points are a great way to identify areas of support and resistance, but they work best when combined with other kinds of technical analysis
Disclosure: I am part of Trade Nation's Influencer program and receive a monthly fee for using their TradingView charts in my analysis.
———————————
WISH YOU ALL LUCK

GOLD: Absolute Price Collapse Ahead! Short!
My dear friends,
Today we will analyse GOLD together☺️
The in-trend continuation seems likely as the current long-term trend appears to be strong, and price is holding below a key level of 3,394.60 So a bearish continuation seems plausible, targeting the next low. We should enter on confirmation, and place a stop-loss beyond the recent swing level.
❤️Sending you lots of Love and Hugs❤️

GOLD - Price will bounce from support area and start to growHi guys, this is my overview for XAUUSD, feel free to check it and write your feedback in comments👊
Some days ago price declined to $3220 level and then started to grow, and soon reached $3380 level and even broke it.
Then price started to trades inside wedge, where it at once started to decline and in a short time declined to support line of wedge.
After this, Gold rose and broke $3220 level and continued to move up in wedge, where it also made two gaps before.
Price rose to $3380 level and some time traded very close to this level, but later corrected to support line.
Next, price made a strong impulse, breaking $3380 level and exiting from wedge as well, and continued to grow.
Recently, Gold started to fall, so I think that it will fall to support area and then bounce up to $3500
If this post is useful to you, you can support me with like/boost and advice in comments❤️
Disclaimer: As part of ThinkMarkets’ Influencer Program, I am sponsored to share and publish their charts in my analysis.

Is gold (XAUUSD) building up for a possible push higher?With the economic data sets, which we are getting and will be getting this week, all eyes on gold, and its possible move to the all-time high. Apart from this, the geopolitical tensions are also something that is fueling gold demand. But what are the technical saying? Let's take a look.
TVC:GOLD
FX_IDC:XAUUSD
Let us know what you think in the comments below.
Thank you.
77.3% of retail investor accounts lose money when trading CFDs with this provider. You should consider whether you understand how CFDs work and whether you can afford to take the high risk of losing your money. Past performance is not necessarily indicative of future results. The value of investments may fall as well as rise and the investor may not get back the amount initially invested. This content is not intended for nor applicable to residents of the UK. Cryptocurrency CFDs and spread bets are restricted in the UK for all retail clients.

HelenP. I Gold may correct to support zone and then rebound upHi folks today I'm prepared for you Gold analytics. After rebounding from the trend line, XAUUSD began to grow steadily within the rising structure, confidently pushing through local resistance and breaking above the previous support 2 area. This breakout was backed by strong bullish momentum, with the price clearly holding above the broken level, turning it into a support base. Following that surge, the price entered a short-term consolidation, trading within the upper boundary of the chart, just above the 3400 level. This area now acts as a crucial support zone, and the market is currently hovering slightly above it after a local peak. Given the strength of the recent impulse and the confirmation of previous resistance as support, I expect a brief correction to the support zone before a continuation of the bullish move. That’s why I set my current goal at 3470 points — the next potential resistance area where the price may encounter renewed selling pressure after the rally continues. If you like my analytics you may support me with your like/comment ❤️
Disclaimer: As part of ThinkMarkets’ Influencer Program, I am sponsored to share and publish their charts in my analysis.

GOLD is in Retracement GOLD is in bullish trend and it can make a retracement so that would be around 3260

SPY/QQQ Plan Your Trade for 6-17: Top Resistance PatternToday's pattern suggests the SPY/QQQ will move into a type of topping pattern, attempting to identify resistance, then roll away from that resistance level and trend downward.
I suggest the news related to the conflict between Israel & Iran may continue to drive market trends with traders moving away from uncertainty near these recent highs.
Silver makes a big move higher. Gold will likely follow later this week or early next week.
BTCUSD moves into a sideways FLAGGING pattern - possibly attempting a BIG BREAKDOWN event over the next few weeks.
Overall, the markets look like they are poised for a very big move - just waiting for the GREEN LINK (GO).
Stay safe. Protect capital and HEDGE.
Get some.
#trading #research #investing #tradingalgos #tradingsignals #cycles #fibonacci #elliotwave #modelingsystems #stocks #bitcoin #btcusd #cryptos #spy #gold #nq #investing #trading #spytrading #spymarket #tradingmarket #stockmarket #silver

Gold Faces Resistance as Israel-Iran Conflict Fails to Fuel RallGold Unlikely to Sustain Long-Term Gains on Israel-Iran Tensions
Despite escalating geopolitical risks, gold’s upside remains limited. Julius Baer's Carsten Menke notes that the recent move is likely driven by short-term speculative and algorithmic flows, not physical safe-haven demand—consistent with historical patterns of brief geopolitical spikes.
Technical Outlook:
Gold is currently trading below 3404, suggesting possible range-bound consolidation between 3404 and 3480.
A 1H close below 3380 could trigger further downside toward 3365 and 3347.
Conversely, a break above 3404 would open the way for a bullish push toward 3448.
Key Levels:
• Pivot: 3381
• Support: / 3365 / 3347 / 3321
• Resistance: 3404/ 3420 / 3448

GOLD Will Go Higher From Support! Buy!
Take a look at our analysis for GOLD.
Time Frame: 9h
Current Trend: Bullish
Sentiment: Oversold (based on 7-period RSI)
Forecast: Bullish
The market is testing a major horizontal structure 3,395.19.
Taking into consideration the structure & trend analysis, I believe that the market will reach 3,467.28 level soon.
P.S
Overbought describes a period of time where there has been a significant and consistent upward move in price over a period of time without much pullback.
Disclosure: I am part of Trade Nation's Influencer program and receive a monthly fee for using their TradingView charts in my analysis.
Like and subscribe and comment my ideas if you enjoy them!

Forward-looking trading, focus on 3380 support📰 Impact of news:
1. Geopolitical tensions in the Middle East
2. Iran nuclear talks
3. Retail sales data
📈 Market analysis:
Gold prices are currently in a narrow range of fluctuations again, and the signal of Iran restarting nuclear negotiations has weakened risk aversion, triggering a correction in gold prices during the session, but tensions in the Middle East remain an uncertain factor. In the short term, we still need to focus on the breakthrough of the 3380 support line. If the 3380 support line is strong, we can still maintain a long trading idea in the short term and look to 3400. On the contrary, once it falls below, it is expected to look to the 3350 line. Pay attention to the breakthrough of 3400 on the upside. If the Asian and European sessions cannot effectively break through this short-term resistance, gold will continue to fluctuate.
🏅 Trading strategies:
BUY 3380-3370
TP 3390-3400-3450
SELL 3400-3390
TP 3380-3370-3350
If you agree with this view, or have a better idea, please leave a message in the comment area. I look forward to hearing different voices.
OANDA:XAUUSD FX:XAUUSD FOREXCOM:XAUUSD FXOPEN:XAUUSD TVC:GOLD

DeGRAM | GOLD kept the rising channel📊 Technical Analysis
● Price rejected the channel roof near 3 435 again, carving a small evening-star and slipping back under the May trend-median 3 370 — a repeat of April/May fades.
● Bearish RSI divergence plus a break of the micro up-sloper (last three sessions) tips for a rotation toward the lower rail/3 295 support; loss of that opens the April pivot at 3 225.
💡 Fundamental Analysis
● Sticky US retail-sales and hawkish Fed comments keep 2-yr yields near 4.8 %, firming the DXY, while CFTC data show specs cutting longs for a second week — limiting bid depth.
✨ Summary
Sell rallies 3 410-3 430; sustained trade below 3 366 targets 3 295, stretch 3 225. Short view void on an H4 close above 3 450.
-------------------
Share your opinion in the comments and support the idea with a like. Thanks for your support!

Gold Rebounds on Safe-Haven Flows – Is the Uptrend Back?Gold attracted some dip-buying interest during Tuesday’s trading session, reversing part of the previous day’s losses as rising geopolitical tensions reignited demand for safe-haven assets.
The market is increasingly pricing in the expectation that the Federal Reserve will begin a rate-cutting cycle in September — a scenario that favors non-yielding assets like gold. However, a modest recovery in the U.S. dollar could act as a headwind in the short term.
If conditions align, XAUUSD may capitalize on its recent upward momentum to resume the broader bullish trend, especially after completing a healthy pullback near the 0.618 Fibonacci retracement — in line with Dow Theory continuation.

Gold is Nearing an Important Support!!Hey Traders, in today's trading session we are monitoring XAUUSD for a buying opportunity around 3,360 zone, Gold is trading in an uptrend and currently is in a correction phase in which it is approaching the trend at 3,360 support and resistance area.
Trade safe, Joe.
GBPUSD H1 compression BUY/HOLD TP1 +100 TP2 +200 pips low risk🏆 GBPUSD Market Update
📊 Technical Outlook
Short-term: BULLS active; resistance forming mid‑1.3600s, consolidation below 1.3600s
Mid-term: Neutral to slight bullish bias; bulls seek 1.3600–1.3700/1.3730 zone
Status: Narrow trading range (tight band) ahead of key UK CPI, Fed & BoE meetings
🔥 Latest Forex Updates
GBP/USD is consolidating in a narrow range around the mid‑1.3500s ahead of this week’s UK CPI and central bank meetings.
The pair holds defensive below 1.3600, with dovish BoE bets capping gains while the Fed is expected to stand pat.
GBP/USD sits near a 40‑month high (~1.3600), boosted by geopolitical risk tone, but lacking momentum to break much higher.
GBP/USD hit ~1.3600 after rebounding from 1.3515 amid renewed Middle East tensions and a weaker US dollar.
Live charts show a mild bullish tilt, awaiting central bank outcomes.
💡 Trade Recommendation
Buy GBPUSD at 1.3530 (recommended entry near 1.3530)
Take Profit at 1.3730 → +200 pips profit target
Stop Loss: 50 pips (around 1.3480)
This trade aligns with the current structure: shallow dip followed by rebound, positioning ahead of central bank catalysts. Momentum above resistance could propel GBP/USD toward 1.3730.
📌 Market Overview
Metric Details
Current Price ~1.3565–1.3600
24H Range 1.3515–1.3600
Central Event Risks UK CPI (Wed), US Retail Sales & Fed (Wed), BoE (Thu)
Geopolitical Middle East tension supports USD weakness, aiding GBP
📈 Forecast Highlights
Support Levels: ~1.3530 (100‑period SMA), ~1.3460, ~1.3425
Resistance Levels: 1.3600, 1.3630 static ceiling, followed by ~1.3700–1.3730 for bulls
🧭 Final Take
GBP/USD sits in a tight range, awaiting central bank clarity. The recommended long trade at 1.3530 aims to capitalize on upside momentum toward 1.3730, supported by technical confluence and a softer USD. Manage risk with a 50‑pip stop loss.

Gold XAUUSD Move 16 June 2025Market Structure:
The market isin a clear uptrend, forming higher highs and higher lows until a recent break of the ascending trendline, signaling a short-term structural weakness.
Current price is in a retracement phase, heading towards previous demand zones.
🔹 Zone 1 (3408–3414):
Confluence of:
Broken trendline retest (former support).
Minor order block / demand zone.
Overlapping price reaction area.
Risk: This zone may act as a liquidity inducement before price sweeps deeper into Zone 2.
Entry trigger: Bullish engulfing or LTF market structure shift on 1m/5m.
🔹 Zone 2 (3380–3384):
Stronger demand zone:
Aligned with previous accumulation base.
Larger imbalance (FVG-type area) and bullish impulsive origin.
More convincing for high-RR entries.
Higher probability: If Zone 1 fails or only wicks price, Zone 2 may provide the main entry opportunity.
Entry trigger: Shift in LTF structure with volume spike or breaker flip.
✅ Trade Signal Suggestions
🟦 Setup 1: Buy from Zone 1
Entry: 3410 (upon bullish confirmation)
SL: 3400 (below structure low)
TP: 3434 (prior high)
RR: ~2.4R
Note: Only take if price forms bullish structure (MSS or BOS) on lower timeframe.
🟦 Setup 2: Buy from Zone 2
Entry: 3380/3384 (upon confirmation)
SL: 3372 (below demand zone)
TP: 3411 or 3434 (scalp to intraday swing)
RR: ~1:3 or better
Note: Wait for clean rejection or reversal candle from this zone.
⚠️ Risk Management
Risk 0.5–1% per trade.
Use entry confirmation such as:
Bullish engulfing
Fair value gap reaction
Break of internal structure
