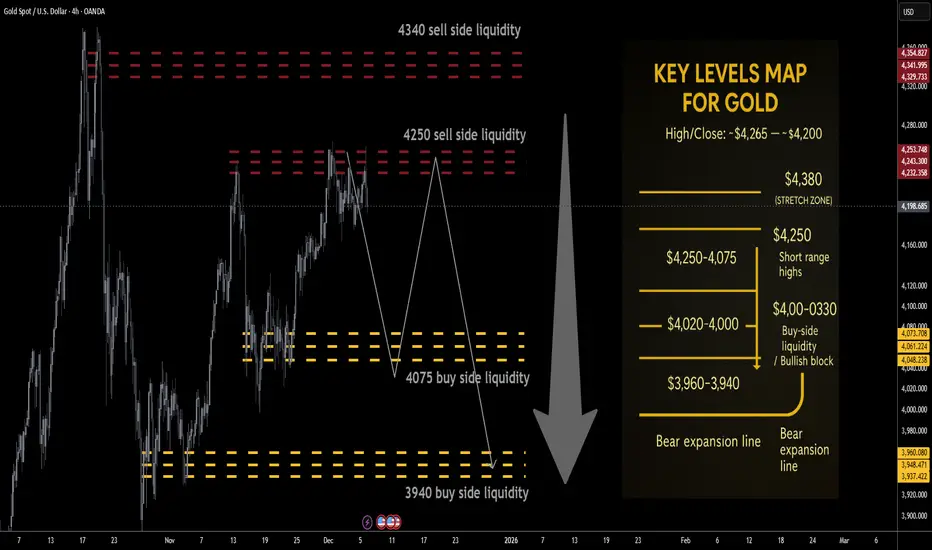
Gold next week Key S/R Levels and Outlook for Traders🔥 GOLD WEEKLY SNAPSHOT — BY PROJECTSYNDICATE
🏆 Swing High / Swing Low
$4,265 → ~$4,164 — clean rejection from the 4,26x breakout zone with a long upper wick, but weekly close still near $4,200, keeping price pinned in the upper part of the broader $4k range.
📈 Trend
Higher-timeframe: Structural bull trend intact while price holds above the $3,940–$4,000 block.
Tactical: Last week’s failed extension above $4,250 and the close back near $4,200 tilt the tape into distributive mode:
Rallies into $4,250 / $4,340 = sell-side liquidity magnets.
Downside liquidity sits lower at $4,075 / $3,940, making upside risk/reward look asymmetric to the downside from current levels.
🛡 Supports – Buy-Side Liquidity / Downside Objectives
$4,130–$4,100:
Short-term intraday pivot where buyers repeatedly stepped in last week; first micro-reaction zone on any flush.
$4,090–$4,075 🟢 Buy-side liquidity #1
First true BSL pocket below the close; ideal TP1 for shorts from above and a spot where responsive dip-buyers are likely to probe.
$4,020–$4,000:
Psychological shelf; loss of 4k would confirm that local distribution is winning and open the deeper BSL run.
$3,960–$3,940 🟢 Buy-side liquidity #2 / structural block
Higher-timeframe demand and key liquidity magnet for a fuller corrective leg. A sustained break/acceptance below $3,940 would signal that the 2025 blow-off is transitioning into broader mean-reversion rather than shallow consolidation.
🚧 Resistances – Sell-Side Liquidity / Short-Side Focus
$4,220–$4,250 🔴 Sell-side liquidity #1
First overhead supply from the prior week’s failed breakout structure and just under recent highs. Clean area for “sell the rip” probes and for late longs to de-risk.
$4,300–$4,340 🔴 Sell-side liquidity #2
Extension / SLI pocket aligned with the upper part of last week’s range and just below the prior $4,38x–$4,40x all-time high band. Ideal for scaling adds if a news-driven squeeze runs stops above 4,250.
Stretch: $4,380–$4,400:
Prior record spike / stop-run area; only expected on a full-on squeeze into the Fed, but a tag here would likely be exhaustion rather than a new sustainable trend leg higher.
🧭 Bias Next Week
Base tactical bias: fade strength / short rallies, not chase upside.
the tape favors a liquidity grab higher → rotation lower scenario:
Look for wicks into $4,220–$4,340 to be sold.
Downside path of least resistance: $4,090–$4,075 → $4,020–$4,000 → $3,960–$3,940.
⚖️ Base Case Scenario
Open/early week:
Price opens near $4,200 and either trades flat or spikes briefly into $4,220–$4,250 on weekend gap/early flow.
Liquidity sweep into resistance:
Rejection from SLI:
Failure to accept above $4,250/4,300 leaves upper wicks on 4H/daily, signaling distribution.
Rotation into BSL:
First objective: $4,090–$4,075 (TP1)
Secondary objective: $4,020–$4,000 (TP2)
Stretch / full flush: $3,960–$3,940 (TP3) into the structural demand block and buy-side liquidity pocket.
🚀 Breakout / Invalidation Trigger
Bearish framework invalidation:
A strong daily/weekly acceptance above $4,380 would imply shorts caught offside and re-open the path toward $4,450+ in line with the higher Street targets for 2026.
In that case, shift from short-the-rip → neutral / buy shallow pullbacks until a new top structure forms.
🔓 Bull / Bear Trigger Lines
Structural bull line:
Above $3,940–$4,000: long-term bull structure remains intact. Even if you’re tactically short, treat deep moves into this area with respect – this is where higher-timeframe players are likely to re-accumulate.
Bear expansion line:
Below $3,940: opens scope for a faster liquidation wave toward $3,880–$3,850 and potentially a broader 2025–26 consolidation phase instead of immediate continuation higher.
🧭 Recommended Strategy – Short at Market Open
⚠️ Illustrative trade plan, not financial advice. Size and risk-manage according to your own rules.
1️⃣ Primary Short – Open + Fade the Rips
Short at/near market open around the $4,195–$4,210 zone if price opens below $4,220 and orderflow confirms rejection of higher bids.
Add / build zones:
Add 1: into $4,220–$4,250 (first SLI band / prior breakout zone).
Add 2 (only if spike): $4,300–$4,340 (second SLI; look for clear blow-off / stop-run behavior before loading the last clip).
Stops / invalidation:
Tactical stop: hard stop above $4,380.
More conservative: soft line at $4,340, hard stop $4,390–$4,400 to allow for intraday wicks.
Targets (aligned with buy-side liquidity):
TP1: $4,090–$4,075 → take partials and reduce risk.
TP2: $4,020–$4,000 → core target for the week if distribution plays out.
TP3: $3,960–$3,940 → full BSL sweep into structural demand; expect responsive buying attempts here.
Gold
GOLD RISING TRENDLINE AHEAD|LONG|
✅XAUUSD price is reacting off the rising trendline after sweeping internal sell-side liquidity, creating an ICT-style rejection that signals a bullish draw toward the next buy-side inefficiency above. Continuation is favored as long as the trendline holds. Time Frame 2H.
LONG🚀
✅Like and subscribe to never miss a new idea!✅

GOLD Technical Analysis: Multi-Layer Structure & Key Scenarios 4H Timeframe Analysis ⏰
Gold has entered a structural corrective phase after a strong bullish trend that formed a Higher High (HH). This correction is visible in momentum, volume, and market structure with a confirmed Lower High (LH) formation. The combination signals a powerful Decision Point that will determine gold's medium-term direction. 🔄
🔶 Market Structure Breakdown
◼️ 1. Main Bullish Wave 🚀
After breaking October resistance, price formed a HH
HH showed buyer strength, but first weakness appeared:
Sharp rejection from top → Declining bullish momentum 📉
◼️ 2. Correction Phase ⬇️
Initial correction formed a Higher Low (HL)
Price failed to break previous high → Valid LH formed
Market entered neutral-to-bearish structure
◼️ 3. Current Status 🎯
Price is trapped between two key zones:
Resistance:4270
Support: 4022
Key Levels:
🔸 Resistance Zone: LH formation area, multiple rejections
Breakout = Correction end + New bullish wave 🟢
🔸 Mid Support: Trend anchor level
Break = First confirmation of bearish structure 🔴
🔸 Major Support:4170
Break = Medium-term correction activation 📉
🔶 Probable Scenarios
🟢 BULLISH SCENARIO (Resistance Break)
Break & close above LH zone
R→S conversion
New bullish wave with volume increase
Targets:4440
🔴 BEARISH SCENARIO (Support Break)
Failure at resistance + Mid support break
Deep correction wave + New LL formation
Targets: 3950
🔶 Market Psychology 🧠
Current price action shows:
Buyer caution ⚠️
Gradual sell orders accumulation at resistance
Limited seller power in corrections
High sensitivity to fundamental news 📰
Typical pre-breakout/breakdown consolidation
📢 Your Thoughts?
Comment below with your analysis! 👇
⚠️ RISK DISCLAIMER:
Trading carries high risk. Always educate yourself and use proper risk management. Not financial advice. 📚
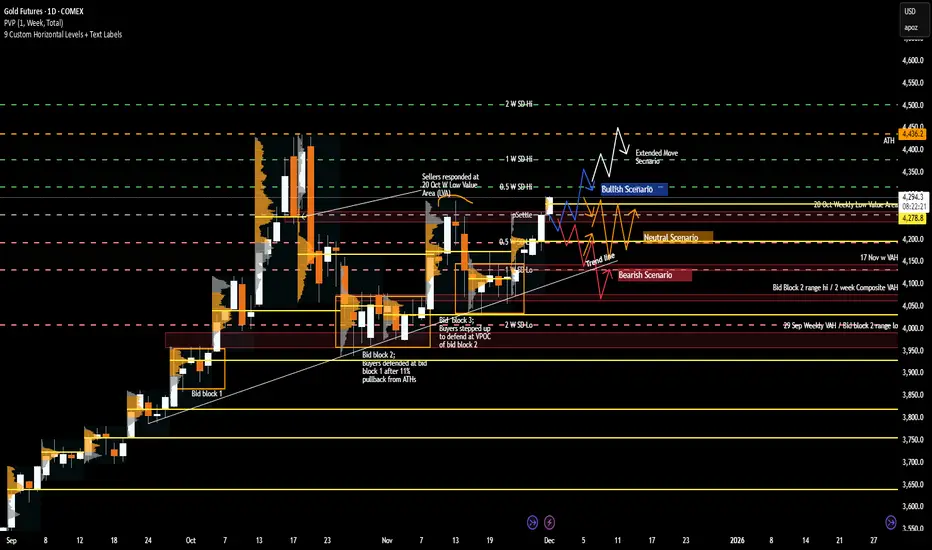
Gold Weekly Playbook: Key Levels, Scenarios & Sentiment Triggers1. Macro Update
Gold continues to trade within a macro environment defined by shifting rate expectations and evolving recession probabilities. With the Fed maintaining a data-dependent stance, the market remains highly sensitive to inflation and employment prints. Cooling inflation supports the case for rate cuts, pulling real yields lower and creating a constructive backdrop for gold.
Conversely, stubborn inflation pushes the narrative toward “higher for longer,” often slowing upside momentum and encouraging more rotational price action. This doesn’t immediately turn GC bearish, but it does cap impulsive continuation as traders reassess forward guidance.
Recession sentiment is the second major driver. Rising recession odds tend to benefit gold as investors rotate into safe-haven assets, even without imminent Fed easing. A persistent soft-landing narrative—stable labor markets, steady consumption—can reduce defensive flows and temper gold’s velocity. Overall, the macro backdrop remains cautiously supportive, but still very catalyst-driven.
2. What Has the Market Done?
Gold has exhibited constructive price action, with the recent week imbalancing up and out of the 17 Nov weekly balance/value area. Importantly, the market closed at the highs of the week, signaling sustained buyer aggression and broad acceptance of higher prices.
Weekly value and Volume point of Control (VPOC) have shifted upward, reinforcing a meaningful change in participant behavior: buyers are willing to transact at progressively higher prices, and sellers have not shown the ability to force price back into prior balance. This upward migration of value marks a firm shift in short-term sentiment.
The market is also now at an important structural zone at 4251.3—the 13 Oct weekly VPOC and the 20 Oct weekly Low value area (LVA). How the market reacts at this level—rejecting, stalling, or accepting—will be a telling indicator of whether buyers maintain control or whether sellers can slow the advance.
3. What to Expect in the Coming Week
The key level to watch this week:
4254.9 - Previous week/month’s settlement price
This level acts as a major pivot for directional conviction. Holding above settlement supports the case for continuation; a sustained move below it increases the likelihood of rotation or deeper testing.
Bullish Scenario
If the market holds and accepts above 4254.9, upside continuation becomes likely.
Target 1: 4378.6 (Weekly 1 Standard Deviation (SD) High) – expect responsive sellers.
If market accepts above 4378.6:
Target 2: 4436.2 (ATH region) – extended bullish objective.
Bearish Scenario
If the market fails to hold above 4254.9, expect sellers to target 4195.3 (previous week’s VPOC).
Additional downside triggers:
If buyers cannot reclaim 4261.3 (previous week’s high), pressure may push price through prior value toward 4136.5.
If buyers then fail to reclaim back above 4195.3:
Next target: 4131.2 (Weekly 1 SD Low / 17 Nov VPOC / Bid Block 3 midpoint).
Continued seller control may extend the move toward 4070/80, aligned with the 2-week composite VAH and upper boundary of Bid Block 2.
Neutral Scenario
If neither buyers nor sellers show conviction, expect two-way consolidation around previous week’s settlement, 4254.9, between 4316.7 and 4193.1 (10 Nov weekly high / 20 Oct LVA / weekly 0.5 SD high).
This remains the most probable balance zone unless a macro catalyst drives breakout behavior.
This week’s structure is clean: one major pivot and clearly defined pathways for both sides. Whether GC breaks out or slips back into rotation will hinge on how price behaves around 4254.9.
What’s your outlook for Gold this week? Drop a comment and give this post a boost so more traders in the community can join the discussion!
Disclaimer: This is for educational purposes only and not financial advice. Always trade your own plan with proper risk management.
GOLD 1H Analysis – Breakout / Retest Trendline in PlayGOLD 1H Analysis – Breakout / Retest Trendline in Play
Gold is currently testing the upper channel resistance, forming a rising wedge pattern similar to the previous two structures. Each time price formed this pattern, we saw a sharp breakout and a retest, followed by a clear directional move.
Now, price has reached the critical decision area again.
---
🔍 Key Insights
📌 1. Rising Wedge Formation
The market has repeated the same structure three times:
Price climbs inside a tight channel
Tests the top of the wedge
Breaks out → retests → strong move
This repetition increases the probability of another structured move.
---
📉 Bearish Scenario (Higher Probability)
If price fails to break above the wedge and rejects at the red arrow:
Expect a move back to the trendline
Break below the trendline will confirm bearish continuation
Targets: 4210 → 4185 → 4160
This aligns with the orange arrows on your chart.
---
📈 Bullish Scenario (Lower Probability but valid)
If price breaks above the wedge cleanly:
Expect a retest
Upside movement possible
Targets: 4280 → 4300
This reflects the yellow upward arrows drawn on your chart.
---
📌 Summary
Gold is at a decision point.
A breakout from this wedge will define the next move.
👉 Watch for:
A clean rejection at resistance for the sell setup
A clean breakout above the wedge for the buy continuation.

Why Gold Hits Your SL🌟 Why Gold Hits Your SL 😭💛📈
Gold is one of the most aggressive and volatile assets in the market — and if you’ve ever wondered “Why does gold ALWAYS hit my stop-loss before moving in my direction?”, this post explains the real reason.
Let’s break it down clearly 👇
🔶 1. Gold Loves Liquidity — Not Levels 💦💰
Gold doesn’t move based on your support/resistance lines.
It moves based on liquidity, meaning:
Where traders place stop-losses ❌
Where pending orders sit 🎯
Where large institutions want to fill positions 🏦
Your SL is simply sitting where everyone else puts theirs, which makes it prime liquidity.
🔶 2. XAUUSD Spikes Are Designed to Collect Orders ⚡💥
Gold often creates sudden:
Wicks
Fake breakouts
Quick pumps or dumps
Sharp candle spikes
These moves are NOT random — they’re engineered to:
🔸 Trigger stop-losses
🔸 Activate pending buy/sell orders
🔸 Grab liquidity before the real move
This is why your SL gets hit by $1–$3 before price completely reverses.
🔶 3. Gold Moves Session-by-Session 🕒🌍
Gold behaves differently depending on the time of day:
Asia session → Slow, tight range
London session → First big manipulation
New York session → Volatility explosion + real direction
Most SL hunts take place when London opens or when NY session begins ⚠️🔥
🔶 4. Clean Highs & Lows = SL Magnets 🧲📌
Gold LOVES attacking:
Previous day’s high/low
Asian range high/low
London session extremes
Double tops & bottoms
Round numbers (like 4000 / 4050 / 4100)
These areas hold thousands of stop-losses.
So before gold takes a real direction — it sweeps them first. 🏹😈
🔶 5. The Classic Gold Pattern: Trap → Reversal → Expansion 🔁🚀
Most XAUUSD moves follow this sequence:
1️⃣ Sweep liquidity 😭
2️⃣ Fake breakout 😈
3️⃣ Sharp rejection 👋
4️⃣ Real trend begins 🚀
If you’ve ever seen price:
Break a level
Wick hard
Then reverse the entire move
That’s gold performing a liquidity grab.
🔶 6. How To Avoid Getting Stopped Out ✔️
Here’s what actually helps:
🌟 A. Don’t put SL exactly at obvious levels
Move it beyond common liquidity zones.
🌟 B. Wait for the sweep before entering
Let gold perform the trap first.
🌟 C. Trade reaction — not prediction
Look for re-entry after the wick forms.
🌟 D. Use sessions to your advantage
Avoid placing SL right before London/NY opens.
🌟 Final Words
Gold isn’t hunting you —
it’s hunting liquidity.
Your job is simple:
👉 Stop placing stops where everyone else does
👉 Let gold sweep liquidity first
👉 Then catch the real move
Trade smarter, not tighter. 💛⚡

XAU/USD (Gold) H4 AnalysisXAU/USD (Gold) H4 Analysis: Anticipating a Market Structure Shift (CHoCH) using Proprietary Trend Break Target Indicator
Hello traders,
We are conducting a detailed technical analysis on XAU/USD (Spot Gold) using the 4-Hour (H4) timeframe. Our focus is on identifying a high-probability reversal point using a custom-developed tool: the Trend Break Target (TBT) Indicator. This indicator is designed to detect early market structure shifts and project potential continuation targets.
Current Market Context and Bias
Gold has shown volatility, but the immediate structural integrity is being tested. Our analysis suggests that the current move is consolidating or approaching a critical inflection point. The resolution of this consolidation, specifically relative to our defined structural levels, will dictate the next significant directional move.
The Critical Confirmation Trigger
The entire bearish hypothesis hinges on one non-negotiable condition, which defines the Change of Character (CHoCH) in the H4 structure:
The Structure Break: We are closely monitoring the Red Dashed Line generated by our TBT indicator. This line represents a crucial swing low or internal support level whose violation signals a definitive shift in market control from buyers to sellers.
Confirmation Requirement: A sustained break and a clear candle close below this Red Dashed Line is required. A mere wick breach is insufficient. This close will officially mark the Change of Character (CHoCH), confirming that the short-term market bias has switched to Bearish.
Actionable Signal: Only upon this confirmed breakdown should traders consider entering a short position, using the close below the line as the entry trigger or confirmation point.
Projected Downside Targets (TBT Projections)
Should the CHoCH be confirmed, our proprietary indicator projects two key targets for the continuation of the bearish momentum:
🎯 Target 1 (Initial Objective): $4125
This level acts as the first high-probability objective, typically aligning with a measured move calculation or a previous area of interest (POI). It represents the immediate profit-taking zone for the initial bearish thrust.
🎯 Target 2 (Continuation Objective): $4067
If bearish momentum persists and the 4125 level is broken, the market is likely to extend its move toward 4067. This target represents a deeper structural test and a potential area for a significant price bounce or further capitulation.
Risk Management Consideration
For any trade initiated based on this breakdown, an appropriate stop-loss placement should be considered above the swing high that precedes the breakdown, or judiciously placed above the Red Dashed Line to invalidate the bearish structure quickly if price reclaims the level.
Disclaimer: This analysis is based on a proprietary trading model and is for informational and educational purposes only. Market conditions can change rapidly. Always apply sound risk management and conduct your own due diligence.

XAUUSD Analysis TodayXAUUSD Analysis Today – Key Levels, Liquidity Map and High-Probability Trading Plan
Gold is currently retracing after a clear fake breakout on the intraday structure, showing strong rejection from the extended premium zone. Price action on H1 reflects a shift from bullish exhaustion to short-term corrective movement, with liquidity sitting below the most recent swing low. Today’s session will likely revolve around sweeps, mitigation, and a return to discounted zones before any meaningful continuation.
1. Market Structure Overview
The H1 chart shows:
A completed ascending channel with a clear BOS followed by a liquidity sweep.
Price rejecting from the upper imbalance and returning toward equilibrium.
A notable Fake Breakout around 4214–4218 where liquidity was engineered before the sell-off.
The current decline is forming a corrective leg aimed toward the demand range.
This price behavior confirms a move into the BUY ZONE 4168–4186, aligning with Fibonacci retracement and trendline confluence.
2. Important Support & Resistance Levels
Key Resistance
4252–4257: Major supply and premium zone, strong rejection expected on first touch.
4220–4225: Reaction zone where the fake breakout occurred; a retest here may create another liquidity hunt.
Key Support
4201–4208: First reaction demand zone, shallow pullback potential.
4186–4174: Deep discount area, Fibonacci confluence, major BUY ZONE.
4168: Strong low protected by higher-timeframe liquidity.
3. Indicator Confluence
EMA Cluster (20/50/100) is compressing downward, confirming short-term correction.
RSI shows no bullish divergence yet, meaning the sweep of liquidity is still incomplete.
Fibonacci 61.8–78.6% aligns with the 4174–4168 zone, increasing probability of bullish reversal.
4. Expected Price Behavior Today
Scenario A (High Probability):
Price continues toward 4174–4168, sweeps liquidity, then forms a bullish CHoCH on lower timeframe before aiming for 4208 → 4220 → 4252.
Scenario B (Moderate Probability):
Price rejects early at 4201, retraces into 4220 supply, then drops again to deeper levels before reversing.
Scenario C (Low Probability):
Immediate bullish break above 4225 without retesting deeper zones.
5. Trading Strategy (High-Probability Setups)
Buy Strategy – Preferred Setup
Entry: 4174–4168 (Fibonacci + strong demand)
Stop Loss: Below 4160
Take Profit:
TP1: 4208
TP2: 4220
TP3: 4252–4257
This zone is optimal due to liquidity, trendline tap, and deep retracement discount.
Sell Strategy – Counter-trend Short
Entry: 4220–4225 (fake breakout zone retest)
SL: Above 4232
TP: 4205 → 4186
This trade targets the inevitable sweep to the BUY ZONE.
6. Summary
Gold is in a short-term corrective phase inside a larger bullish macro sentiment. Key liquidity remains below, and the most effective strategy today is waiting for deeper discount zones before looking for strong buys.

GOLD Is Very Bearish! Sell!
Please, check our technical outlook for GOLD.
Time Frame: 9h
Current Trend: Bearish
Sentiment: Overbought (based on 7-period RSI)
Forecast: Bearish
The market is approaching a key horizontal level 4,198.77.
Considering the today's price action, probabilities will be high to see a movement to 4,117.75.
P.S
Please, note that an oversold/overbought condition can last for a long time, and therefore being oversold/overbought doesn't mean a price rally will come soon, or at all.
Like and subscribe and comment my ideas if you enjoy them!

XAUUSD- GOLD FORMING "W" PATTERN KEY (READ CAPTION)Hello trader's what do you think about gold
Gold (XAUUSD) is currently forming a clear W Pattern / Double Bottom structure, which is a strong indication of a potential bullish reversal in the market.
Support Levels
Support 1: 4180 — A strong reaction zone where buyers have previously held the market multiple times.
Support 2: 4293 — A higher support zone that can act as a continuation level if price respects it on a pullback.
Market Outlook
The price action is showing a clean W pattern, suggesting that if the neckline breaks, we can expect a strong bullish move.
If price retraces downward, both 4180 and 4293 serve as ideal buy zones for buyers preparing for the next bullish leg.
Technical Summary
W Pattern → Potential bullish reversal
4180 → Deep correction support
4293 → Continuation support
please don't forget to like comment and follow

Gold 1H – Will 4242 Displace or 4170 Unlock the Next Leg?🟡 XAUUSD – Intraday Smart Money Plan | by Ryan_TitanTrader (04/12)
📈 Market Context
Gold squeezes into engineered liquidity as Donald Trump signals policy authorization for ultra-compact car production in the U.S., adding risk-on volatility to USD narratives. Markets may front-run sentiment shifts into commodities like gold. Expect fast bilateral sweeps before institutions reveal intent.
On H1, structure toggles between premium supply at 4242–4244 and discount demand at 4170–4168. The next directional leg requires MSS + BOS + displacement confluence.
🔎 Technical Framework – Smart Money Structure (1H)
Current Phase = liquidity-rich compression at H1 extremes
Liquidity Zones & Key Triggers
• 🔴 SELL GOLD 4242 – 4244 | SL 4252
• 🟢 BUY GOLD 4170 – 4168 | SL 4160
Bias invalidation only via structure break + displacement validation.
Expected Sequence = Sweep → MSS/CHoCH → BOS → Displacement → Retest → Expansion
🎯 Execution Rules (unchanged methodology, matching your zones)
🔴 SELL GOLD 4242 – 4244 | SL 4252
Rules:
✔ Zone tap 4243 → bearish MSS/CHoCH (M5–M15)
✔ Clean bearish BOS down + candle displacement
✔ Entry on FVG fill or OB retest after displacement
Targets:
1. 4200 – 4190
2. 4182 – 4176
3. 4170 – 4168
🟢 BUY GOLD 4170 – 4168 | SL 4160
Rules:
✔ Sweep under 4169 → bullish MSS/CHoCH + BOS up
✔ Displacement candle away from discount
✔ Wick rejection into FVG fill / OB retest confirm
Targets:
1. 4186
2. 4210
3. 4242+
⚠️ Risk Notes
• Both sweeps = traps until BOS + Displacement confirms intent
• No averaging inside compression
• SL = structural invalidation only
• Reduce size during headline-driven spikes
📍 Summary
Two institutional paths today:
• 4243 sweep → bearish MSS/BOS → retest → delivery into 4170
or
• 4169 sweep → bullish MSS/BOS → retest → expansion into 4242+
Trade the structure. Let price narrate the intent. Patience = edge. 🚀
📌 Follow @Ryan_TitanTrader for daily Smart Money breakdowns.

Gold completes its corrective phase and heads toward $4,250OANDA:XAUUSD is moving within a remarkably well-structured ascending channel, and the overall market structure clearly highlights the strength of the buying momentum. Each swing produces higher highs and higher lows, confirming that the bullish dynamic remains intact despite a few natural pauses along the way. The recent pullback looks more like a healthy technical breather than a sign of weakness, often the kind of pause that sets the stage for a new upward acceleration.
The price is now approaching a key support zone, where the lower boundary of the channel aligns with a previously proven demand area. If the market reacts here, buyers could find a highly favorable re-entry opportunity that aligns perfectly with both the channel structure and the logic of the current trend. In that scenario, the natural upside target is around 4,250 dollars, a level that combines the channel’s midline with a historical resistance, giving even more weight to this objective.
The bullish outlook remains valid as long as the price holds above the support zone and the ascending trendline. A decisive break below these levels would redefine the market context and open the door to a deeper correction, but for now, market conditions continue to favor long positions.
Stay disciplined in your market reading, validate your setups carefully, and protect your capital with strict risk management. Good luck.

Gold Awakens: Sharp Pullback but Outlook Remains BrightFrom a technical perspective, gold is currently moving within a parallel ascending channel, showing a clear bullish momentum with a rhythm that is hard to ignore. The price recently bounced away from the resistance area, indicating a typical overbought reaction. At the moment, the market is approaching the lower boundary of this projected channel, an area considered important. The convergence of several technical support levels in this zone is likely to attract renewed buying interest.
I expect the price to rebound toward the 4,250 area, which aligns with the mid-channel region. The bullish momentum may not appear immediately. The situation could develop into a consolidation phase, a false decline, or even a sudden acceleration.

XAUUSD: A new rise is possible after the pullbackXAUUSD has climbed strongly along a steep uptrend, and based on what I’m seeing on the chart, I expect the price to continue pushing toward the 4,265 area.
This zone could become a decision point where the price either finds support and bounces higher or breaks below and allows the move to extend deeper.
If I had to choose a direction right now, I’d lean toward more upside. But price action will always decide what comes next because the chart always speaks last.
When the price breaks below the trendline with real conviction, the bullish scenario loses validity. That could signal a pause in the uptrend or even a short-term reversal.
This is not financial advice, only my personal thoughts based on what I see on the chart.

Gold - The bullrun top happens now!✂️Gold ( OANDA:XAUUSD ) is heading for a major reversal:
🔎Analysis summary:
After the all time high breakout back in 2024, Gold has been rallying about +115% until today. During this entire move, Gold did not create any real correction. Considering that Gold is currently retesting a major resistance trendline, the bullrun top happens now.
📝Levels to watch:
$4,000
SwingTraderPhil
SwingTrading.Simplified. | Investing.Simplified. | #LONGTERMVISION

Gold 30-Min — Volume Buy Reversal Triggered⚡Base : Hanzo Trading Alpha Algorithm
The algorithm calculates volatility displacement vs liquidity recovery, identifying where probability meets imbalance.
It trades only where precision, volume, and manipulation intersect —only logic.
✈️ Technical Reasons
/ Direction — LONG / Reversal 4205 Area
☄️Bullish momentum confirmed through strong candle body.
☄️Structure shifted with higher-low near key demand base.
☄️Volume expanding confirms order-flow alignment upward.
☄️Buyers reclaimed imbalance with sustained clean break.
☄️Algorithm detects rising momentum under low liquidity.
⚙️ Hanzo Alpha Trading Protocol
The Alpha Candle defines the day’s real control zone — the first battle of momentum.
From this origin, the Volume Window reveals where the next precision strike begins.
⚙️ Hanzo Volume Window / Map
Window tracked from 10:30 — mapping true market behavior.
POC alignment exposes institutional bias and breakout potential zones.
⚙️ Hanzo Delta Window / Pulse
Delta window monitors real buying vs. selling power behind each move.
Tracks volume aggression to expose who controls the candle — buyers or sellers.
When Delta aligns with Volume Map, momentum becomes undeniable.

GOLD Local Long! Buy!
Hello,Traders!
GOLD price is approaching the demand imbalance and is likely to retest the mitigation zone before expanding higher, targeting resting liquidity above the short-term swing levels. Time Frame 2H.
Buy!
Comment and subscribe to help us grow!
Check out other forecasts below too!
Disclosure: I am part of Trade Nation's Influencer program and receive a monthly fee for using their TradingView charts in my analysis.

Gold (xauusd): two inverse head and shouldersHi!
Gold continues to show constructive bullish behavior on the 1-hour timeframe, validated by consecutive inverse Head & Shoulders (iH&S) formations that developed around major support areas.
The first iH&S appeared near 4,173–4,180 USD, where price formed a clear left shoulder, deep head, and right shoulder inside a well-defined demand zone. The neckline was broken cleanly, confirming bullish intent. The projected target for this larger pattern lies in the 4,265–4,272 USD region (pink zone), which remains the ultimate upside objective as long as structure holds.
After the breakout, Gold retraced and created another smaller iH&S nested within the broader pattern. This second structure also built its head inside the same support region, highlighting strong buyer defense. Its neckline breakout signals a nearer target at 4,242–4,250 USD (green zone).
Gold is currently trading above the smaller neckline, retesting the breakout level. A successful retest followed by higher lows would likely fuel continuation toward the green zone, and eventually toward the pink zone, completing the larger pattern’s measured move.
Failure to hold above the neckline may lead to a deeper pullback toward 4,185–4,195 USD, but the bullish pattern remains valid unless the head area is breached.
Overall, structure supports a continuation of the uptrend as long as price remains above the neckline and key support levels.
Disclaimer: As part of ThinkMarkets’ Influencer Program, I am sponsored to share and publish their charts in my analysis.

GOLD Sellers In Panic! BUY!
My dear followers,
I analysed this chart on GOLD and concluded the following:
The market is trading on 4192.4 pivot level.
Bias - Bullish
Technical Indicators: Both Super Trend & Pivot HL indicate a highly probable Bullish continuation.
Target - 4205.9
Safe Stop Loss - 4184.7
About Used Indicators:
A super-trend indicator is plotted on either above or below the closing price to signal a buy or sell. The indicator changes color, based on whether or not you should be buying. If the super-trend indicator moves below the closing price, the indicator turns green, and it signals an entry point or points to buy.
Disclosure: I am part of Trade Nation's Influencer program and receive a monthly fee for using their TradingView charts in my analysis.
———————————
WISH YOU ALL LUCK

GOLD → Consolidation above 4220. Bullish structureFX:XAUUSD is trading in a narrow range around $4,200, maintaining sideways momentum ahead of US inflation data. The market confirms a bullish structure...
The probability of a Fed rate cut in December remains at ≈90%.
Mixed US employment data:
– Jobless claims fell to their lowest level since September 2022.
– Layoffs in November reached a two-year high.
The key benchmark today is the PCE index for September (data delayed due to the government shutdown).
Gold is awaiting new signals on inflation. Range trading is likely until the release of PCE data, which may set the direction of movement ahead of the Fed's decision.
Resistance levels: 4238, 4262
Support levels: 4220, 4183
If the bulls hold their ground above local support at 4220, we will have a chance to break through 4238 and retest 4262. However, a breakout of the trading range resistance could trigger a continuation of the rally towards the ATH.
Best regards, R. Linda!

GOLD MARKET UPDATEHey Everyone,
As we close out the week, price action on the 1 hour chart continues to consolidate within the defined Goldturn range between 4193 and 4233. The 4193 weighted Goldturn has held as a structural support level, generating the rebound that carried price back into 4233.
Earlier in the week, we observed a cross and lock above 4233, which leaves the 4275 gap unfilled. This upside inefficiency will remain on our radar as long as price holds above the mid range structure.
We will return Sunday with a full multi-timeframe breakdown and detailed trade tracking plan for the upcoming week.
Mr Gold

The overall trend remains unchanged, it's still a bullish market#XAUUSD TVC:GOLD OANDA:XAUUSD
Gold has now broken out of the triangle pattern. Looking at the daily, 4H, and hourly charts, MA5 is around 4215. Furthermore, the short-term moving averages are showing an upward trend. Therefore, I believe we can consider taking a small long position in gold when it retraces to around 4215-4205 during the European session.

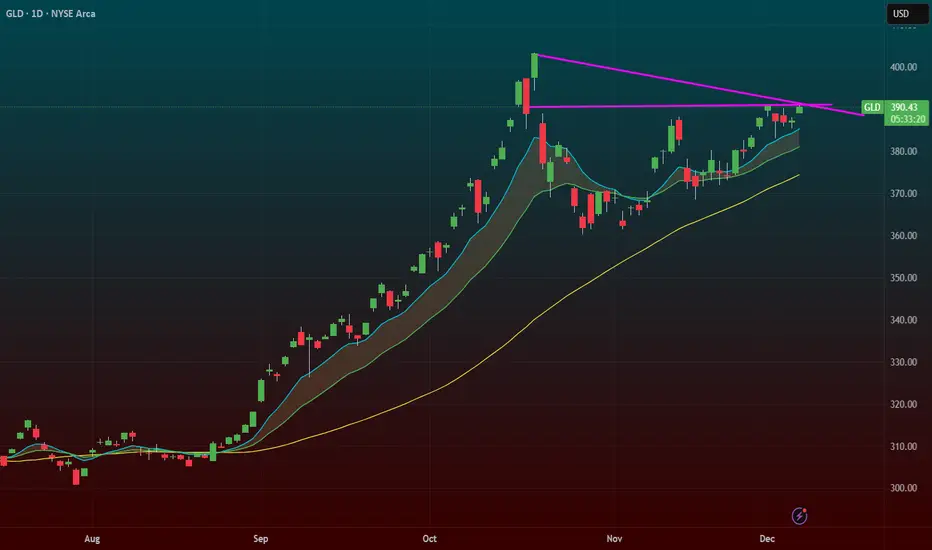
$GLD – Multiple Breakouts Converging: Flag + Trendline + Gap FilGold ( AMEX:GLD ) is triggering one of the cleanest breakout setups on the entire market right now. We're getting a flag breakout, a longer-term trendline break, and we’re pushing straight into a gap fill from October 20th — all at the same time.
This is the kind of confluence I dream about.
🔹 The Setup (Perfect Storm):
Flag breakout: Tight consolidation resolving to the upside.
Major trendline break: Longer-term resistance finally giving way.
Gap fill trigger: Entering the October 20th gap — once inside, price often accelerates.
Rising EMAs underneath = structural momentum.
This is big-time swing trade stuff.
🔹 Why This Chart Matters:
The entire precious metals complex is heating up.
Silver already broke out — gold often follows and trends harder.
Macro tailwinds (inflation whispers, deficits, dollar wobble) are fueling demand.
🔹 How I’m Trading It (Progressive Exposure):
1️⃣ Starter Position: Bought $400 GLD calls last week.
2️⃣ Futures Position: Long AMEX:MGC for premarket flexibility.
3️⃣ Pyramiding Plan: As the setup improves — more confirmation, more levels break — I add to the trade.
I don’t go full-size at entry.
I scale in as the trade proves itself.
This is the exact progressive exposure method I’ve used for 15+ years.
🔹 Risk:
Stop beneath the 9 EMA on the daily for my futures position.
GLD calls are defined-risk by nature.
This is the real deal — the type of breakout where gold can trend for weeks.