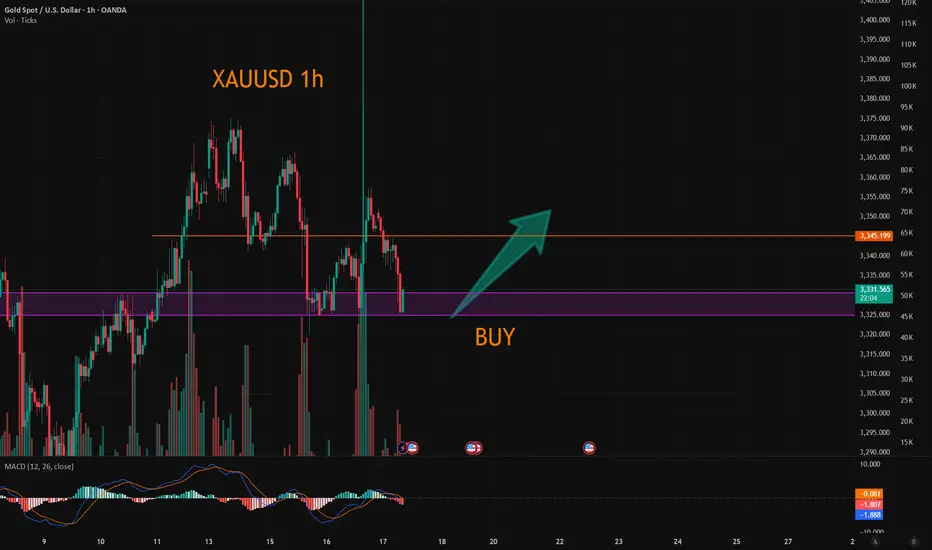
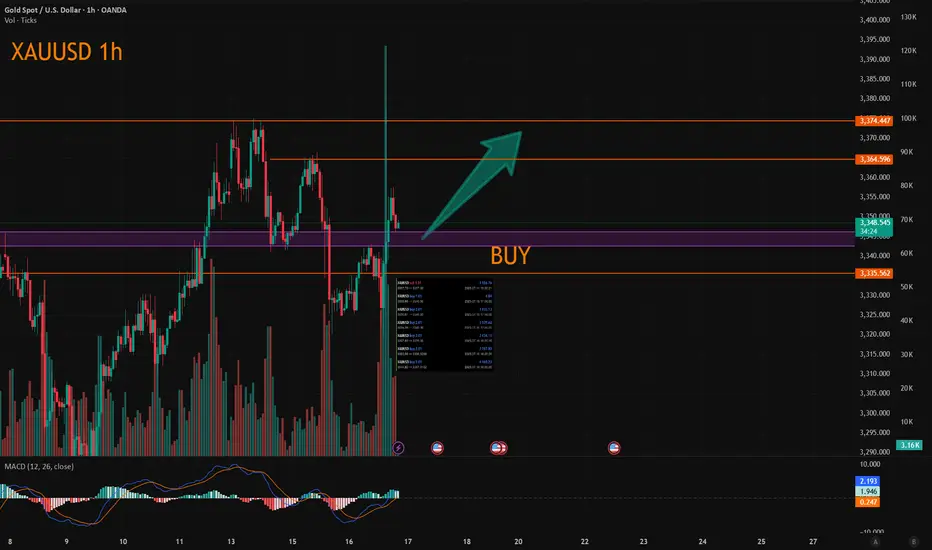
GOLD LONG SETUP Gold Bullish Long Setup
Startegy : FVG + MSS + BUY STRUCTURE
Where To Buy ?
3329 - 3320 Area FVG Buy
Targets : 3350 , 3355, 3360
Stop Loss Previous Low
Goldlong
XAUUSD:Go long
Based on the 4-hour analysis, the short-term support below for today remains focused on the area around 3318-25, while the short-term resistance above focuses on the 3340-45 level. The key resistance above is at 3380. Overall, this range remains the main framework for our participation in the trade, with positions generally being cautious and waiting for key levels to enter. I will provide specific trading strategies during the session, so please stay tuned. Given that the current market has retraced to 3325 and then rebounded, we can go long in the 3325-30 range.
Trading Strategy:
BUY@3325-30
TP:3340-45
More detailed strategies and trading will be notified here ↗↗↗
Keep updated, come to "get" ↗↗↗
Treat it as a long-short wash-out shock, and go long on pullback📰 News information:
1. Initial jobless claims data
2. June retail data
3. Beware of Trump's remarks about firing Powell
📈 Technical Analysis:
Last night, the daily line closed at around 3347. The current short-term daily line range is 3355-3300. The short-term support below is still 3320. Once it falls below 3320, it will look to 3310-3300. Short-term trading is still volatile. If the intraday retracement reaches 3320-3310, consider going long, and the defense is 3300, with the target at 3340-3350. Under the current rhythm of long and short wash, don't chase the rise and sell the fall, look at it rationally, and brothers who trade independently must bring SL.
🎯 Trading Points:
BUY 3320-3310
TP 3340-3350
In addition to investment, life also includes poetry, distant places, and Allen. Facing the market is actually facing yourself, correcting your shortcomings, facing your mistakes, and exercising strict self-discipline. I share free trading strategies and analysis ideas every day for reference by brothers. I hope my analysis can help you.
FXOPEN:XAUUSD OANDA:XAUUSD FX:XAUUSD FOREXCOM:XAUUSD PEPPERSTONE:XAUUSD TVC:GOLD
Trump's five major factors! Will gold continue to rise?The past six months may have been dizzying, but a clear theme has emerged since U.S. President Donald Trump returned to the White House: It’s good news for the gold market.
Although gold prices broke through $3,500 an ounce nearly three months ago, setting a new record high, five key factors that have emerged since the start of Trump’s second term are likely to continue to support gold prices in the coming months. These factors may even prove that the precious metal is becoming a core asset class in investors’ portfolio strategies.
David Miller, co-founder and chief investment officer of Catalyst Funds, said that as the market enters the third quarter, gold remains a standout asset class that “provides both a hedge against the potential risks of geopolitical conflict and a break from the erosion of fiat currencies.”
The first key factor supporting gold is demand from central banks, which indicates that the market has weakened confidence in the U.S. dollar. Miller pointed out in emailed comments that central bank demand is surging, and the BRICS countries, especially China and India, are accelerating the accumulation of gold reserves “as part of a broader de-dollarization strategy.” According to a report released by the World Gold Council on Wednesday, the People’s Bank of China’s official gold holdings have climbed for eight consecutive months.
David Russell, head of global market strategy at TradeStation, said the global tariffs threatened and implemented by Trump have accelerated the "de-dollarization process." De-dollarization refers to efforts by some countries to reduce their reliance on the U.S. dollar as a reserve currency.
"Trade is becoming less dependent on the U.S. end market and less dependent on the dollar. This is more like the 19th century than the era after World War I and World War II," Russell said in emailed comments. "This trend back to the old model is creating structural demand for gold after decades of neglect. Fiat currencies are in decline," he added.
Russell also said the decline in the credit quality of developed country governments, such as the United States, is also a major concern for the market. "We have lost our AAA rating from the three major rating agencies because of growing deficits and looming pressure on unfunded liabilities such as Social Security," he said, referring in part to Moody's downgrading its top credit rating for the United States in May. "After decades of procrastination, we are running out of ways to go."
That said, trade policy is a third factor affecting gold. Russell said that "large budget deficits or increased tariffs" would reduce demand for U.S. Treasuries, supporting gold prices.
With both 2-year and 10-year Treasury yields falling so far this year and real rates under pressure from inflation, "the opportunity cost of holding gold is falling," noted Catalyst Funds' Miller. That's leading to a fourth potential support for gold -- a resurgent interest in gold exchange-traded funds and other alternatives.
In the first half of 2025, North America led the growth in global gold ETF inflows, according to the World Gold Council. Global physically-backed gold ETFs saw inflows of $38 billion in the first half of this year, marking the strongest half-year performance since the first half of 2020, according to the World Gold Council.
Finally, from a technical perspective, gold prices have held above $3,250 an ounce for much of June, Miller said. That shows signs of "a potential breakout as equity market volatility returns," he said. Gold for August delivery closed at $3,359.10 an ounce on Wednesday.
“Gold is not just a crisis hedge, it is becoming a core asset class in modern portfolio strategies.” Miller said that the current macroeconomic environment “justifies a meaningful allocation to gold and gold-related strategies.”
He said: “The combination of fragile stock market sentiment, uncertain policy direction and structural macro headwinds reinforces our view that gold is not just a crisis hedge, it is becoming a core asset class in modern portfolio strategies.” PEPPERSTONE:XAUUSD ACTIVTRADES:GOLD ICMARKETS:XAUUSD ACTIVTRADES:GOLD EIGHTCAP:XAUUSD VELOCITY:GOLD

Gold Continues Short Term Uptrend📊 Market Overview:
💬Gold is currently trading around $3,340 – $3,352/oz, down slightly (~0.25%) on the day but still consolidating near recent highs around $3,500.
🌍 Geopolitical tensions (trade wars, Middle East conflicts) and strong central bank gold purchases continue to support long-term demand.
📅Markets are awaiting key U.S. inflation data and Fed signals, which may trigger volatility in the short term.
📉 Technical Analysis:
🔺Key resistance: $3,360 – $3,380, with the psychological zone at $3,400–$3,420.
🔻Nearest support: $3,330 – $3,332, followed by a firmer zone at $3,300–$3,326 (based on Fibonacci and moving averages).
• EMA/MA:
✅ Price is trading above the 50-day MA ($2,862), confirming a medium-term uptrend.
⚠️ While no specific EMA 09 data is noted, current price action suggests bullish momentum.
• Momentum / Candlestick / Volume:
📏RSI (14) is near 50–55, signaling positive momentum without being overbought.
🔄MACD is slightly negative but the overall structure remains bullish.
📌 Outlook:
Gold may continue to rise in the short term if it holds above the $3,330–$3,332 support zone, with potential to test resistance at $3,360–$3,380 and possibly revisit the $3,400 level.
A break below $3,330 could open the path toward deeper support around $3,300.
💡 Suggested Trading Strategy:
SELL XAU/USD: 3,367–3,370
🎯 TP: 40/80/200 pips
❌ SL: 3,374
BUY XAU/USD: 3,330–3,333
🎯 TP: 40/80/200 pips
❌ SL: 3,326
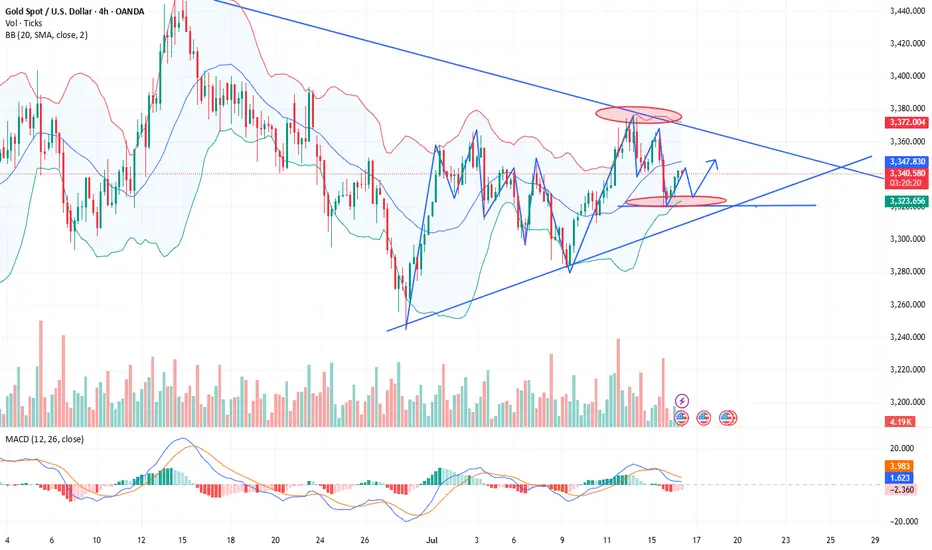
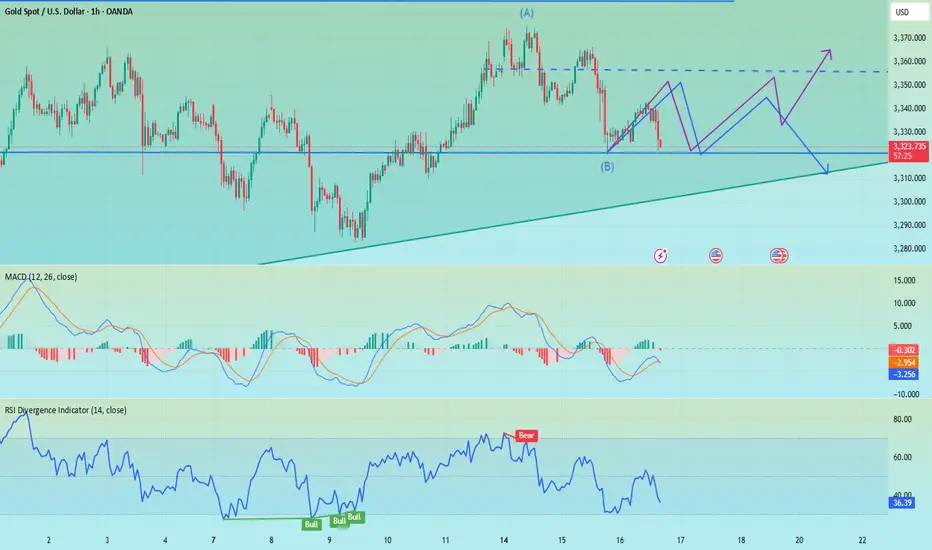
XAUUSD LONG 7/7/25Looking to target 3,450 price level. This is based on:
1. Price has been on a range since April 22 when the high was formed, the low of the move
that formed the high was taken out. Looking to aim to taking out the high.
2. On the weekly timeframe, last week took out the low of the week before and closed bullish
within the candle of the prior week. This provides a signal for a potential sweep of the high
of that week. Minimum 3,365 price level.

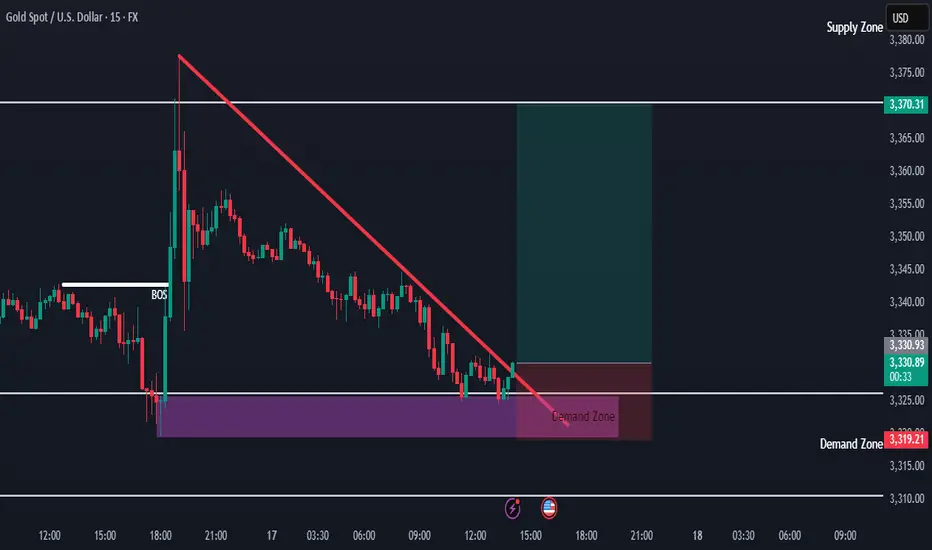
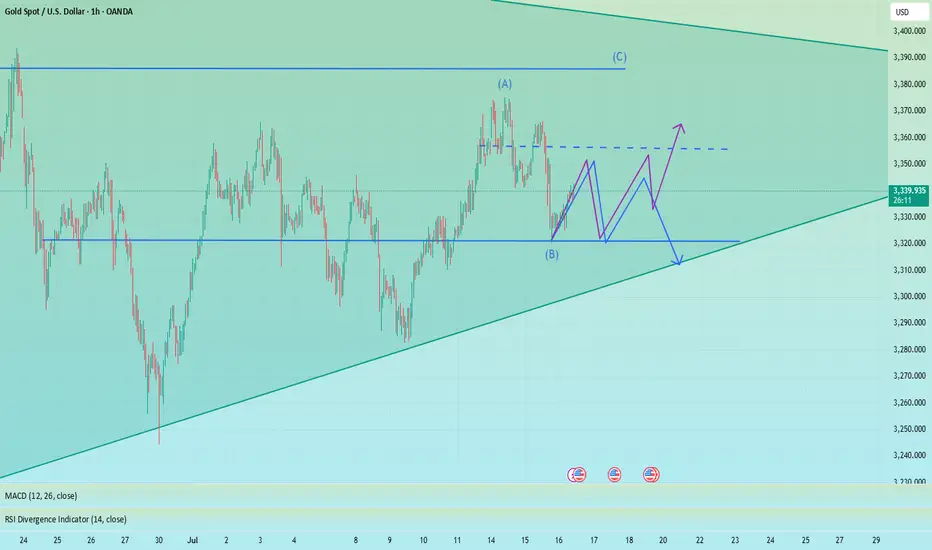
Gold Ranging Between HTF Zones — Buy Setup FormingHello everybody!
Price is fluctuating between two higher timeframe supply and demand areas.
The market structure on the lower timeframes changed yesterday, and now we’re watching to see if the newly formed small demand zone will hold.
The break of the downward trendline is our signal to enter a buy position.
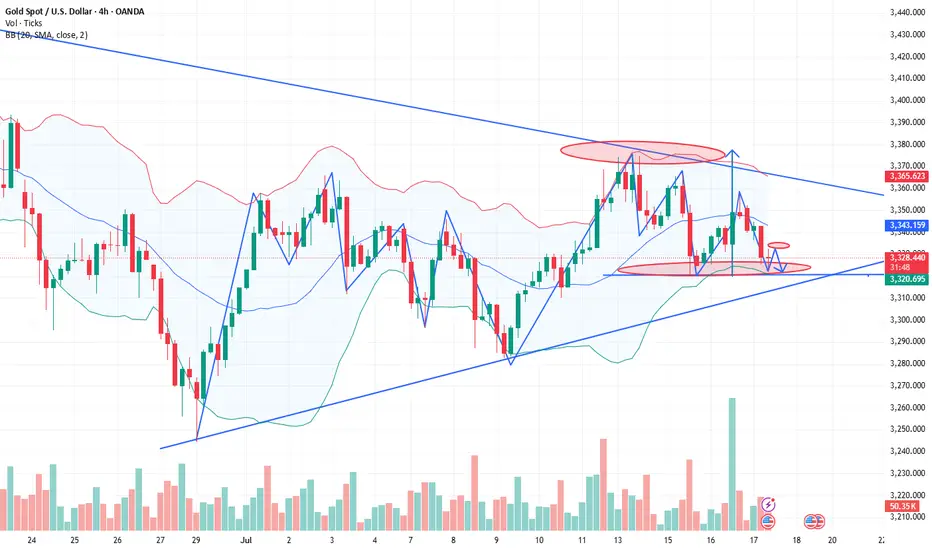
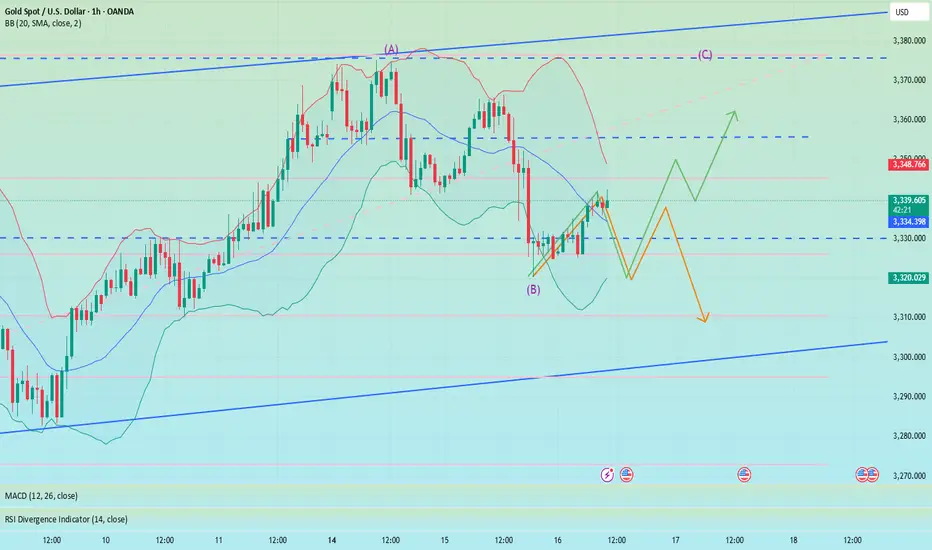
Gold market price trend analysis and operation strategyGold trend analysis:
Gold reached a high of 3366 yesterday, a low of 3320, and closed at around 3325. From the daily chart, the performance of the daily cycle is high and closed negative, and it may not be able to go out of the big rise in the short term. Gold will fall into range fluctuations. The rise of gold in this cycle has not actually been completed. At least it needs to go to the high point of 3400, and then look at the adjustment space within the week, but don’t look too much at the strength of the rise. The general trend is bullish, and we must also beware of the adjustment space that may fall back at any time. Gold tried 3375 several times yesterday and failed to break through, and then fell back for adjustment, indicating that the pressure on 3375 is obvious, that is, gold needs to fall back and correct in the short term. At this time, we are cautious about chasing more and continue to buy more after falling back.
From the 4-hour chart, gold rose and fell yesterday, and the bearish trend did not continue. Gold entered a period of adjustment. From the current K-line, the downward momentum of gold is slowing down, and it tends to rebound in the short term. In the 4-hour chart, the lower track support of the Bollinger Band is near 3320, and the position of the middle track of the Bollinger Band is near 3345, which will form a short-term resistance. From the 1-hour chart, after yesterday's drop to 3320, it was strongly supported again and pulled up to above 3330. The support below is still strong. If the European session rises and breaks through 3350 today, the US session may go to the resistance of 3365-3375. Before breaking through 3350, the current market can only be regarded as a bottom adjustment and correction. Today, we will first focus on the rebound strength. If the upward momentum weakens, pay attention to the support of 3310-3300 below, and wait for the decline to be mainly low-multiple. In the short term, we will first focus on the breakthrough of the shock range. The intraday idea is to fall back to low-multiple. FX:XAUUSD ACTIVTRADES:GOLD OANDA:XAUUSD TVC:GOLD EIGHTCAP:XAUUSD ACTIVTRADES:GOLD
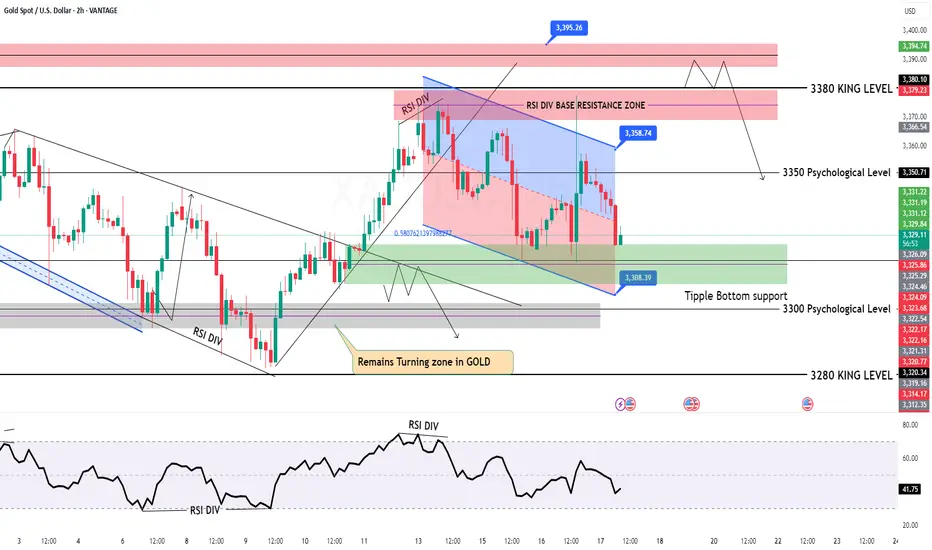
Gold rebounded and shorted in the New York market.Trump's recent remarks about "possibly firing Fed Chairman Powell" triggered risk aversion in the market, and gold once surged to $3,377, but then Trump denied the plan and gold prices fell back to fluctuate in the 3,340-3,350 range; the U.S. PPI in June was flat month-on-month, lower than expected, easing market concerns about the Fed's immediate tightening of policy, but long-term inflation expectations still support gold; Israel's air strikes on Syria have exacerbated tensions in the Middle East, and safe-haven demand has boosted gold; Trump threatens to impose tariffs on the EU, and global trade uncertainty still supports gold's safe-haven properties; gold fluctuated and fell today. After yesterday's big rise, gold gradually fell today. Today, gold fluctuated weakly, and the 4-hour moving average crossed downward. The gold price gradually moved toward the lower Bollinger band, and the Bollinger band opened downward. The trend is more bearish. In terms of operation, we recommend that gold rebound and go short. FOREXCOM:XAUUSD ACTIVTRADES:GOLD FXOPEN:XAUUSD ACTIVTRADES:GOLD VANTAGE:XAUUSD CMCMARKETS:GOLD VANTAGE:XAUUSD
GOLD Intraday Chart Update For 17 July 2025Hello Traders, welcome to new Trading day
Today we have some high impact news of USD, Currently market is still in tight range and we still need breakout of 3300 Psychological for downside clearly
For upside market must need to close above 3380-90 zone for further upwards continuation
currently we are also keep an eyes on WAR Fundamental news
Disclaimer: Forex is Risky
Gold Trade Setup Eyes on 15M Demand ZonePrice is coming close to 3338, where we have a 15-Minute Order Block (OB) 📍. This is a fresh demand zone and can give a bullish reaction when price taps into it 🟢.
📌 Plan:
We will wait for price to tap the OB ✅
If we see bullish signs like rejection wicks or bullish candles, we will enter a buy 📈
Our target will be near 3366, just below the bearish FVG 🎯

xauusd:Going long can lead to making money.
This week and last week, we have been continuously recommending a bullish position. There is no doubt that you love trading. Welcome!
Falling correction, shorting in European session📰 News information:
1. Beige Book of Federal Reserve's economic situation
2. European and American tariff trade negotiations
📈 Technical Analysis:
Currently, gold continues to consolidate around 3340, and the daily MACD indicator is stuck to the zero axis. Two consecutive days of negative bars also indicate that the overall trend of gold is weak and volatile. The hourly Bollinger Bands are closing, with the upper band located near 3352. The corresponding positions of the upper pressure middle band and SMA60 are basically at 3335-3350, but it is expected to gradually decline over time. On the whole, there are no particularly clear trading signals at present. Both bulls and bears have certain opportunities. It is recommended to wait and see for the time being. Pay attention to the 3342-3352 area above. If the bearish trend is confirmed in the future, you can consider shorting when it rebounds here, with the target at 3330-3325. If gold retreats directly to 3325-3320 and gains effective support again, you can consider going long.
🎯 Trading Points:
SELL 3342-3352
TP 3330-3325
BUY 3325-3320
TP 3340-3350
In addition to investment, life also includes poetry, distant places, and Allen. Facing the market is actually facing yourself, correcting your shortcomings, facing your mistakes, and exercising strict self-discipline. I share free trading strategies and analysis ideas every day for reference by brothers. I hope my analysis can help you.
FXOPEN:XAUUSD TVC:GOLD FX:XAUUSD FOREXCOM:XAUUSD PEPPERSTONE:XAUUSD OANDA:XAUUSD
Pay attention to 3320, if it falls below, go long at 3310-3300The short order has been completed and profit has been realized. Now the 1H technical indicators show that there is still room for decline in the short term. Focus on the 3320 support. If it falls below 3320, the gold price is expected to reach the 3310-3300 area, which is also an ideal trading area for intraday long positions. There is nothing much to say. Follow the wolves and you will get meat. Currently, the brothers who follow me to trade have all made good gains.
OANDA:XAUUSD
The rebound is not a reversal, continue to shortGold showed a trend of rising and falling back and closing low on Tuesday. The highest intraday rise was 3366, and the lowest fell to 3320. The daily line recorded a medium-sized Yin line with a long upper shadow. The K-line was negative, and the closing line broke the resonance support of the middle track and the short-term moving average, suggesting that the bullish momentum has slowed down and the bears are ready to move. Today, we need to pay attention to the further downward performance of gold. From the 4H level, the price stood firm at the four-hour resistance position last Thursday, and then rebounded upward in the short term. Yesterday, the price fell below the daily support level. Currently, the short-term market is bearish, and attention is paid to the resistance in the 3340-3345 range above. In the one-hour period, the price is in short-term shock adjustment. On the whole, it will be treated as a shock decline before breaking yesterday's low, and the lower side pays attention to the 3225-3320 area support. In the short term, you can consider shorting at 3340-3350 in the European session, and look towards 3330-3320
OANDA:XAUUSD
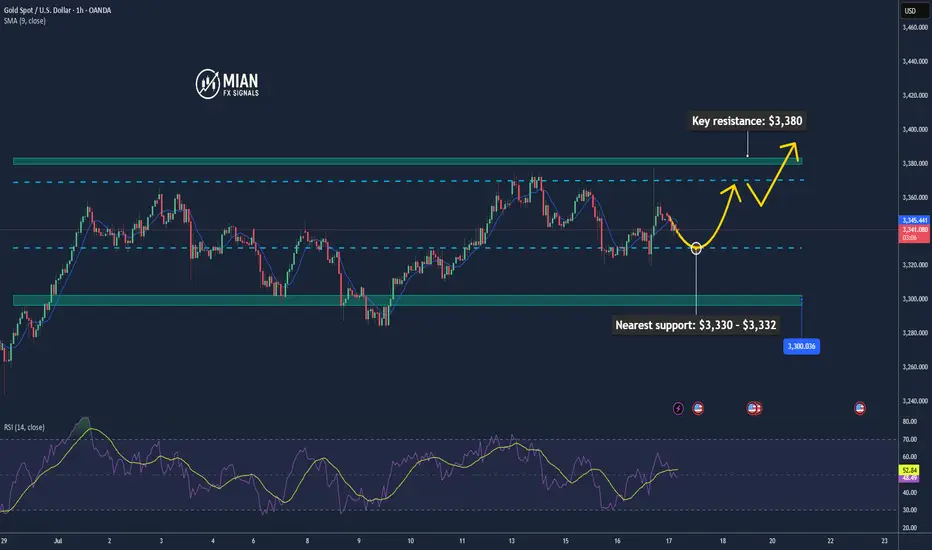
Gold Holds Key Support Zone📊 Market Summary
– Gold is currently trading at $3,338/oz, hovering near a key technical support level.
– US Treasury yields remain elevated and the USD is strong, both pressuring gold; however, ongoing concerns over US–EU/Mexico trade tensions continue to support safe-haven demand.
– The market is awaiting the upcoming US PPI data to determine the next directional move.
📉 Technical Analysis
• Key Resistance: $3,372 – $3,375 (23.6% Fibonacci zone – short-term ceiling)
• Nearest Support: $3,338 – $3,330 (tested and bounced at 3,338 per Oanda); deeper support at $3,325 – $3,320 if broken
• EMA 9: Price is below the MA20/50/100 but above MA200 (H1); EMA9 is flat, suggesting a sideways/consolidation trend
• Momentum / Indicators:
• RSI around 44–52 – neutral to slightly bullish
• MACD slightly positive; Stochastic above 50, hinting at short-term overbought conditions
📌 Outlook
– Gold is holding above the 3,338–3,330 support zone. If this level holds and rate-cut expectations strengthen, the price may rebound toward 3,372–3,375.
– However, if the USD continues to strengthen and PPI/CPI data surprises to the upside, gold could break support and head lower toward 3,325–3,320.
💡 Trade Strategy Proposal
🟣 SELL XAU/USD at 3,372 – 3,375
🎯 TP: ~ 40 / 80 / 200 pips
❌ SL: ~ 3,378
🟢 BUY XAU/USD at 3,330 – 3,333
🎯 TP: ~ 40 / 80 / 200 pips
❌ SL: ~ 3,327

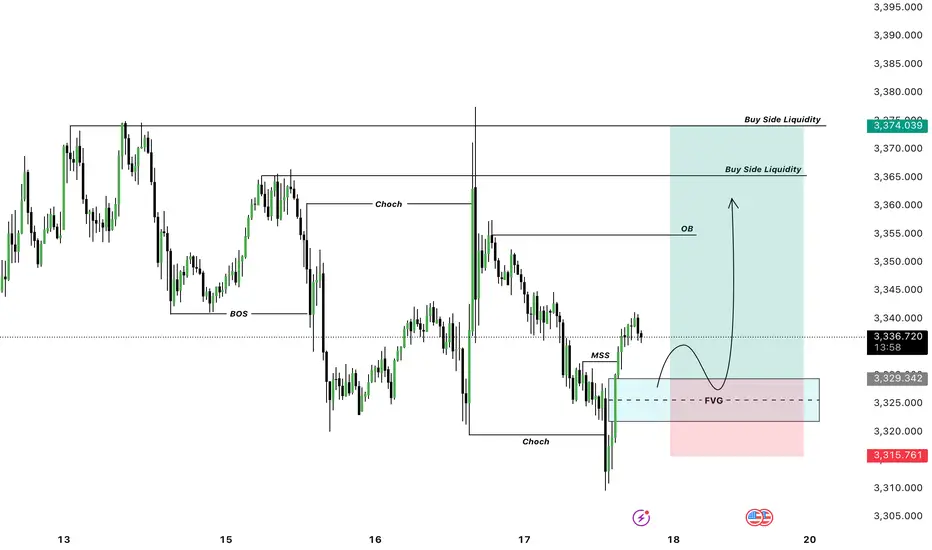
Gold Bullish Momentum
📈 XAU/USD Gold Technical Analysis – Smart Money Concept Perspective
🕒 Timeframe: 1H | Date: July 16, 2025
Overview:
This analysis follows a Smart Money Concept (SMC) framework, focusing on market structure shifts, liquidity zones, and potential high-probability setups. Gold (XAU/USD) is showing signs of a possible bullish reversal after forming a clear accumulation zone near a significant low.
Key Highlights:
🔹 BOS (Break of Structure):
A bullish break of structure confirms a shift in momentum, indicating that the prior bearish trend might be weakening.
🔹 LL (Lower Low) and LH (Lower High):
The market previously formed a Lower Low, followed by a Lower High, maintaining bearish structure until the recent BOS occurred.
🔹 Accumulation Phase:
Price is consolidating in a defined accumulation range, suggesting smart money might be absorbing liquidity before a move higher. This zone may serve as the springboard for the next bullish leg.
🔹 Inducement:
An inducement zone lies just below the trendline support and accumulation range. It’s designed to trap early sellers before a bullish continuation.
🔹 POI (Point of Interest):
A key supply or mitigation zone lies around the $3,355.75 level. We expect price to move into this POI before reacting.
🔹 Target:
If price successfully clears the POI and confirms strength, the projected target is in the $3,375–$3,380 zone based on confluence from upper channel resistance and previous structure.
🔄 Forecast Path:
Short-Term Pullback: Price may dip slightly to mitigate the inducement zone near trendline support.
Bullish Breakout: Strong impulse toward POI.
Reaction from POI: Potential minor retracement before a continuation toward the target.
🧠 Market Psychology Insight:
This setup reflects smart money accumulation and manipulation at its core — inducing retail traders into short positions before a potential bullish move. Watch for confirmations like bullish engulfing candles or break of lower highs on smaller timeframes.
📌 Conclusion:
Gold is poised for a possible bullish move after showing accumulation and breaking bearish structure. The $3,328–$3,335 range is key for entries, with the $3,355 POI and $3,375+ as targets. Manage risk and wait for confirmation before entering trades.
💬 Let me know your thoughts or drop your own chart ideas below!
📊 #XAUUSD #Gold #SmartMoney #TradingView #Forex #TechnicalAnalysis #SMC #PriceAction

Gold Buy Plan - 16 July 2025📌 Gold Buy Plan - 16 July 2025
Timeframe: H4
Bias: Bullish
Structure: Market has formed bullish FVGs and is respecting demand zones.
🔍 Key Zones:
Demand Zone: 3,314 - 3,325 (Blue Zone)
Entry Range: Price expected to dip into demand zone before rally
Current Price: 3,343.52
Liquidity Target 1: 3,393.46
Liquidity Target 2: 3,451.19 (Final target / magnet area)
✅ Buy Setup Plan:
Wait for retracement:
Let price dip into the demand zone around 3,320–3,325.
Entry Trigger:
Look for:
Rejection candle in H1 or M30
Break of structure or bullish FVG formation
Engulfing candle from the demand zone
Buy Entry:
Around 3,320 ± few points (inside demand zone)
Stop Loss:
Below the demand zone: around 3,305
Take Profit Targets:
TP1: 3,393 (liquidity level)
TP2: 3,451 (magnet zone)
Risk to Reward:
From 3,320 to 3,451 → approx. 1:4 RRR
⚠️ Conditions to Invalidate Buy Plan:
If price closes H4 candle below 3,305, plan is invalid.
If price forms a bearish FVG after liquidity sweep, re-evaluate.

Gold (XAU/USD) Trading Analysis for July 16Support Zone: The market has found support around the 0.5 Fibonacci retracement level at 3,333.58. This could be a potential entry point for a long trade if the price bounces here.
Resistance Zone: The price action is approaching the 3,345.18 level, with a strong resistance around that zone. If the price breaks above this resistance, we could see further upward movement.
Price Action: We can observe an initial bullish movement followed by a correction. The price is currently in an uptrend, forming a series of higher lows and higher highs.
Fibonacci Levels: The 0.5 level at 3,333.58 has already acted as a support zone, and if the price retraces back here, this could be a good opportunity to enter long positions. The 0.618 level at 3,336.32 serves as a key resistance point. If price breaks above this level, it could indicate a continuation of the bullish trend.
Bullish Scenario (Long Entry): If the price retraces back to the 3,333.58 area (0.5 Fibonacci level) and shows signs of support (such as bullish candlestick patterns), consider entering long with a target at 3,345.18.
Bearish Scenario (Short Entry): If the price fails to break above 3,345.18 and forms a reversal pattern, you could consider shorting with a target near 3,320.
Risk Management:
Stop Loss: Place a stop loss just below 3,330, allowing for a small margin of error in case the price breaks through the support level.
Take Profit: Consider setting a take-profit at 3,345.18 for short-term moves or look for further price action if you're aiming for a longer-term trend.
Reminder: Always monitor the price action closely and adjust stop losses accordingly. The market is subject to volatility, especially during high-impact news events, so make sure to stay updated.

Gold XAU/USD Analysis for July 15, 2025: Trading Strategy and KeThe market is showing a strong upward trend, as indicated by the yellow trendline.
Fibonacci Retracement Levels:
38.2% Fibonacci Level: 3,344.79
50% Fibonacci Level: 3,344.47
61.8% Fibonacci Level: 3,347.91
Resistance Zone: The price is approaching a strong resistance level at 3,370 USD.
Technical Observations:
Gold is currently moving upward but is encountering resistance at 3,361. The price tested the 61.8% Fibonacci level and is now facing some resistance.
The Fibonacci levels suggest that if the price breaks above 3,362, the next target could be 3,370 USD.
Support Zone: If the price retraces, support may emerge near the 3,340 region.
Gold XAU/USD Trading Strategy:
Bullish Scenario:
If the price breaks above resistance at 3,362, the next target would be the 3,370 level. This could be a signal to enter Long positions near the 3,344 to 3,348 range, with a target around 3,370.
Bearish Scenario:
A retracement to the support level at 3,340 is possible. If the price drops below 3,340, further downside could be expected. In this case, a Short position could be considered if the price falls below 3,340, with a target near 3,330.
With the current upward trend, gold XAU/USD may continue to rise if it breaks the 3,362 resistance level, with the next target being 3,370 USD. However, if the price turns lower and drops below the 3,340 support level, the market may continue to decline.
Note: Be sure to monitor the Fibonacci levels and price behavior closely to adjust your trading strategy accordingly for today. If this analysis was helpful, don't forget to save it and follow for more trading strategies!

Gold Price Analysis Bullish Continuation PossibleBullish Trend Formation: We see a series of higher highs and higher lows forming on the chart, suggesting a potential continuation of the bullish trend. However, the market has recently pulled back from the previous peak at 3,340.69, which is now being tested as support.
Fibonacci Retracement Analysis:
The current pullback has reached the 0.5 level around 3,334.32, a strong support zone. This area could offer a potential long entry if the price reacts positively from here.
The 0.618 Fibonacci level at 3,335.82 is also significant, often acting as a final retracement level before the market continues its bullish move.
Support Testing: If the price holds above the 0.618 level, we could expect a price rally towards the resistance at 3,372.00, with possible extension above it.
Trend Continuation: If the price breaks below 3,335.82, consider watching for further downside potential with the next target being the 0.5 level, near 3,334.32.
Trade Strategy (Buy on Support):
Entry: Around 3,334.32 or 3,335.82 (depending on price action confirmation).
Target: 3,340.69 (next resistance zone).
Stop-Loss: Set just below the 0.5 Fibonacci level around 3,327.95 to manage risk effectively.
The current chart is showing a potential for a bullish continuation, with key support levels at 3,335.82 and 3,334.32, backed by Fibonacci retracement. Watching the price action around these levels will be crucial for entering a potential buy position.
Remember to adjust your strategy based on the actual market movements and confirm the trend with price action before making a trade.

Public short selling profit, NY short-term multiple layoutInterest rate futures data showed that the results were in line with our previous expectations, with a lower rate cut this month and a higher probability of a 25 basis point cut in September. In the short term, gold may first take profits and then rebound. NY session trading has just begun. Bros can pay attention to the 3335-3330 area below. If it falls back and stabilizes, you can consider participating in long positions, defending 3325 and targeting 3355-3365.
OANDA:XAUUSD

XAU/USD(20250716) Today's AnalysisMarket news:
Sources said that after Trump's latest trade tax threat, the European Central Bank will discuss a more negative scenario next week than expected in June. The ECB is still expected to keep interest rates unchanged at its meeting on July 24. Discussions on rate cuts are still postponed to September.
Technical analysis:
Today's buying and selling boundaries:
3353.05
Support and resistance levels:
3386.70
3374.12
3365.96
3340.13
3331.97
3319.40
Trading strategy:
If it breaks through 3353.05, consider buying in, the first target price is 3365.96
If it breaks through 3340.13, consider selling in, the first target price is 3331.97
