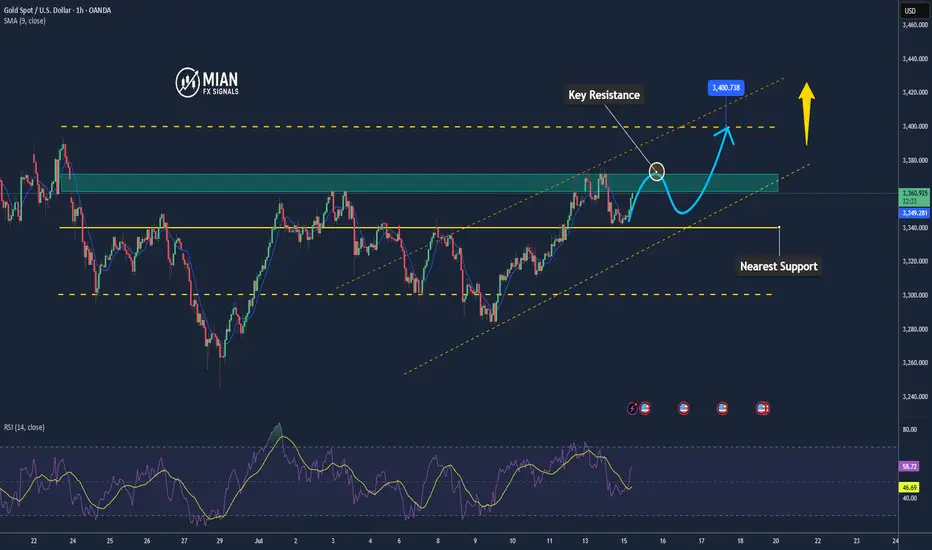
Gold Likely to Extend Gains as USD Weakens, but Faces Resistance📊 Market Move:
Gold surged to a three-week high near $3,370/oz, driven by safe-haven demand amid renewed trade tensions between the U.S. and EU/Mexico and threats of a 100% tariff on Russian imports.
Investors are now focused on upcoming U.S. CPI data, which could trigger sharp moves if inflation comes in below expectations.
📉 Technical Analysis:
• Key Resistance: ~$3,365–$3,372; a breakout could open the way to $3,400–$3,440
• Nearest Support: ~$3,340 (S1), then ~$3,326 (SMA50), and deeper at $3,300–$3,320 (Fibonacci zone)
• EMA: Price remains above short-term EMAs (20/50/100), suggesting a continuing bullish bias
• Candlesticks / Volume / Momentum:
• RSI is neutral-to-bullish around 54; MACD shows strengthening bullish momentum
• Bollinger Bands are narrowing, signaling potential for a breakout
📌 Outlook:
Gold may continue edging higher or consolidate around the $3,365–$3,372 resistance zone if no new geopolitical shocks occur. However, if U.S. CPI comes in below expectations or if USD/Yields weaken, gold could rally further toward $3,400–$3,440.
________________________________________
💡 Suggested Trading Strategy
🔻 SELL XAU/USD at: $3,370–3,373
🎯 TP: 40/80/200 pips
❌ SL: $3,376
🔺 BUY XAU/USD at: $3,340–3,337
🎯 TP: 40/80/200 pips
❌ SL: $3,334
Goldlong
XAUUSD:Continue to go long
The gold price has just fallen after being pressured by the 3365 level. Currently, there are no obvious signs of a bottoming out. However, the 3340-43 range is the support position from the previous several declines. Here, one can lightly participate in the bullish orders. If going further down, the 3330 level is an important support point. Both of these positions can be utilized to go long.
Then the trading strategy:
BUY@3340-43
TP:3360-65
If the price retraces to the 3330 level, increase the position of the long bet. The goal remains the same. I will keep you informed if there are any changes.
More detailed strategies and trading will be notified here ↗↗↗
Keep updated, come to "get" ↗↗↗
XAUUSD:Today's trading strategies for buying and selling
The gold price reached a peak of 3374.69 during the Asian trading session. Overall, it remains in a bullish uptrend. From the half-hour and hourly charts, the 30-day line provides support at around 3353. Therefore, when trading within this fluctuating range, it is important to note that in a situation where the bullish trend is strong, short selling should be conducted with a light position.
Trading Strategy:
BUY@3353-57
TP:3370-75
SELL@3375-80
TP:3360-63
More detailed strategies and trading will be notified here ↗↗↗
Keep updated, come to "get" ↗↗↗
Gold Aiming Higher: Bullish Momentum Toward Key S&D ZoneHello guys!
The main bullish trend remains intact on Gold. After forming a solid base near the QML level, price has been respecting the ascending channel structure and is now pushing toward the upper boundary of that channel.
The current price action shows strength and momentum, and with the recent breakout above the midline of the channel, it signals that buyers are likely to push price toward the next key area of interest.
The target is clearly defined: the supply zone around 3409–3423, which has previously acted as a major resistance area.
Core idea:
Main trend: Bullish
Structure: Ascending channel
Support confirmed: QML zone bounce
Current behavior: Price moving along the top of the channel
Target: 3409–3423 supply zone

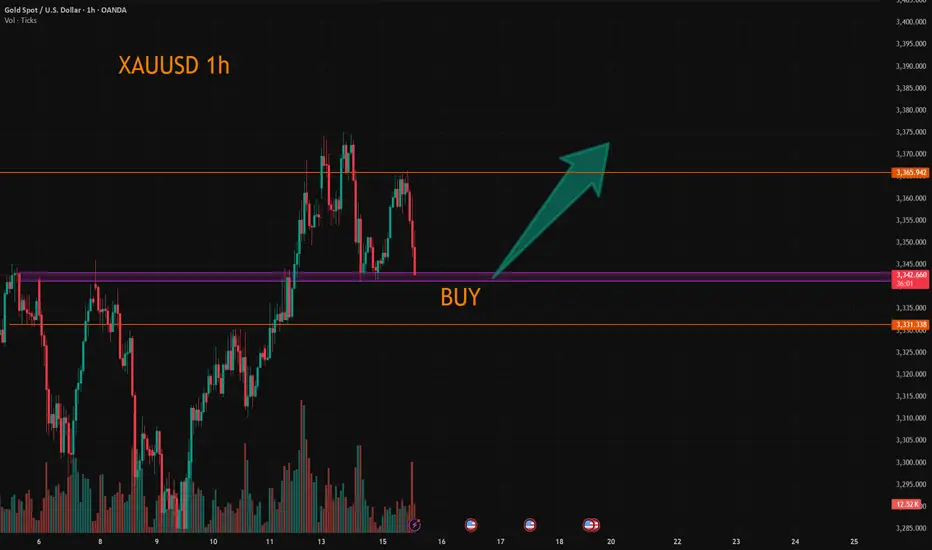
XAUUSD Trade Plan | 15 July 2025After observing the recent low breakdown and a clear liquidity grab, we saw a strong direction confirmation breakout. This suggests that the market is likely to continue its upward momentum.
🔄 Breakdown/Seller Trap triggered the reversal
🔹 Last Important Low respected
📈 Breakout confirms bullish direction
✅ Plan:
I’ll be watching for a pullback into the grey demand zone (highlighted area) for a potential long entry.
🕵️♂️ No FOMO — I’ll only enter after price shows clear bullish behavior in this zone.
🎯 Target: 3,365.89 resistance
📍 Entry Zone: Grey box (based on previous structure)
Let me know your thoughts — are you also watching this zone?
#XAUUSD #GoldAnalysis #LiquidityGrab #SmartMoneyConcepts #PriceAction #TradingPlan #TradingView

XAU/USD(20250715) Today's AnalysisMarket news:
Sources said that after Trump's latest trade tax threat, the European Central Bank will discuss a more negative scenario next week than expected in June. The ECB is still expected to keep interest rates unchanged at its meeting on July 24. Discussions on rate cuts are still postponed to September.
Technical analysis:
Today's buying and selling boundaries:
3353.05
Support and resistance levels:
3386.70
3374.12
3365.96
3340.13
3331.97
3319.40
Trading strategy:
If it breaks through 3353.05, consider buying in, the first target price is 3365.96
If it breaks through 3340.13, consider selling in, the first target price is 3331.97

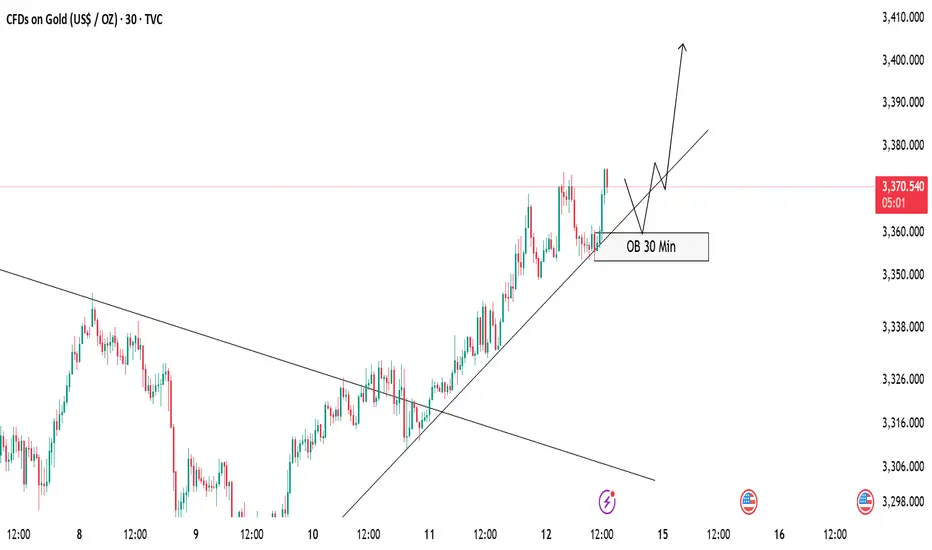
GOLD Buy Setup – OB Zone in FocusCurrently, gold is respecting the ascending trendline and maintaining a bullish structure 🟢. Price hasn’t tapped into the 30 Min Order Block (OB) yet, but we are expecting a potential pullback into this OB zone 📍.
✅ Our Plan:
We will wait patiently for price to mitigate the OB.
After the tap, we will look for bullish confirmation (rejection wick, bullish engulfing, or break of minor structure) before entering a buy position 🚀.
As long as the trendline holds, we remain bullish on gold.
📝 Invalidation:
If price breaks and closes below the trendline and OB zone, we will stay out or re-evaluate the setup ❌.
Stay disciplined and follow the plan! 💪
Gold’s Chart Update Next Move: Bullish or Bearish?Gold has shown strong bullish momentum 💪 as it breaks through the descending trendline 📉, positioning itself to target the upper liquidity zone 💰. Right now, we have two key scenarios to watch:
1️⃣ Bullish Scenario: If Gold breaks above the 3345 level and closes a solid candle above it 🔝, we could see a move towards 3360 🚀, signaling further upward potential.
2️⃣ Bearish Scenario: However, if Gold sweeps the 3345 zone and fails to maintain the bullish momentum 🔻, we may see a pullback that could push prices lower 📉.
Stay vigilant 👀 and keep an eye on price action for the next big move! 🔍📊

Gold----Buy near 3348, target 3369-3389Gold market analysis:
Looking back at last week's market, the market performance on Monday and Tuesday last week was quite abnormal, belonging to the rhythm of a big oscillation. The following three trading days were basically relatively normal, and the market rose all the way after the buy-in. The overall market was a bottoming-out and rebounding market. Recently, investors are very confused about whether the general trend is bullish or bearish? First of all, we need to distinguish how long the general trend cycle is? If you look at the weekly line, you can at least see a 2-4 week trend. If you want to see a trend for a month, then you have to look at the weekly K-shaped and monthly trend. I understand that the long-term trend is at least a trend of one month to half a year. With the current instability of the international situation, the trend of Russia and Ukraine, the situation in the Middle East, and Trump's global tariff war, I think the half-year trend is bullish. We are short-term traders, and basically can't see that far. Looking at the trend of one week at most is the limit. Playing with long-term trends requires a 100-point mentality, and playing with short-term trends only requires technology. The first thing every Monday is to figure out the trend of the week. Buy short-term climb at the weekly close. This week's thinking is bullish first. We estimate that there will be a decline in the second half of the week. Today's weekly line is treated as a low-price buy first, and pay attention to the retracement to the support to buy. The low point of Friday's retracement near 3348 is a new support, and it is also the starting point of the pattern support 3344. In addition, the hourly stepping point is near 3342. If it does not break 3342 today, insist on buying. If it breaks, adjust the thinking to be bearish in time. A small step on the Asian session is also an opportunity to get on the train.
Pressure 3397, support 3348, 3345, 3342, the watershed of strength and weakness in the market is 3342.
Fundamental analysis:
Last week, Trump increased tariffs on Canada and will soon increase tariffs on Brazil. There is no signal of stopping the tariff war. It is long-term bullish for gold. The situation in the Middle East has not completely stopped, and it is also a long-term suppression of the US dollar to support gold.
Operation suggestion:
Gold----Buy near 3348, target 3369-3389

BTC/USDT HIDDEN PATTERN! SM, FIB AND MORE COMFIRMED!Price Resilience Amid Geopolitical Stress
Bitcoin demonstrated remarkable strength during the Israel-Iran conflict, briefly dipping to ~$98K but swiftly rebounding above $105K. This aligns with historical patterns where BTC initially sells off on geopolitical shocks but recovers aggressively within weeks, outperforming gold and equities by 15-60% post-crisis. There is a $96K-$94K "footprint" that coincided with institutional accumulation, evidenced by $1.37B in spot ETF inflows during the conflict week, led by BlackRock's IBIT ($240M single-day inflow) according to official information. This institutional backstop and many others might single-handedly prevented a deeper correction for now, remember that smart money psychology is to create cause out of thin air and buy during selling and indecisive times.
Critical Levels to Watch
Immediate Support: $108k area is vital. A sustained hold here maintains short-term bullish momentum. The 50-day SMA near $102.8K (tested during June 13 conflict sell-off) remains a macro support floor.
Resistance & Targets: The $112K ATH is the near-term ceiling. Breaking this requires stronger spot demand—currently, net exchange inflows are negative, indicating weak retail participation or traders that are backing off for now.There's a $120K target (0.618 Fib) aligned with Standard Chartered’s $150K year-end model if ETF inflows persist.
Risk Zones: A close below $108.3K risks a slide to $105K. Failure here opens path to $96K and a further break of this 92k to 96k zone could lead directly to 70k area or even lower if economical and social activities are not favorable in the near to medium future.Dominance above 55% (currently 65%) delays alt season, but a break below 60% could ignite alts in a positive way.
Macro Catalysts & Market Sentiment
Policy Tailwinds: Trump’s "One Big Beautiful Bill" (proposing $5T debt ceiling hike and U.S. strategic BTC reserves) could weaken the USD, boosting BTC’s "digital gold" narrative. DXY’s -9% YTD drop already correlates with BTC’s 54% post-election rally.
Fed Influence: Pressure to cut rates (amid cooling employment data) may accelerate institutional rotation into BTC. ETF inflows hit $2.75B in late June, signaling renewed institutional FOMO.
Geopolitical Cooling: Iran-Israel ceasefire talks reduced immediate panic, but residual volatility risk remains. Traders note BTC often rallies 20-40% within 60 days of conflict events.
Structural Challenges
Liquidity Fragility: Whale moves (for example: 10K BTC sell orders) now impact prices more due to ETF-driven liquidity concentration. Recent $98K flash crash exemplified this.
Regulatory Overhang: MiCA compliance costs in the EU and U.S. security-reclassification proposals could pressure smaller tokens, though BTC’s status appears secure 28.
Seasonal Slump: July historically sees 6.1% of annual crypto volume—low volatility may delay breakouts until August 4.
Strategic Outlook
A July breakout above $112K could ignite the next leg to $120K, but a retest of $107K-$105K is likely first. Altcoins remain subdued until BTC dominance breaks <55%—select projects with institutional backing (for example, ETF candidates) or real-world utility for asymmetric opportunities.
Conclusion: BTC’s resilience amid chaos confirms its institutional maturity. Trade the $108.3K-$112K range aggressively, with a break above ATH targeting $120K by September. Always hedge tail risks (escalations, regulatory shocks) in this volatility-rich asset class. While this great surge in institutional inflow is good for BTC it also indicates a reduction or slower pace of other crypto currencies.
This is my analysis for BTC, let me know what you think and I hope you like it!

Good opportunity to wait for recovery and buy GoldOANDA:XAUUSD Confirmation of breaking Key level 3330 on Friday has formed an Uptrend in Gold. Reaction at GAP 3368 is obvious in an uptrend. Gold trend is favoring buying to 3388 and 3400 next week.
Support: 3345-3331
Resistance: 3387-3400
BUY Trigger: Retest and Reject support 3345
BUY Trigger: 3331 ( Strong support zone)
Target: 3400
SELL Trigger: rejection 3387 with bearish confirmation
Leave your comments on the idea. I am happy to read your views.

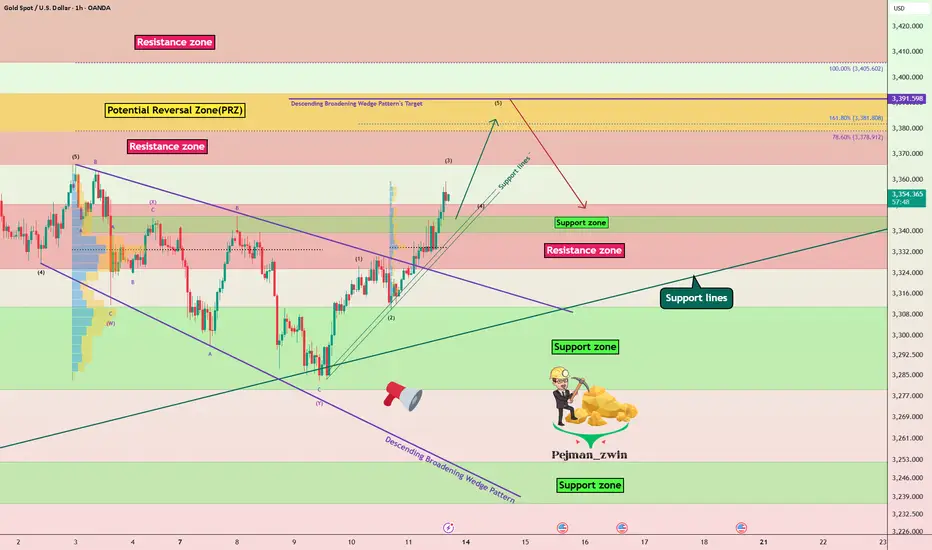
XUA/USD) Bullish Analysis Read The captionSMC trading point update
Technical analysis of Gold (XAU/USD) analysis on the 3-hour
---
Gold (XAU/USD) 3H Technical Analysis Summary
Market Structure: Bullish breakout
Price has successfully broken above both the downtrend line and the support zone (highlighted in yellow), signaling a shift in structure from bearish to bullish.
Key Support Zone:
The yellow zone (~3,335–3,355) was previously a resistance area. After the breakout, it is acting as a strong support level and has been retested.
Trendlines:
Downtrend line: Broken and retested.
Uptrend line: Guiding current price action, supporting higher lows and forming an ascending channel.
200 EMA (blue line):
Price is trading above the EMA 200 (~3,331), confirming bullish bias and providing dynamic support.
Momentum (RSI 14):
RSI is around 67.85, showing strong bullish momentum.
Nearing overbought, so a minor pullback or consolidation could occur before continuation.
Volume:
Increase in buying volume near breakout area suggests institutional interest or strong buyer conviction.
Mr SMC trading point
---
Conclusion:
Price has shifted into a bullish continuation pattern.
A successful break and retest of structure and trendlines increases the likelihood of further upside.
As long as price holds above the yellow support zone and the uptrend line, bullish momentum is favored.
Short-term pullbacks may offer new long opportunities.
---
Please support boost 🚀 this analysis)
XAUUSD Bullish Signal | Technical + Custom AlgoSmart Trend Signal | Technical Analysis + Custom Algorithm
This signal is the result of a combination of classic technical trend analysis and a proprietary software I personally developed.

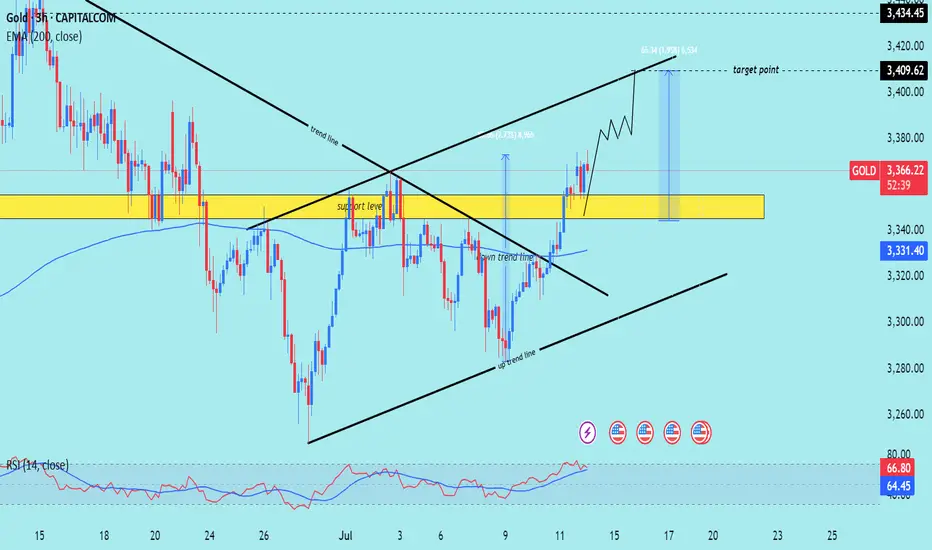
Gold Roadmap=>Short termGold ( OANDA:XAUUSD ) currently appears to have broken through the Resistance zone($3,350-$3,325) .
The Resistance zone($3,350-$3,325) was broken with the help of the Descending Broadening Wedge Pattern , the upper line of this classic pattern having served as an important resistance line for us in previous ideas .
In terms of Elliott wave theory , Gold has completed the Double Three Correction(WXY) within the Descending Broadening Wedge Pattern . It is currently completing the next five impulse waves . Wave 5 of these waves could end in the Potential Reversal Zone(PRZ) .
I expect Gold to rise to the Potential Reversal Zone(PRZ) , and of course, given the momentum of gold approaching PRZ , we can also look for Short positions in PRZ .
Note: Stop Loss (SL) = $3,329
Gold Analyze (XAUUSD), 1-hour time frame.
Be sure to follow the updated ideas.
Do not forget to put a Stop loss for your positions (For every position you want to open).
Please follow your strategy; this is just my idea, and I will gladly see your ideas in this post.
Please do not forget the ✅ ' like ' ✅ button 🙏😊 & Share it with your friends; thanks, and Trade safe.
Gold continues to rise after keeping low and breaking high
Last Thursday and Friday, I repeatedly mentioned the position of 3344 to my members. As a strong resistance position in the early stage, every time the price falls below the low point, the pressure to find the bottom and rebound is this area, and then continue to break the low under pressure. This time, we emphasize that breaking through and standing firmly on 3344 is the key. If it can break through and stand firmly, the next resistance is 3358, followed by 3373.
Now the price has broken upward as expected, completing the qualitative change. The next step is to look at the switching of space. Keep low and break high to see acceleration. After breaking the low point, consider sweeping.
Specific key points are expanded:
1. The daily line pattern is still closing and flat. The lifeline is the space switching point in the past one or two months, which will determine the subsequent market space rhythm. At present, the price has successfully broken through the lifeline and switched upward to enter the lifeline to the upper track. 3339-3396
Then, in the case of subsequent market holding the lifeline, maintain the upper range sweep, yes, it is still the rhythm of sweeping, just change the space
2. The four-hour pattern opens slightly upward, pointing to the upward direction
Starting from the lower track 3283 of the squat probe pattern, it has risen steadily. After repeatedly determining the lifeline position 3310 area, it will start to rise further and the pattern will open upward
The lifeline position coincides with the support 3330-3328 area repeatedly determined last Friday, and together they become the last defensive dividing line for the bulls to rise
3. The double-line interval 3330-3325 of the hourly chart has become a space switching area, which previously suppressed the price from falling further, and now it has turned into support, and will rely on the price to further rise Step up, pay attention to the role of the dividing line
4. Maintain the idea of switching with the same profit space, start from 3283 and calculate 3313, then 3328, then 3343, then 3358, and finally 3373, and then 3388, and 3403 (here needs to be highlighted)
5. As shown in the figure, the purple large channel range is swept, the space range is about 100-150 US dollars, this wave of increase is about 100 US dollars, and there is still room to pay attention to. The upper track of the channel overlaps with the upper track of the daily line pattern in the 3396-3400 area, and the 3403 position mentioned above together become the next space dividing line area
In summary, for the current gold, it is still in the rising stage, and the idea remains low and bullish. Pay attention to the process The intensity and amplitude of the adjustment can be squatted to gain leverage, or sideways for a period of time to gain space. Both are ways of correction. After the correction is completed, continue to be bullish and break through.
Referring to this idea, we gave a long position from 3358-3356 in the afternoon. As expected, it sprinted to 3375 as of press time. Those who keep positions should pay attention to the upward loss point, and then pay attention to further rise.
Of course, today's trend will be more tiring, so there is still an opportunity to step back and buy low. Pay attention to the 3364-3362 position to continue to buy low (aggressive 3366 can start), stop loss 3355, target 3380-3388
Another extreme sweep needs to pay attention to the 3342-3339 and 3330-3328 areas. This needs to be determined according to the situation. Pay attention to 3388 and 3396-3403 when switching upward.

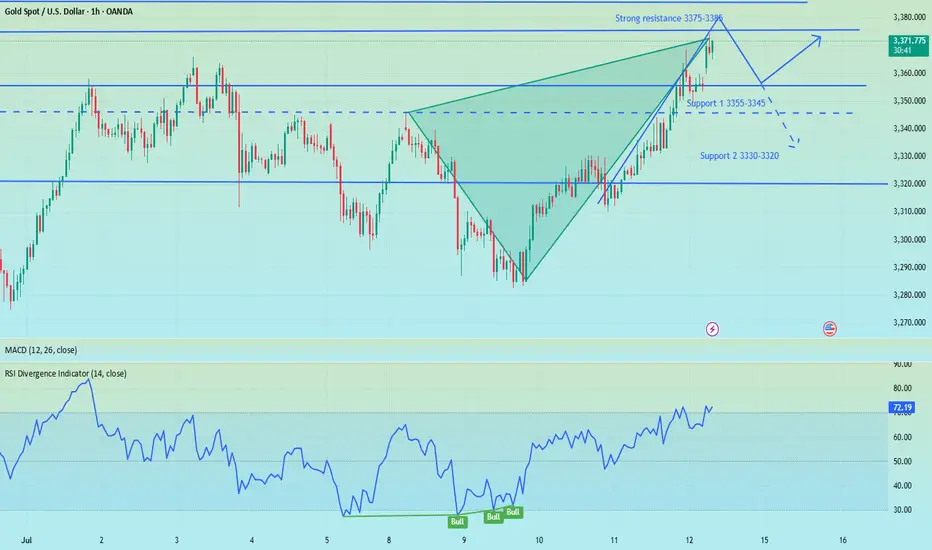
Gold Building Momentum for BUY MoveGold has tested the global trend level is showing a rebound the price is testing the support level of 3368 if it maintain support level the growth will continue to 3400 level
we suggest BUY XAUUSD 3368 entry point
target point 3400

Gold gaps up and open higher,beware of going long at high levelsBros, the Asian session opened higher in the morning. Currently, gold is falling back to the SMA1O moving average. We will continue to be bullish after it falls back and stabilizes. At present, it has broken through the key resistance level of 3360. The daily line has shown a strong pattern of three consecutive positives. The gold price remains in the rising channel, and the bullish trend is obvious. As the gold price moves up, the short-term moving average moves up with it. At present, 3355-3345 constitutes an important support in the short term, and 3375-3385 above constitutes a short-term resistance area. Whether it can stand firmly above 3360 this week is the key.
Severe overbought in the short term, there are trading risks for long positions at high levels. Short-term operation suggestions for the Asian and European sessions: consider shorting when it touches 3365-3375, and stop loss when it breaks 3375. The target focuses on 3355-3345, and the breakout looks at 3330-3320. On the contrary, if it stabilizes at 3355-3345, you can consider going long.
Short position profit, focus on 3355-3345 support📰 News information:
1. Focus on tomorrow's CPI data
2. Bowman's speech at the Federal Reserve
3. Tariff information outflows and countries' responses to tariff issues
📈 Technical Analysis:
The short-term bears have successfully hit the TP to realize profits, and the trading strategy is still valid. Continue to pay attention to the 3355-3345 support during the day. If effective support is obtained here, you can consider going long. For the rebound, the first TP can focus on the 3365 line. If the gold price breaks through 3380 in the future, it will not be far from 3400. If it falls below, pay attention to the support of 3330-3320 below. It is expected that this is the limit position of short-term bearishness. The impact of tariffs is still there, and the bullish trend remains optimistic in the short term, unless Europe, Japan and other countries have a new solution to tariffs.
🎯 Trading Points:
BUY 3355-3345
TP 3365-3380-3400
In addition to investment, life also includes poetry, distant places, and Allen. Facing the market is actually facing yourself, correcting your shortcomings, facing your mistakes, and exercising strict self-discipline. I share free trading strategies and analysis ideas every day for reference by brothers. I hope my analysis can help you.
OANDA:XAUUSD PEPPERSTONE:XAUUSD FOREXCOM:XAUUSD FX:XAUUSD TVC:GOLD FXOPEN:XAUUSD

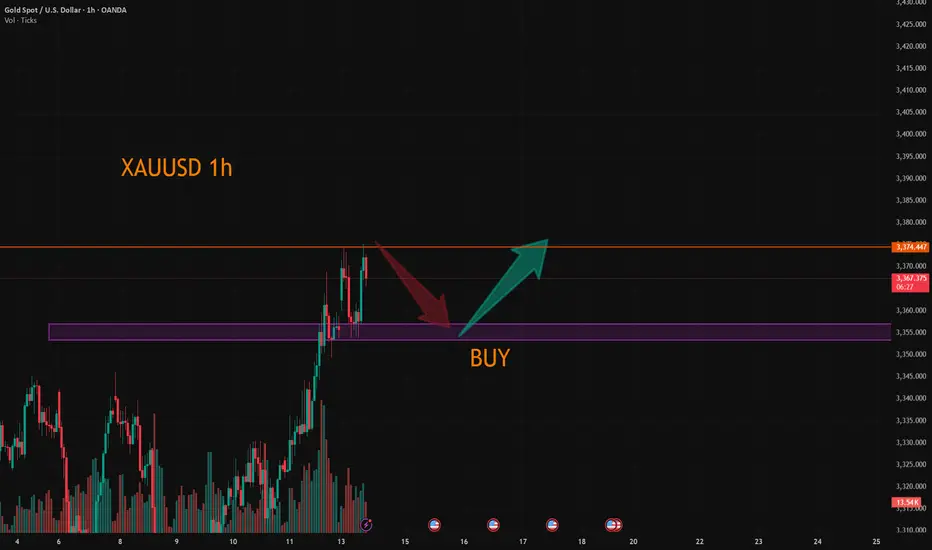
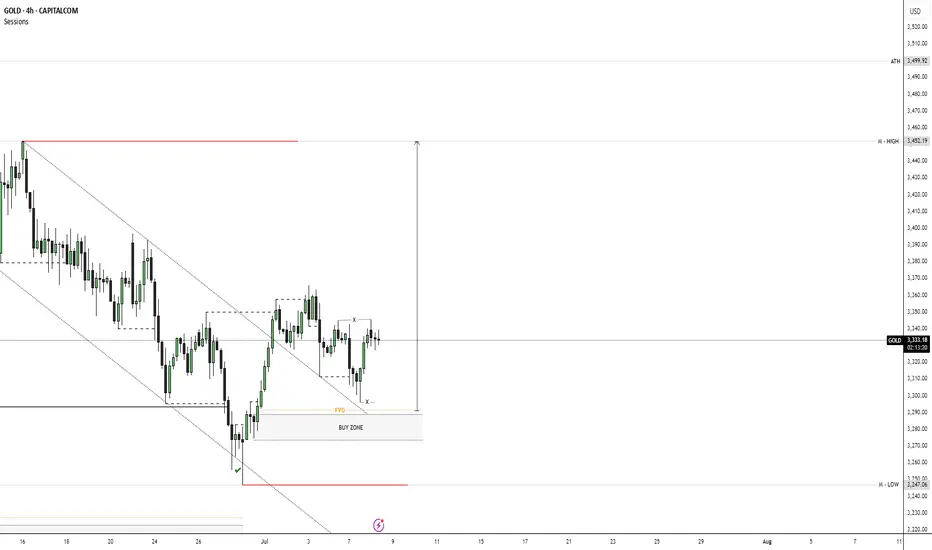
XAUUSD ANALYSIS💸GOLD💸
📉 Trend Overview
• Prior Structure: Market was in a strong downtrend, shown by descending highs and lower lows.
• Break of Structure: Price broke out of the descending trendline, indicating a potential bullish reversal or at least a deeper correction.
• Current Structure: The market is consolidating after an impulsive bullish move, forming a range or re-accumulation.
⸻
🔍 Key Observations
✅ Break of Downtrend
• Price has clearly broken the descending trendline — first sign of bullish strength.
• After the break, price created a higher high and pulled back — confirming a market structure shift.
📌 Fair Value Gap (FVG) & Buy Zone
• FVG identified below current price — this is often a liquidity gap where institutions may return to mitigate orders.
• The Buy Zone aligns with the FVG — making it a high-probability demand area.
• Price could wick into this zone before making the next bullish leg.
🧱 Range Formation
• Multiple touches at resistance (marked by “X”) indicate price is currently accumulating liquidity.
• Consolidation within a clear range suggests build-up before breakout.
⸻
📈 Possible Scenarios
🟩 Bullish Case
• Price revisits the Buy Zone / FVG area.
• Bullish reaction from this zone can lead to a break above the consolidation range.
• First target: previous high / top of the chart projection (marked with an arrow).
• Extended target: Implied liquidity above the highest resistance zone.
🟥 Bearish Invalidations
• A clean break below the Buy Zone and failure to react at the FVG suggests:
• Weak bullish momentum.
• Potential return to lower lows.
⸻
✅ Confluences Supporting Longs
• Market Structure Break.
• FVG + Demand Zone alignment.
• Trendline breakout.
• Range liquidity building up.
• Higher low formation.
⸻
🕵️♂️ What to Watch For
• Bullish engulfing or reversal pattern in the Buy Zone.
• Breakout candle with volume above consolidation.
• Retest of broken structure for confirmation.
XAUUSD Analysis – July 14, 2025: Gold Tests Critical Resistance Gold (XAUUSD) is currently trading around $3,373, rebounding strongly from the recent low at $3,294. Price is now testing the key resistance zone at $3,372–3,375, which aligns with the 0.0 Fibonacci retracement of the previous downtrend and a significant supply zone on the H4 timeframe.
1. Technical Analysis (H4 Chart):
🔹 Fibonacci & Price Action:
The price found strong support at $3,294, where previous demand and Fibonacci levels converge.
A sharp bullish move has pushed price above the 0.5 (at $3,316) and 0.618 (at $3,322) Fibonacci levels – signaling strong buyer interest.
The $3,372 zone is now acting as short-term resistance, matching the previous swing high.
🔹 EMA & RSI:
EMAs are trending upward, confirming short-term bullish momentum.
RSI is approaching overbought territory, suggesting a potential pullback in the short term.
🔹 Trendline & Structure:
Price remains above the rising trendline, indicating sustained bullish momentum.
The nearest support zone is now at $3,322 – $3,333, which overlaps with key Fibonacci and previous structure levels.
2. Key Price Levels:
Price Zone
Significance:3,372 – 3,375
Short-term resistance – Fibo 0.0:3,345 – 3,333
First support – pullback zone:3,322 – 3,316
Strong support – EMA + Fibo 0.5:3,294 – 3,287
Major support – recent swing low
3. Suggested Trading Strategies:
Strategy 1 – Take Profit for Existing Longs:
If you entered long positions near $3,295–$3,300, consider taking partial profits at the current resistance zone ($3,372–$3,375).
Strategy 2 – Short-Term Sell Opportunity:
Consider a short entry near $3,372–$3,375, with a stop-loss above $3,383.
Target profit: $3,333 – $3,322
Strategy 3 – Buy on Dip (Trend Continuation):
If price pulls back to the $3,333 – $3,322 support and holds, this is a good zone to enter long.
Stop-loss below $3,316, with potential target back to $3,385 – $3,400 if a breakout occurs.
Gold is showing a solid recovery after a sharp decline, but it is now testing a key resistance zone around $3,373. Caution is advised in the short term, as a pullback may occur. Priority should be given to "Buy on Dip" strategies if support zones hold.

Gold trend forecast for next week, continue to go longAfter the gold broke through on Friday, we started to turn long, and gold rose strongly. Gold finally rose as expected, and the gold bulls are still strong. If there is no major change in the news over the weekend, the decline next week will not be large, and we can continue to buy. The gold 1-hour moving average continues to cross upward and the bulls are arranged and diverge. The strength of gold bulls is still there, and the gold moving average support has also moved up to around 3330. After gold broke through 3330 yesterday, gold fell back to 3330 and stabilized and rose twice. The short-term gold 3330 has formed a strong support. Gold will continue to buy on dips when it falls back to 3330 next week.

XAU/USD(20250714) Today's AnalysisMarket news:
① Fed's Goolsbee: The latest tariff threat may delay rate cuts. ② The Fed responded to the White House's "accusations": The increase in building renovation costs partly reflects unforeseen construction conditions. ③ "Fed's megaphone": The dispute over building renovations has challenged the Fed's independence again, and it is expected that no rate cuts will be made this month. ④ Hassett: Whether Trump fires Powell or not, the Fed's answer to the headquarters renovation is the key.
Technical analysis:
Today's buying and selling boundaries:
3348
Support and resistance levels:
3395
3377
3366
3330
3319
3302
Trading strategy:
If the price breaks through 3366, consider buying in, with the first target price at 3377
If the price breaks through 3348, consider selling in, with the first target price at 3330

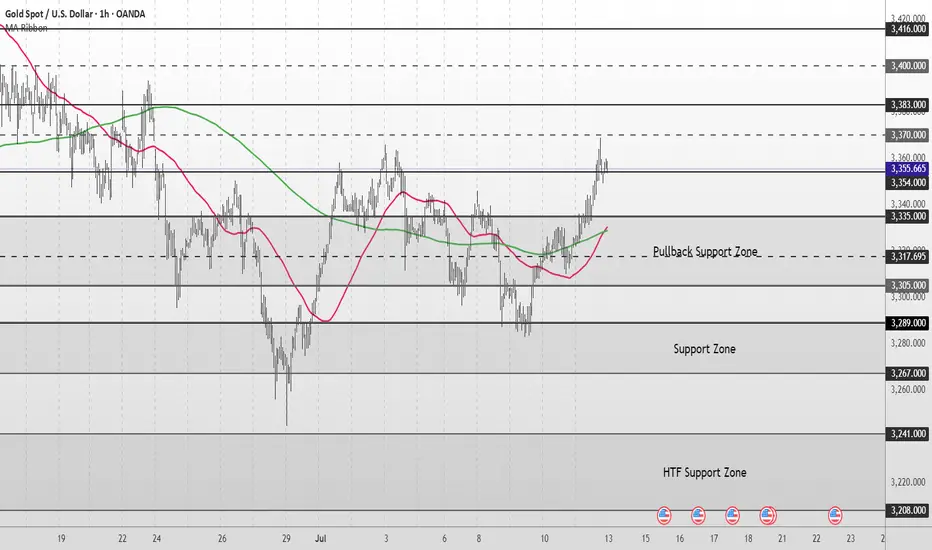
Gold Medium to Short Term Outlook Gold has shifted into a bullish structure after reclaiming key technical levels.
The strong impulsive move from below $3,300 into the $3,354–$3,370 resistance area reflects renewed buying interest, likely driven by improving sentiment and shifting macroeconomic expectations.
If bulls maintain control and price breaks and holds above $3,354, we could see continuation toward $3,383 and $3,400, with $3,416 marking the next major higher-timeframe resistance. These levels will be critical in determining whether gold resumes a broader bullish trend or begins to stall into a deeper correction.
On the flip side, if gold begins to fade below $3,354, then the $3,335–$3,305 pullback support zone will be key for potential bullish re-entry attempts.
A sustained break below this area would invalidate the current bullish leg and expose the market to a deeper retracement toward $3,289–$3,267, with $3,241–$3,208 acting as the higher-timeframe support floor.
📌 Key Levels to Watch
Resistance
‣ $3,370
‣ $3,383
‣ $3,400
‣ $3,416
Support
‣ $3,335
‣ $3,305
‣ $3,289
‣ $3,267
‣ $3,241
‣ $3,208
🔎 Fundamental Focus
Multiple high-impact U.S. data releases this week, including CPI, PPI, Retail Sales, and Unemployment Claims.
Expect elevated volatility across sessions.
⚠️ Manage your risk around news times. Stay sharp.