Gold rises after brief recovery
Let’s review the gold price for next week from July 14, 2025 to July 18, 2025
⭐️Gold Information:
Gold prices surged nearly 1% on Friday as sentiment soured over U.S. President Donald Trump’s controversial trade policy targeting Canada, while hinting at broader tariffs on other countries and copper. At the time of writing, XAU/USD was trading at $3,354, rebounding from an intraday low of $3,322.
On Thursday, Trump announced a 35% tariff on Canadian imports, but goods eligible under the 2020 USMCA trade agreement remain duty-free. He also expressed his intention to extend tariffs to most trading partners, proposing a basket of rates ranging from 15% to 20%.
With a light U.S. economic calendar, attention turns to comments from the Federal Reserve. Chicago Fed President Austan Goolsbee dismissed calls for rate cuts aimed at reducing government borrowing costs, stressing that the central bank's focus remains firmly on employment and price stability.
⭐️Personal Comment:
Growth with the trend, maintaining the accumulation price zone above 3300
🔥 Technical:
Based on the resistance and support levels of gold prices on the 4-hour chart, NOVA has identified the following important key areas:
Resistance: $3392, $3447
Support: $3330, $3308, $3246
Goldlong
GOLD UPDATE Hello friends🙌
📉Regarding the decline we had, which we also analyzed for you and said that the price is falling...
✔Now, with the support hunt identified, you can see that the price has returned strongly and broken the identified resistance and managed to reach higher ceilings, which also created a QM pattern, which increases the likelihood of the upward trend continuing.
Now with capital and risk management you can move towards your specified goals.
🔥Follow us for more signals🔥
*Trade safely with us*

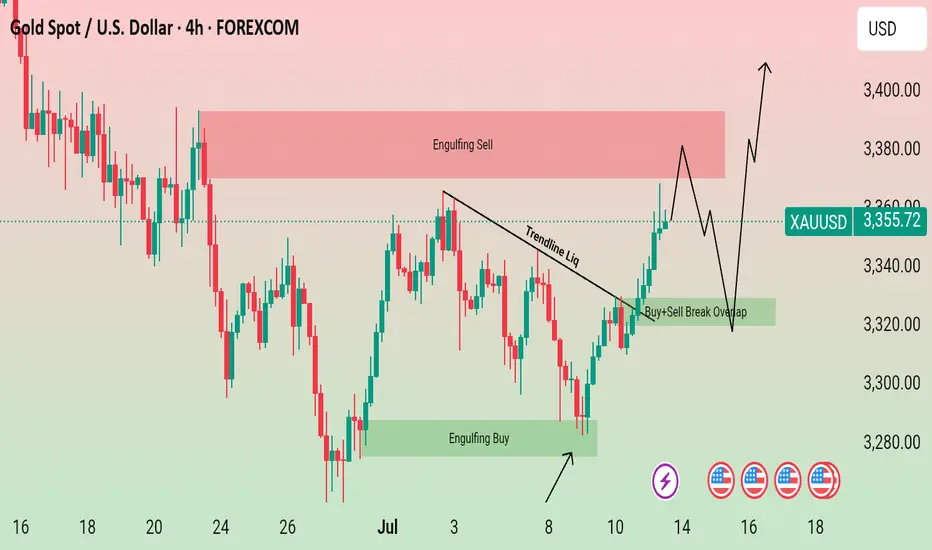
Gold just played an interesting game on the 4-hour chart!🚨 GOLD Technical Outlook – 4H Chart Insight! 🕵️♂️✨
📉 First, we spotted a Bearish Engulfing pattern that created a strong Sell Zone, signaling downward pressure. But guess what? The market wasn't ready to give up just yet…
📈 From the lower end, a powerful Bullish Engulfing stepped in like a hero, offering solid support and pushing the market back up!
Now here's where it gets exciting:
🔥 Gold has formed another bullish engulfing pattern, and the price is once again knocking on the door of that Sell Zone.
🤔 What's next?
A rejection from this sell zone could trigger another drop 📉
But keep an eye on the overlapping support zone below — if price revisits and holds there, we could see a bullish bounce toward the upside again! 🚀
📌 Key takeaway: We’re at a decision point. The next move could be explosive — up or down. Stay sharp! 🔍
⚠️ DYOR – Do Your Own Research! 🚫 This is not financial advice — just a trader's perspective.
BTC's increasing fomo force will push the price up furtherCRYPTO:BTCUSD just broke the important resistance zone and trendline around 110000. This price increase to create a new ATH will create a large amount of FOMO in the market pushing BTCUSD to increase more than half. 116,000 FIbonacci extension points are considered the immediate Target for the uptrend.
Waiting for retests to the support zone for the trend-following BUY strategy.
Support: 110000-107500
Resistance: 116000
Buy zone: 110000 ( support + trendline)
Buy Trigger: break above 112000
Leave your comments on the idea. I am happy to read your views.

GOLD 1H CHART ROUTE MAP UPDATE & TRADING PLAN FOR THE WEEKHey Everyone,
Please see our updated 1h chart levels and targets for the coming week.
We are seeing price play between two weighted levels with a gap above at 3381 and a gap below at 3353. We will need to see ema5 cross and lock on either weighted level to determine the next range.
We will see levels tested side by side until one of the weighted levels break and lock to confirm direction for the next range.
We will keep the above in mind when taking buys from dips. Our updated levels and weighted levels will allow us to track the movement down and then catch bounces up.
We will continue to buy dips using our support levels taking 20 to 40 pips. As stated before each of our level structures give 20 to 40 pip bounces, which is enough for a nice entry and exit. If you back test the levels we shared every week for the past 24 months, you can see how effectively they were used to trade with or against short/mid term swings and trends.
The swing range give bigger bounces then our weighted levels that's the difference between weighted levels and swing ranges.
BULLISH TARGET
3381
EMA5 CROSS AND LOCK ABOVE 3381 WILL OPEN THE FOLLOWING BULLISH TARGETS
3416
EMA5 CROSS AND LOCK ABOVE 3416 WILL OPEN THE FOLLOWING BULLISH TARGET
3439
BEARISH TARGETS
3353
EMA5 CROSS AND LOCK BELOW 3353 WILL OPEN THE FOLLOWING BEARISH TARGET
3328
EMA5 CROSS AND LOCK BELOW 3328 WILL OPEN THE FOLLOWING BEARISH TARGET
3305
EMA5 CROSS AND LOCK BELOW 3305 WILL OPEN THE SWING RANGE
3288
3259
As always, we will keep you all updated with regular updates throughout the week and how we manage the active ideas and setups. Thank you all for your likes, comments and follows, we really appreciate it!
Mr Gold
GoldViewFX

Breaking through 3350, the bullish trend remains unchanged📰 News information:
1. Pay attention to the impact of Trump administration tariffs
📈 Technical Analysis:
Possible interest rate cuts and tariffs in the fall continue to stimulate risk aversion. Currently, the 3300-3285-3310 points form a head and shoulders bottom pattern. The bullish momentum is relatively strong in the short term. Our short trade near 41 has hit the stop loss. As I wrote before, gold may continue to rise to 3360 or 3365 after breaking through 3350. The current RSI indicator is seriously oversold, so be cautious when operating in a unilateral trend in the short term. The safe way is to wait for a pullback to 3345-3340 to go long
🎯 Trading Points:
BUY 3345-3340
TP 3360-3370-3400
In addition to investment, life also includes poetry, distant places, and Allen. Facing the market is actually facing yourself, correcting your shortcomings, facing your mistakes, and exercising strict self-discipline. I share free trading strategies and analysis ideas every day for reference by brothers. I hope my analysis can help you.
TVC:GOLD FXOPEN:XAUUSD
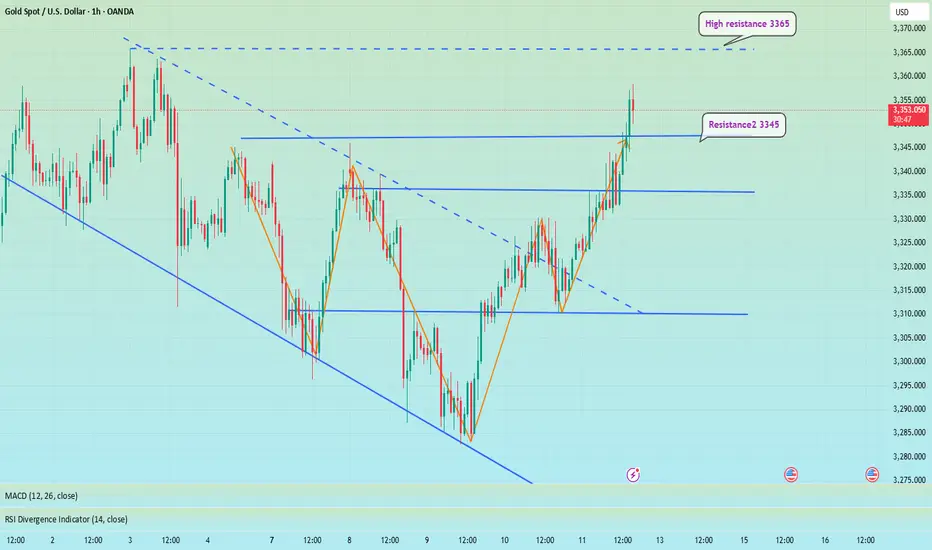
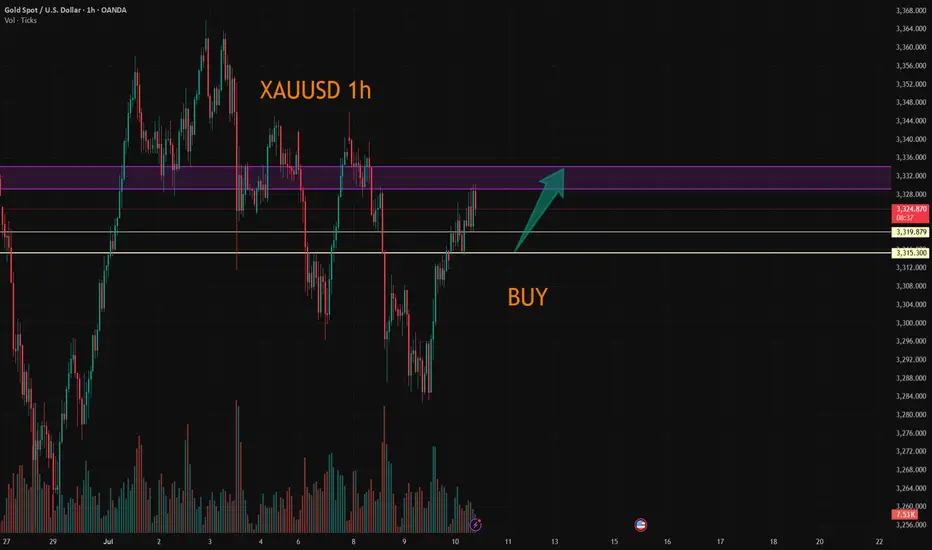
Xau usd buy setupGold (xauusd) next stop is 3365.
still not confirmed to sell. Wait and see what happens. I will update the next idea soon.

After gold adjusted, continue to go long when it fell back
The 1-hour moving average of gold has crossed upward to form a golden cross. The gold bulls are full of strength and have started to move upward. After breaking through in the afternoon, gold fell back to the support near 3330 and began to continue to rise. We never act as a die-hard bull or bear. We make timely adjustments when the direction changes. Gold bulls are in an even better position at the moment and have even broken through the key level of 3345. The pullback in gold will continue to provide opportunities for long positions. Gold is aiming at 3380, let's wait and see. The gold bulls are better at the moment and have broken through the key position of 3345. The decline of gold is to continue to give opportunities for buying. Gold is pointing to 3380, let's wait and see.
US trading operation ideas:
Gold 3340 more, stop loss 3328, target 3370-3380
Institutional Trading Process 1. Investment Idea Generation
This is where it all begins.
Institutions generate trading ideas based on:
Fundamental research (company earnings, macroeconomic data)
Quantitative models (statistical or algorithmic strategies)
Technical analysis (price action, trends, volume)
Sentiment analysis (news flow, social media, market psychology)
Often, the research team, quant team, or portfolio managers work together to develop high-conviction trade ideas backed by data and analysis.
2. Pre-Trade Analysis and Risk Assessment
Before placing a trade, institutions perform:
Risk/reward analysis
Scenario testing (How does the trade perform in different market conditions?)
Volatility analysis
Position sizing based on portfolio risk budget

XAUUSD Rises Steadily After RetestXAUUSD Rises Steadily After Retest – Buy Zone Showing Strong Effectiveness
Technical Analysis – July 11, 2025 (H4 Timeframe)
Gold (XAUUSD) is currently trading around $3,345, continuing its steady upward move from the key confluence support at $3,309–$3,318. The bullish momentum has strengthened following a clean break and successful retest of the previous bearish structure.
1. Updated Technical Data:
Current Price: $3,345.10
Fibonacci Retracement:
0.618 at $3,309.69
0.5 at $3,318.91
Recent Swing High (1.0 Fibo): $3,345.69
RSI (H4 Estimate): Around 62 – nearing overbought territory, but still has room for further upside
EMA20/EMA50: EMA20 has crossed above EMA50 – short-term trend is bullish
Next Resistance: $3,357.97 (previous swing high)
Immediate Support: $3,318–$3,309 (Fibonacci confluence zone)
2. Price Action Insight:
Following the correction low at $3,287.02, gold has shown strong recovery with a clear impulsive wave formation. The previous Buy Zone between $3,309–$3,318 has proved highly effective, leading to the current bullish breakout.
A classic “break–retest–continuation” pattern is forming on the H4 chart, suggesting that bulls remain in control unless disrupted by macro events.
3. Suggested Trading Strategies:
Primary Scenario: Buy on Dip
Entry Zone (on retest): $3,330 – $3,318
Stop Loss: Below $3,308
Take Profit 1: $3,345 (already reached)
Take Profit 2: $3,357
Extended Target: $3,368 – $3,372 if $3,357 breaks decisively
Alternative Scenario: Short from $3,357 if Reversal Signal Appears
Stop Loss: Above $3,362
Take Profit: Toward $3,330 – $3,318 support
4. Conclusion for Today:
Short-Term Trend: Bullish
Medium-Term Outlook: Neutral to bullish – watch $3,357 breakout for confirmation
Main Bias: Buy the dip and hold toward resistance at $3,357–$3,372
Follow for more real-time trading strategies and insights. Save this post if you find it helpful!

XAU/USD (Gold) chart EMA-based structureXAU/USD (Gold) chart EMA-based structure :
Trend Overview:
* **Short-term bias is bullish**, as price has broken above recent structure and is currently forming higher highs and higher lows.
* Price is **above the 7, 21, and 50 EMAs**, which are aligned bullishly and sloping upward — confirming upward momentum.
Key Levels:
Current Price:** \~\$3,319
* Trading just below **a strong resistance zone** (highlighted in green), indicating a potential challenge ahead for bulls.
Resistance Zone: \~\$3,323–\$3,336
* This area has previously acted as a **supply zone**, where price was rejected.
* Bulls need to break and hold above this level for continued upside toward **\$3,340+**.
Support 1 (S1):** \~\$3,314–\$3,310
* A recent breakout zone; if price retraces, this could be **retested as support**.
* If held, it may offer a **bullish continuation** setup.
Support 2 (S2):** \~\$3,302
* If S1 breaks, price may fall further to this **deeper demand zone**.
* A loss of this level would likely **shift short-term bias bearish** and target lower lows.
Scenarios
Bullish Path:
* Price holds S1 → pushes up → breaks resistance (\~3,323–3,336)
* Target: **\$3,340+**, then possibly \$3,350+ if momentum continues
Bearish Path:
* Price breaks below S1 and EMA support → retests S2 (\~3,302)
* If S2 fails, potential drop to **\$3,284–\$3,276 zone** (previous weak low zone)
Conclusion:
* **Bulls in control** short term as long as price stays above **EMA cluster (\~3,310–3,306)**
* A clean break above **\$3,336** confirms bullish continuation
* Break below **\$3,302** shifts bias bearish

Gold fluctuates, consolidation in the 3330-3310 range📰 News information:
1. Waller meeting on interest rate cuts
2. Trump tariff issues
📈 Technical Analysis:
Waller will participate in the meeting in more than two hours and pay attention to whether there is any news of interest rate cut. The key is to operate around the 3330-3310 range. Continue to pay attention to the support of 3310-3305 at night. If gold falls below 3310,-3305 again, the downward trend will continue, and it is expected to touch 3280 again, or even 3250. If it rebounds above 3330, it is likely to continue to rise.
In addition to investment, life also includes poetry, distant places, and Allen. Facing the market is actually facing yourself, correcting your shortcomings, facing your mistakes, and exercising strict self-discipline. I share free trading strategies and analysis ideas every day for reference by brothers. I hope my analysis can help you.
TVC:GOLD FXOPEN:XAUUSD FX:XAUUSD FOREXCOM:XAUUSD PEPPERSTONE:XAUUSD OANDA:XAUUSD

XAG/USD (Silver) - Triangle Breakout (09.07.2025)The XAG/USD (Silver) pair on the M30 timeframe presents a Potential Buying Opportunity due to a recent Formation of a Wedge Breakout Pattern. This suggests a shift in momentum towards the upside and a higher likelihood of further advances in the coming hours.
Possible Long Trade:
Entry: Consider Entering A Long Position around Trendline Of The Pattern.
Target Levels:
1st Resistance – 3749
2nd Resistance – 3781
🎁 Please hit the like button and
🎁 Leave a comment to support for My Post !
Your likes and comments are incredibly motivating and will encourage me to share more analysis with you.
Best Regards, KABHI_TA_TRADING
Thank you.
Disclosure: I am part of Trade Nation's Influencer program and receive a monthly fee for using their TradingView charts in my analysis

Gold rebounds as expected, NY focuses on the Fed meeting📰 News information:
1. Federal Reserve meeting minutes
📈 Technical Analysis:
Gold fell into a narrow range of fluctuations during the European trading session. As I said this morning, gold is expected to rebound in the short term and the bullish momentum needs to be released. From a technical perspective, the overall market is still in a volatile pattern. The support at the 3280 level below is still a key point that needs attention in the short term. The European session has repeatedly tested this area. If it falls below this support, it is expected to touch the 3250 level as I said. While guarding against gold diving during the NY session, the upper resistance of 3315-3321 cannot be ignored to prevent bullish retaliation.
🎯 Trading Points:
SELL 3315-3321-3333
TP 3300-3290-3280-3250
In addition to investment, life also includes poetry, distant places, and Allen. Facing the market is actually facing yourself, correcting your shortcomings, facing your mistakes, and exercising strict self-discipline. I share free trading strategies and analysis ideas every day for reference by brothers. I hope my analysis can help you.
OANDA:XAUUSD PEPPERSTONE:XAUUSD FOREXCOM:XAUUSD FX:XAUUSD FXOPEN:XAUUSD TVC:GOLD
XAUUSD:Wait for 3315-19 to go long.
The market is experiencing short-term narrow-range fluctuations. There is a certain level of pressure at 3330. I tend to view it more positively as a breakthrough.The trading range for today has narrowed.
Trading Strategy:
BUY@3315-19
TP3329-34
I will closely follow up on every trading strategy I develop. If you are unsure about how to conduct a trade, you can simply come to me for help.
More detailed strategies and trading will be notified here ↗↗↗
Keep updated, come to "get" ↗↗↗
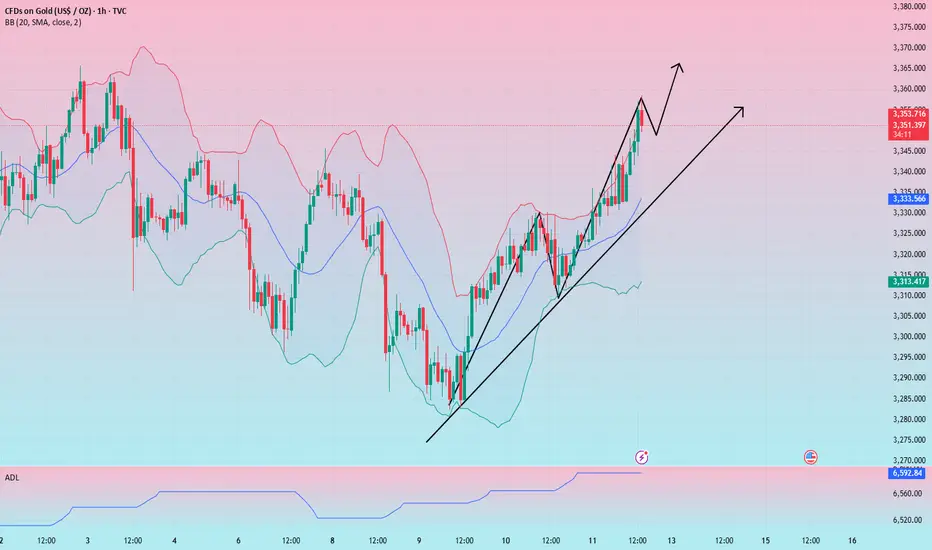
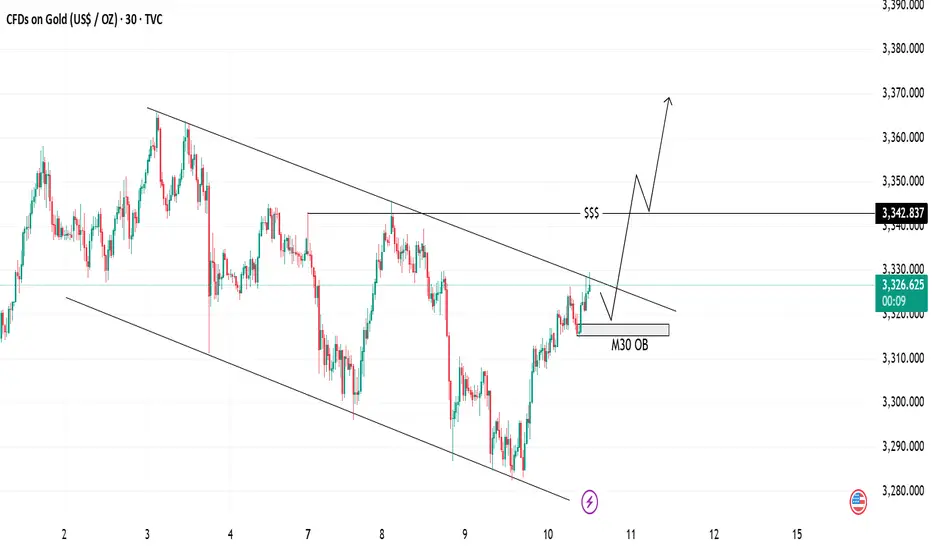
Gold Analysis Bullish Breakout | Trendline & OB Setup📈 Gold Analysis
We are currently seeing price action within a descending channel, testing key support at the M30 OB (Order Block). The price is pushing higher after bouncing off the support level, and the trendlines suggest a potential breakout to the upside.
💡 Key Levels:
Support Zone: 3326
Resistance Zone: 3342
The market is primed for a possible rally, indicated by the upward momentum and price breaking out above the trendline. Watch for confirmation as we approach the liquidity level for further bullish movement.
⚡ Trade Idea: Look for a long entry if price closes above the trendline for a continuation towards the next resistance.
XAUUSD:Stay long
Today's Shock Trading strategy:
Day traders can buy long positions at 3318-23 with a target range of 3340-45
Median traders please refer to the previous thinking unchanged.
More detailed strategies and trading will be notified here ↗↗↗
Keep updated, come to "get" ↗↗↗

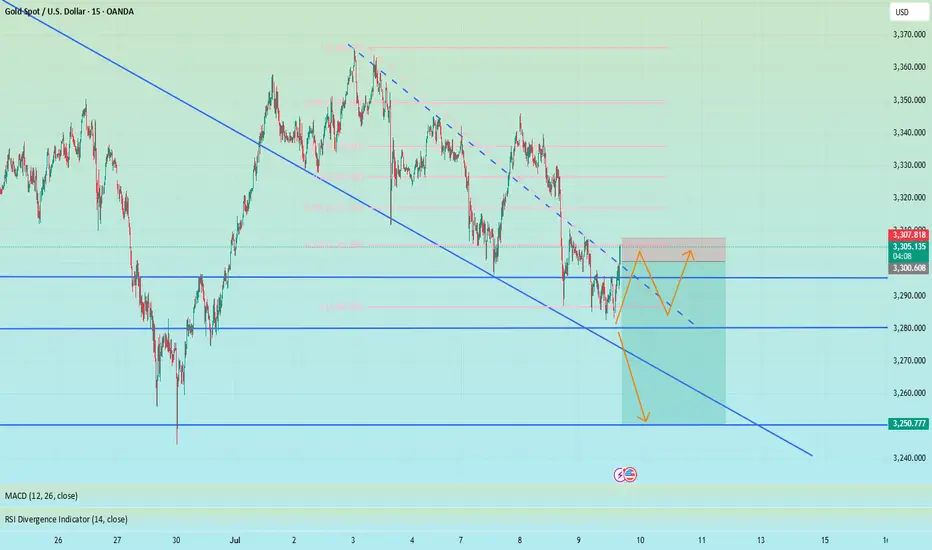
XAUUSD swing failure with FVGpotential short setup, loads of liquidity from 8th of july sell off, if no retest before reaching local new lows ( mid range of target) look for continuation buys
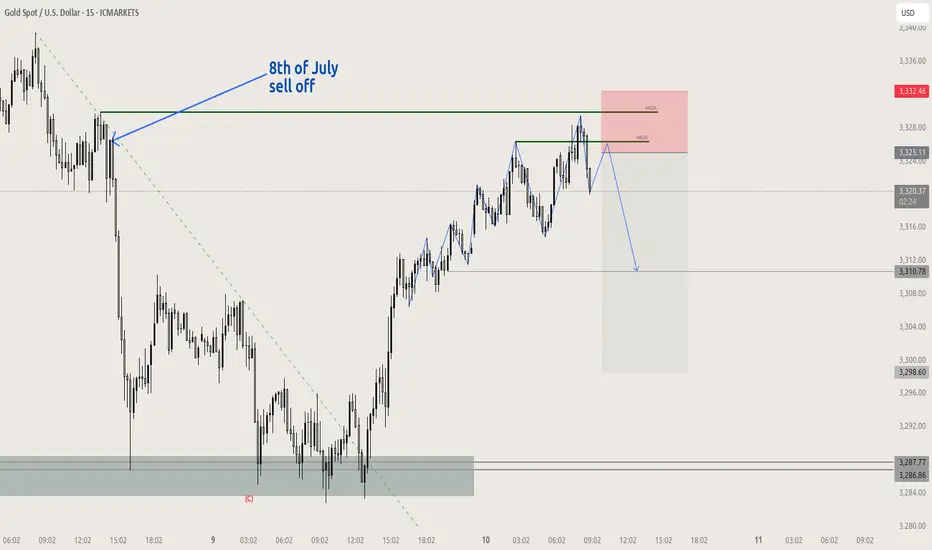
XAUUSD Idea: 4H Trendline First Breakout - Liquidity PlayFOREXCOM:XAUUSD
🔍 Analysis Overview:
Price has just broken above a 4H descending trendline for the first time. However, I remain cautious due to the following key observations:
📌 NOTES:
The broader market sentiment is still bearish due to recent tariff-related news, which often fuels risk-off behavior.
Historically, the first breakout of a strong trendline often fails, trapping early buyers.
This breakout is likely attracting buy-side liquidity, giving institutions an opportunity to hunt stops.
My observation shows buying interest started around the 3308–3313 range, suggesting smart money accumulation and a possible trap.
📉 I'm watching for a fake breakout and potential reversal targeting the liquidity zones marked below around 3307 and possibly lower.
The liquidity sweep below equal lows could offer a better risk-reward setup.
💡 Conclusion:
If price fails to hold above this breakout and shows signs of rejection, I will be anticipating a return towards the previous demand zone for a liquidity grab.
#XAUUSD #GoldAnalysis #SmartMoneyConcepts #LiquidityGrab #ForexTrading #TrendlineBreak #MarketPsychology #TradingSetup #SMC #PriceAction

Falling towards 50% Fibonacci supprt?The Gold (XAU/USD) is falling towards the pivot and could bounce to the 1st resistance which is a pullback resistance.
Pivot: 3,306.96
1st Support: 3,287.36
1st Resistance: 3,342.69
Risk Warning:
Trading Forex and CFDs carries a high level of risk to your capital and you should only trade with money you can afford to lose. Trading Forex and CFDs may not be suitable for all investors, so please ensure that you fully understand the risks involved and seek independent advice if necessary.
Disclaimer:
The above opinions given constitute general market commentary, and do not constitute the opinion or advice of IC Markets or any form of personal or investment advice.
Any opinions, news, research, analyses, prices, other information, or links to third-party sites contained on this website are provided on an "as-is" basis, are intended only to be informative, is not an advice nor a recommendation, nor research, or a record of our trading prices, or an offer of, or solicitation for a transaction in any financial instrument and thus should not be treated as such. The information provided does not involve any specific investment objectives, financial situation and needs of any specific person who may receive it. Please be aware, that past performance is not a reliable indicator of future performance and/or results. Past Performance or Forward-looking scenarios based upon the reasonable beliefs of the third-party provider are not a guarantee of future performance. Actual results may differ materially from those anticipated in forward-looking or past performance statements. IC Markets makes no representation or warranty and assumes no liability as to the accuracy or completeness of the information provided, nor any loss arising from any investment based on a recommendation, forecast or any information supplied by any third-party.

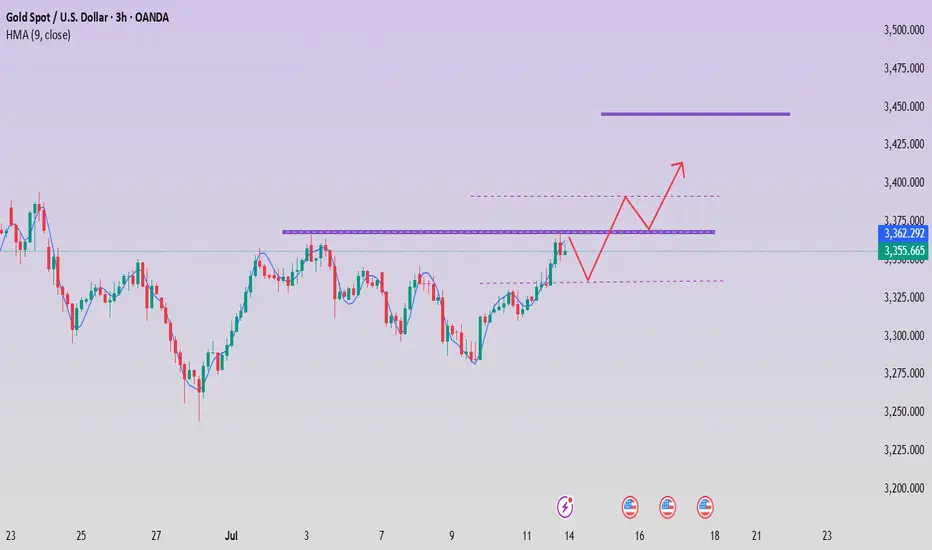
Gold Rebounds from 3283, Eyes 3315 Resistance📊 Market Overview:
• Gold dropped sharply to a low of $3283 earlier today before rebounding strongly back to around $3312, supported by renewed buying interest.
• The recovery is fueled by risk-off sentiment amid ongoing trade negotiation uncertainty and a mild pullback in the U.S. Dollar Index.
• Central bank buying continues to underpin gold’s base, despite mild pressure from rising U.S. bond yields.
________________________________________
📉 Technical Analysis:
• Key Resistance: $3315 – $3335
• Nearest Support: $3280
• EMA 09: Price is trading above the 9-period EMA, signaling a short-term bullish trend.
• Candle pattern / Momentum: A strong bullish engulfing candle formed after bouncing from $3283 on the H1 chart. MACD is crossing upward, and RSI is approaching the 60 level, suggesting bullish momentum.
________________________________________
📌 Outlook:
Gold may continue to recover in the short term if it holds above the $3300 level and successfully breaks through $3315 resistance. However, failure to break above this resistance could lead to a short-term pullback toward $3290–$3280.
________________________________________
💡 Suggested Trading Strategy:
🔻 SELL XAU/USD at: $3315–3325
🎯 TP: $3295
❌ SL: $3330
🔺 BUY XAU/USD at: $3285–3295
🎯 TP: $3315
❌ SL: $3280

7.9 Latest gold trend analysis and operation layout📰 News information:
1. Federal Reserve meeting minutes
📈 Technical Analysis:
Our decision to close our positions at 3305 yesterday was undoubtedly a very strategic one. After reaching a high of around 3310 last night, it began to fall. At the same time, I also gave VIP members the news that it might fall back to around 3300. Since the opening, the lowest point has reached around 3285. The overall trend is still under our control.
At present, gold will still usher in technical corrections in the short term. The current price of 3293-3290 support can be considered for long positions. If the European session continues to fall below the low, you can try to go short during the NY session. If the European session continues to maintain sideways consolidation, you can consider retreating and going long during the NY session. As long as the key support of 3250 below is held, gold will maintain its consolidation trend in short-term trading. On the contrary, once it falls below 3250, gold may directly touch the 3200 mark. Focus on the minutes of the Federal Reserve meeting, which may further influence the trend of gold.
🎯 Trading Points:
BUY 3293-3290-3285
TP 3305-3310-3320
In addition to investment, life also includes poetry, distant places, and Allen. Facing the market is actually facing yourself, correcting your shortcomings, facing your mistakes, and exercising strict self-discipline. I share free trading strategies and analysis ideas every day for reference by brothers. I hope my analysis can help you.

Big day for xauusd (gold)today fed (fomc ) will change the game , so i provide the level on chart. please check that levels . chart say #xauusd touch the level 3264 on negative news that level for buy and positive news for #gold 3296 and 3307 level and next t day 3328 and 3343 . so all thing on fed sir. and i am going for buy . thanks
