XAUUSD/GOLDThe bullish trend has opened. After the retracement is confirmed, continue to buy and wait for the market to rise and fill the gap.
Goldlong

XAUUSD Possible Move 26.05.2025Gold is currently respecting an ascending channel, showing consistent higher highs and higher lows. Price is now testing the upper boundary of this channel and approaching a key supply zone (3353–3357), which previously triggered a strong sell-off.
Key Zones:
🔼 Sell Zone: 3353–3357 (confluence of supply + channel resistance)
🔽 Buy Zone: 3325–3329 (demand zone + channel support)
✅ Trade Ideas:
📍Buy Setup
Entry: 3325–3329
SL: Below 3310
TP: 3350–3355
📍Sell Setup
Entry: 3353–3357
SL: Above 3367
TP: 3330–3325
🔔 Important Note:
⚠️ Today's U.S. Jobless Claims data is critical. Expect volatility and possible breakout/fakeout scenarios around the time of release. Trade only on confirmation.

BTC continues to short at high levels during the day📰 Impact of news:
1. Geopolitical impact
📈 Market analysis:
BTC has reached an intraday high of 108,125, just one step away from the all-time high of 112,000. With the increase in trading volume and institutional sentiment turning bullish, the momentum seems to be in the bulls' favor. In addition to institutional buying, the ceasefire agreement in the Iran-Israel war is also an important factor in Bitcoin's sharp rebound. Trump's announcement of the end of the war almost immediately triggered a surge in the cryptocurrency market. However, the overall pattern has not changed, and the range resistance has not been broken, so we still keep the idea of shorting at high levels.
🏅 Trading strategies:
SELL 108000-107500
TP 104500-103500
If you agree with this view, or have a better idea, please leave a message in the comment area. I look forward to hearing different voices.

Gold XAU/USD Bullish Reversal Setup – Targeting $3,454.65Price: $3,384.41
Strategy: Buy/Long
🟦 Key Levels:
Entry Zone: Around $3,345.76
This level aligns with a previously tested support zone marked in purple.
Stop Loss: $3,331.56
Below the support zone, providing downside protection if the setup fails.
Target (TP): $3,454.65
Marked as EA TARGET POINT, suggesting a potential upside of 3.16% (~$105.83 gain).
📊 Technical Indicators:
Moving Averages:
200 EMA (blue): Near the entry level, adds strength to the support zone.
50 EMA (red): Recently crossed below price, indicating early bullish momentum.
Price Action:
Sharp bounce from support suggests buying interest.
Potential inverse head and shoulders pattern forming, which is a bullish reversal pattern.
🧠 Trade Idea:
Buy near $3,345.76,
Stop Loss at $3,331.56,
Take Profit at $3,454.65
Risk/Reward Ratio ≈ 1:3.3 — favorable setup for long positions.

Bulls have made profits, gold layout in the evening📰 Impact of news:
1. Powell's testimony
2. Geopolitical impact
📈 Market analysis:
I have completed the long trade according to the previous trading strategy, and the long order has generated profit. In the short term, the overall trend of gold is still bearish. Only if it breaks through and stabilizes above 3350 can the bulls continue. If it rebounds to the 3330-3335 line and encounters resistance under pressure, you can consider shorting. If it rebounds to 3340-3350 but fails to stabilize, you can increase your short position. Pay attention to the support of 3320-3300 below. If it falls below 3300, it is expected to reach 3280
🏅 Trading strategies:
SELL 3330-3335-3340-3350
TP 3320-3310-3300-3280
If you agree with this view, or have a better idea, please leave a message in the comment area. I look forward to hearing different voices.
OANDA:XAUUSD FX:XAUUSD FOREXCOM:XAUUSD FXOPEN:XAUUSD TVC:GOLD

GOLD/XAUUSD SellGold price is still bearish in the short term. The US dollar is currently being boosted. There are also geopolitical talks and indirect ceasefires. Therefore, the short-term risk aversion sentiment has declined. The gold price is now quoted at: 3323. We can focus on the lower target of 3300-3290.

Gold rebound is blocked, 3333 line is directly short
After the continuous rebound, the gold price also showed obvious stagflation near 3340. The intraday hourly line went out of a small double top, which can also be said to be a weak rebound. We also said at the opening that 3340 is a short-term key long-short conversion position. At present, the gold price is still under pressure below this, which means that the market is still short. Then the gold price began to fall. There is no problem with our thinking, and our internal strategy also started shorting directly at the 3333 line. The current position is making a profit.
The market is weak, there is no doubt about it. There are only two conditions that can change our thinking. One is that the gold price rises rapidly and sharply to stand at 3340, and the other is that the gold price bottoms out near 3300. However, before any of the conditions are met, the short position will continue.
Specific strategy
Gold 3333 short, stop loss 3343, target 3310

Gold May Dip Short-Term Amid Cautious Fed & Geopolitical Calm📊 Market Overview:
• Gold saw a slight correction as Middle East tensions eased following a ceasefire agreement between Iran and Israel.
• A weaker USD and lower U.S. Treasury yields offered some support to gold prices.
• However, the Fed’s cautious stance on rate cuts and upcoming testimony from Chair Powell continue to weigh on gold sentiment.
📉 Technical Analysis:
• Key Resistance Levels:
– $3,350–3,360 (21/50-day SMAs)
– $3,370–3,385 (Fibonacci zone and swing highs)
• Nearest Support Levels:
– $3,316–3,320 (intraday lows and psychological level)
– $3,300–3,305 (strong support), followed by $3,245–3,275 if broken
• EMA 09: Price is currently trading below the 09 EMA, indicating a short-term downtrend.
• Candlestick Pattern / Volume / Momentum:
– The 15-minute chart shows slight recovery signals, but with weak momentum; RSI is below average and MACD is slightly bearish.
– No strong reversal candlestick pattern detected; small-bodied candles (doji) suggest indecision and selling pressure remains near $3,340.
📌 Outlook:
Gold may decline slightly in the short term, potentially retesting the $3,316–3,320 support zone. A rebound is possible if the USD weakens further or the Fed unexpectedly signals rate cuts.
💡 Suggested Trading Plan:
🔻 SELL XAU/USD at: $3,335–3,340
🎯 TP: $3,330 - $3,325
❌ SL: $3,345
🔺 BUY XAU/USD at: $3,318 – 3,315
🎯 TP: $3,320 - $3,325
❌ SL: $3,312

GOLD H2 Intraday Chart Update For 25 June 25 Hello Traders, as you can see that market just try to broke 3300 psychological level yesterday but unfortunately that was not successful attempt
All eyes on 3337-3348 zone for the day if market successfully breaks that zone it will move towards 3365 Blind Structure Level else we might see 3305 level test soon on Intraday basis
Reminder: This is also FED Chair Powell 2nd of Testifies
Disclaimer: Forex is Risky

XAU/USD – Bullish Reversal in Motion? Watch the Breakout ZoneGold just gave us a critical reaction off a key confluence zone — and bulls might finally be waking up. Here's the breakdown:
🔹 Falling Wedge Breakout:
Price respected the wedge support beautifully around the 0.382-0.5 Fib retracement and has now closed above the upper descending trendline. The falling wedge is a bullish reversal pattern, and we may be witnessing the early stages of a trend shift.
🔹 EMAs Realignment Pending:
Price is now testing the 20 and 50 EMAs — a clean break and close above them would likely trigger algorithmic momentum back into bullish continuation, especially if we see a flip of the 0.382 Fib at $3,324 as support.
🔹 Upside Targets:
* TP1: $3,372 (0.236 Fib)
* TP2: $3,450 (previous structure high)
* TP3: $3,539 (full range expansion)
🔹 Invalidation Below:
A break back inside the wedge and below $3,285 would invalidate the bullish bias and likely open the path to deeper correction toward $3,251 or even $3,217.
📌 Key Insight:
The best trades aren’t about prediction — they’re about preparation. This setup is all about reacting to price as it confirms. Let the market tell you when it’s ready to move, then strike with confidence and precision.
💡 Watching for bullish retest + volume confirmation before entering long.

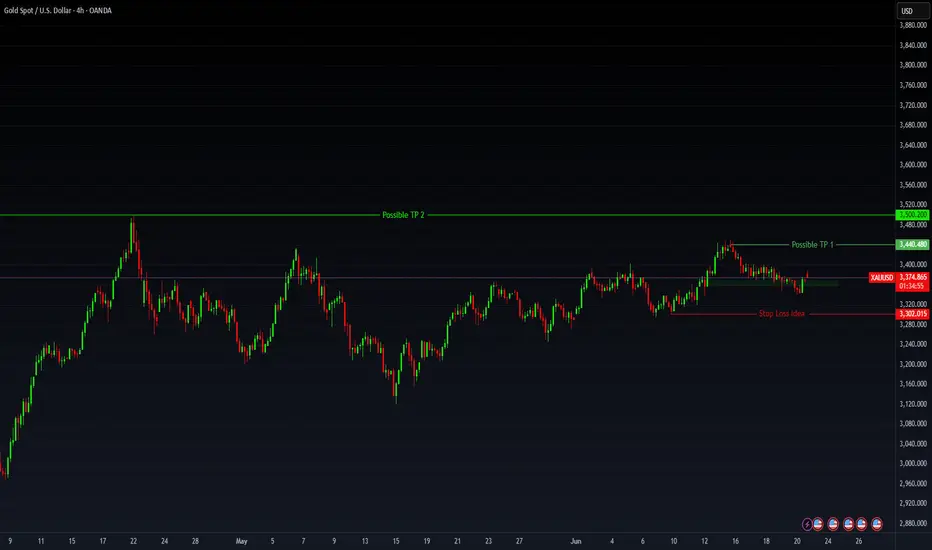
Gold’s Geopolitical Launchpad: Eyes on $3,500+🟡 GOLD - Macro Fuel Meets Technical Momentum Trade Levels Inside
Gold continues to flex its haven status as geopolitical tensions flare once again—this time triggered by reports of a U.S. airstrike on Iranian nuclear facilities. That headline risk has lit the fuse under precious metals, and the reaction in futures markets has been swift.
Friday’s intraday washout—largely driven by hopes that President Trump would opt for diplomacy—was short-lived. The strong recovery into New York close left a long lower shadow, signaling buyers are already pricing in weekend escalation risk.
💡 Macro View:
- Analysts project a move toward $3,500–$3,700, driven by a twin-engine of geopolitical instability and sticky inflation.
- Central banks are staying long; ETF inflows are ticking up—this isn’t just speculative hype.
- Goldman’s base case: $3,700 EOY, $4,000 by mid-2026. Recession/volatility scenarios stretch targets up to $4,500.
🔧 Technical Setup:
- Bias across all time frames remains bullish. Open float pressure is stacking with long-side conviction.
- Key long trigger zone sits between $3,369–$3,375—I’m watching for confirmation here.
- Profit targets:
- First resistance: $3,440.48
- Second target: $3,500 zone
- Stretch: $3,520+ if volatility expands
Gold updateAfter the previous level was broken and structure shifted, we’re now entering a new phase of analysis.
In this fresh setup, we’re looking for buy opportunities — but not blindly!
As always, waiting for a clean pullback to the new zone and a solid entry signal.
Experience teaches us: real profits come from patience and planning.
Here’s my new gold analysis — high probability, low risk.
For detailed entry points, trade management, and high-probability setups, follow the channel:
ForexCSP

Weakness continues, continue to short the bear market📰 Impact of news:
1. Pay attention to Powell's speech in New York
2. Pay attention to geopolitical influence
📈 Market analysis:
Gold opened lower and showed a weak situation. The 1H moving average was arranged downward. In the short term, bears still occupied the main trend. From the 4-hour analysis of gold, the bulls still had repeated resistance before breaking down. Once it breaks down, the market will go further bearish. Pay attention to 3330 below. 3400 is still the key above in the short term. Only by breaking through the bulls can the rebound continue. In terms of operation, high-altitude and low-long are temporarily maintained. Pay attention to the short-term resistance of 3355-3365 above, and the support of 3340-3330 below. Pay attention to the breakthrough! Pay attention to Powell's speech in the New York session.
🏅 Trading strategies:
SELL 3370-3365-3355
TP 3340-3330
BUY 3340-3335-3320
TP 3345-3355-3365
If you agree with this view, or have a better idea, please leave a message in the comment area. I look forward to hearing different voices.
TVC:GOLD FXOPEN:XAUUSD FOREXCOM:XAUUSD FX:XAUUSD OANDA:XAUUSD

Gold is under pressure and continues to focus on weekly support
The Israeli-Iranian conflict that broke out on June 13th lasted for 12 days before a ceasefire agreement was reached. Iran retaliated against the US military base but did not block energy transportation. Trump called its response weak, and market concerns cooled. Gold and oil prices gave up their gains. Spot gold closed at $3,368.98 per ounce, close to flat. U.S. crude oil fell 9% from a 5% increase. Trump announced on Tuesday that Israel and Iran had reached a ceasefire agreement. After mediation by Qatar, Iran agreed, and Israel also hoped to end the conflict within a few days.
Gold fell as the situation eased and the demand for safe-haven assets weakened. Oil prices fell more due to the lack of risk in the Strait of Hormuz, and U.S. stock index futures rose. Federal Reserve Vice Chairman Bowman unexpectedly said that interest rates may be cut in July. U.S. Treasury yields fell and the U.S. dollar index fell, but did not support gold prices. The U.S. economy is facing inflation and growth slowdown pressure. If the situation in the Middle East worsens, oil prices may soar, exacerbating the risk of stagflation. Short-term ceasefires and differences with the Federal Reserve suppress gold prices. Medium- and long-term geopolitical risks and expectations of interest rate cuts support gold. Investors can pay attention to relevant developments and diversify their allocations.
In terms of gold, the overall price of gold fell on Monday. The highest price rose to 3396.68 on the day, and the lowest price fell to 3346.92, closing at 3368.94. On Monday, gold jumped higher in the early trading, and then came under pressure again. It continued to rise after the European and US trading to test the opening high. The price fell very weakly overnight, and finally ended with a big negative. At present, gold is still in a volatile decline.
From a multi-cycle analysis, first observe the monthly rhythm. The price ran according to the rhythm in May as the author said, and finally in a cross state. For June, focus on the gains and losses of the highs and lows in May. The price will only be a real break if it really closes above this position. The long-term watershed is at 2780. From a weekly level, the gold price is supported by the 3280 regional support level. From a mid-term perspective, we are still in a mid-term bullish position, but we need to pay attention to the market's retracement to the weekly support. At the same time, the price will be further under pressure only if it breaks the weekly support. From the daily level, the price breaks the 3365 daily watershed. The overall follow-up still focuses on the pressure performance, and the focus below is on the retracement to the weekly support. At the same time, according to the four-hour level, we need to pay attention to the 3360 position temporarily. Since gold is currently in a volatile decline, it will continue to be short before breaking 3405. In the short term, we will first focus on the four-hour and daily resistance pressure, and focus on the 3320 and 3280 area support below.
Gold 3360 and 3365 range is under pressure, and the target is 3320-3280

GOLD Intraday Chart Update For 24 June 2025Hello Traders, As you can see that GOLD fell sharply this morning due to Israel- Iran Cease fire scenario
Further more FED Chair POWELL Testifies Starts from Today and end on Tomorrow make sure to manage you trading accordingly
Right now GOLD is in Strong Bearish Trend only clear Breakout of 3368 level for the day below this market remains Bearish
All eyes on 3300 Psychological Digit for now if market breaks 3300 Successfully then it will move towards 3250 soon
Disclaimer: Forex is Risky

Gold, Will USA-Iran-Israel conflict affect it? The USA-Iran-Israel conflict can significantly impact gold prices. Gold is a safe-haven asset, so demand often rises during geopolitical tensions, pushing prices up
3406 gonna be first target for me, if it breaks this lvl with huge volume and FVG on 1h+ then most likely we will see ATH in near future
bearish scenario(lest likely) - price breaks down 3340 and close with nice volume and fvg on 1h+ which will open move all the way down to MO

XAUUSD H4 Bullish Pullback Before Major Sell Zone ReactionGold (XAUUSD) is currently reacting from a strong H4 demand zone after an extended bearish move. Price is expected to pull back toward the selling zone marked around 3,440, which acted as major supply earlier.
This setup aligns with Smart Money Concepts — where price first collects liquidity from demand before a potential distribution from supply.
📍 Trade Setup Idea:
Buy from Demand Zone: 3,300 – 3,315
Target Zone (for rejection): 3,440 – 3,455
Stop Loss for Buy: Below 3,290
Watch for Short Entry at Selling Zone after rejection confirmation
🧠 SMC Concepts in Play:
Liquidity Sweep
Break of structure → Pullback → Mitigation
Selling pressure expected from previous imbalance area
⚠️ Risk Note:
Wait for bullish confirmation at demand before entering long, and bearish confirmation before selling from the top.
🔖 Tags:
#XAUUSD #Gold #H4Chart #SmartMoney #LiquidityGrab #ForexAnalysis #SMC #PriceAction #SupplyDemand #ForYou

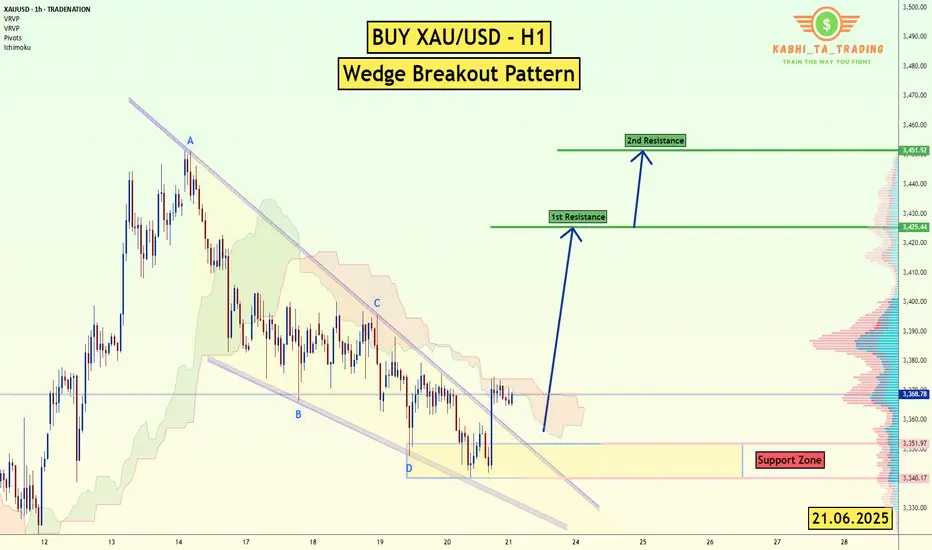
XAU/USD (Gold) - H1 - Wedge Breakout (21.06.2025)The XAU/USD pair on the H1 timeframe presents a Potential Buying Opportunity due to a recent Formation of a Wedge Breakout Pattern. This suggests a shift in momentum towards the upside and a higher likelihood of further advances in the coming Days.
Possible Long Trade:
Entry: Consider Entering A Long Position around Trendline Of The Pattern.
Target Levels:
1st Resistance – 3425
2nd Resistance – 3451
🎁 Please hit the like button and
🎁 Leave a comment to support for My Post !
Your likes and comments are incredibly motivating and will encourage me to share more analysis with you.
Best Regards, KABHI_TA_TRADING
Thank you.
Disclosure: I am part of Trade Nation's Influencer program and receive a monthly fee for using their TradingView charts in my analysis.
Gold Trading Strategy June 23The last two D1 candles have continuously drawn out the wicks. The Sellers may no longer be interested in dominating the market.
Currently, Gold is moving sideways in a wide range. 3345 and 3375 are the two Breakout zones of the gold price in today's trading day. When breaking out of the breakout zone, the price will continue its strong trend. Limit trading against the trend when the price breaks out.
Trading signals may also appear if there is confirmation from the candle that does not break out of this breakout zone.
Resistance and support zones remain the same as last week.
Resistance 3400-3415-3443
Support 3322-3296
Break out: 3375-3345
Recommended good trading signals
SELL 3399-3401 Stoploss 3405
BUY 3322-3320 Stoploss 3306

Gold bottoms out and tests resistance, long positions at night📰 Impact of news:
1. Bowman hinted at a July rate cut
2. Fed Governor Kugler and FOMC permanent voting member and New York Fed President Williams hosted the "Fed Listening" event.
📈 Market analysis:
Gold will maintain a short-term volatile trend. Although the United States intervenes in the conflict between Iran and Israel, the geopolitical situation will affect the market trend to a certain extent. However, the remarks of Federal Reserve Board member Bowman hinting at a rate cut in July have eased market volatility to a certain extent. Gold maintains a narrow range of fluctuations at the 4H level, and the technical pattern is gradually adjusted. The K-line stands firmly on the short-term moving average. The short-term trend shows that it is necessary to observe the second opportunity for pull-up after the confirmation of the retracement. At the hourly level, the short-term moving average diverges upward, and the short-term volatile and strong pattern is maintained. In the evening, pay attention to the upper resistance area of 3395-3405, focus on the suppression of the 3405 line, pay attention to 3375-3365 below, and further pay attention to the 3345 support line if it breaks through.
🏅 Trading strategies:
SELL 3385-3395-3405
TP 3370-3365-3345
BUY 3375-3365-3355
TP 3390-3400-3405
If you agree with this view, or have a better idea, please leave a message in the comment area. I look forward to hearing different voices.
TVC:GOLD FXOPEN:XAUUSD FOREXCOM:XAUUSD FX:XAUUSD OANDA:XAUUSD

XAU/USD Double Bottom Breakout Bullish Momentum Incoming!XAU/USD Double Bottom Breakout 💥 | 🚀 Bullish Momentum Incoming!
Analysis:
🟡 Double Bottom Pattern: Two clear lows have formed around the $3,340 support, signaling a potential reversal.
🟦 Accumulation Zone: The price consolidated in a range, indicating strong buying interest before the breakout.
🟣 Bullish Momentum: Recent aggressive bullish candles show strong buying pressure.
📈 Breakout & Retest Zone: If the price holds above $3,370, a bullish continuation toward $3,409 and possibly $3,445 is expected.
🧭 Target Area: Marked with a blue box, the upside potential is clearly projected.
Conclusion:
A successful retest of the breakout level may lead to a strong bullish run. Keep an eye on $3,370 as the pivot zone. 🎯

Conflict breaks out, risk aversion rises, can 3400 be broken?Bowman's dovish comments in the afternoon eased the market, by which time risk aversion was deepening as sudden geopolitical conflicts continued to deepen. Will the USA make a corresponding response to this matter? This series of events has once again put gold into a complicated situation. Can gold hit the 3,400 mark today?
Free trading strategies are updated daily🌐. All trading strategies released since this month have been verified and can serve as a good reference📈.👇 I sincerely hope that these strategies can be helpful to you👇.
OANDA:XAUUSD FX:XAUUSD FOREXCOM:XAUUSD FXOPEN:XAUUSD TVC:GOLD

PAXGUSDT 4H levels 6/23/25Not much change on the 4H levels from the previous week. There were a few nice spikes that profit could have been taken from. Liquidity was swept and price dropped down to one of the marked levels. I'm looking for price to hit those levels once again.

GOLD - AnalysisHello Traders,
Gold is still consolidating in this range 3350 to 3390. Long term we're targeting 3450 buys.
Currently in buys from 3362.
Trade with care. Note that this is not a trading call.
Thanks
