Gold price plummeted below 3200, how should gold be deployed?🗞News side:
1. The rise in U.S. stocks is worrisome, and the risk of backlash is growing.
2. Pay attention to initial unemployment claims data
📈Technical aspects:
The US gold price fell below the key support of 3200. At present, the gold shorts continue to exert their strength and are expected to further test the support of 3170-3160, or even the previous key point of 3150. Before the market trend becomes clear, it is not recommended for brothers to enter the market at will. If the gold price successfully touches the support area below and obtains strong support, then enter the market to do more.
If you agree with this view, or have a better idea, please leave a message in the comment area. I look forward to hearing different voices.
OANDA:XAUUSD FX:XAUUSD TVC:GOLD FXOPEN:XAUUSD FOREXCOM:XAUUSD
Goldlong

XAU/USD - Trendline Breakout (14.05.2025)The XAU/USD pair on the M30 timeframe presents a Potential Buying Opportunity due to a recent Formation of a Breakout Pattern. This suggests a shift in momentum towards the upside and a higher likelihood of further advances in the coming hours.
Possible Long Trade:
Entry: Consider Entering A Long Position around Trendline Of The Pattern.
Target Levels:
1st Resistance – 3321
2nd Resistance – 3364
🎁 Please hit the like button and
🎁 Leave a comment to support for My Post !
Your likes and comments are incredibly motivating and will encourage me to share more analysis with you.
Best Regards, KABHI_TA_TRADING
Thank you.

Focus on 3200 for some support during the day🗞News side:
1. Sino-US tariffs have been eased
2. U.S. trade progress and focus on geopolitical risks
📈Technical aspects:
Yesterday we gave a long trading strategy and have been waiting to see whether the gold price can touch our target point of 3270. However, gold did not fluctuate much after the opening of the Asian market, so I chose to manually close the position near 3256.
To be honest, the market did not fluctuate much today whether it was up or down, and it is still consolidating within our box range of 3220-3265. Although gold is generally weak, it has a higher probability of strengthening during the day, and the early gap may be ready for market recovery. At present, the gold price has tested the 3240 line many times. If it cannot stand above 3240, it may test the strong support of 3200 again. If there is no breakthrough below the strong 3200 support, the market may repeat
If you agree with this view, or have a better idea, please leave a message in the comment area. I look forward to hearing different voices.
FOREXCOM:XAUUSD FXOPEN:XAUUSD TVC:GOLD FX:XAUUSD OANDA:XAUUSD

The market is full of crises next week!📌Fundamentals:
This weekend, China and the United States held two days of negotiations as scheduled. It seems that there are many topics to discuss and the scope is wide, but they are still trying to reach a consensus. Otherwise, there is no need to spend two days of intensive talks. Some people think that after so long, there is no conclusion, which is bad news. I think the opposite. At this time, no bad news means good news. Based on the current "marathon" negotiation time, we need to be vigilant about the expected difference in the results of this round of negotiations. The second is the India-Pakistan conflict. After the talks led by the United States, India and Pakistan have agreed to a comprehensive and immediate ceasefire. Judging from this line alone, there will definitely be no risk of risk aversion rising when the market opens on Monday. The only thing is that the results of this round of negotiations between China and the United States are quite important, and there will definitely be results before the opening of Monday.
📊Technological aspects:
Even if the current round of China-US negotiations achieves an optimistic result, gold cannot fall below 3300. If it falls below 3300 and hits the low point below 3275 again, then the next step for gold is very likely to touch the high point of 3160-50 where the trade war started. On the contrary, if gold can hold 3300, then it is very likely to move like the previous wave, break the range, stand above 3360-70, then gold will continue to return to above 3400. Therefore, the most critical position for the opening of next week is the support position of 3300 below and the suppression position of 3360-70 above. If it breaks, the trend will almost move in that direction.

USOIL UPDATEHello friends
Given the recent growth in oil prices, it is natural for the price to correct. Now we have obtained the most important price support areas for you and we have also specified the target. If you are willing to enter the transaction, be sure to observe capital management.
*Trade safely with us*

[XAU/USD Analysis – 1H Timeframe] - as expectedAs predicted in the previous post, gold (XAU/USD) reacted precisely at the 3243 resistance zone — a strong supply area where our short-term SELL setup was triggered. Price then reversed and moved downward as expected.
At the moment, the trade plan remains unchanged. You can refer to the detailed setup in my previous post on my personal page. Here's the updated short-term strategy
💡 Short-Term Trade Scenarios:
SELL XAU/USD
📍 Entry Zone: 3240 – 3243
💰 Take Profit: 3235 – 3238
🚨 Stop Loss: 3245
BUY XAU/USD
📍 Entry Zone: 3219 – 3222
💰 Take Profit: 3224 – 3227
🚨 Stop Loss: 3214
The market is currently trading within a narrow range, so the short-term strategy is to “buy low – sell high” within this zone, with tight risk management. A clear breakout beyond 3245 or 3214 may require a reassessment of the trading strategy based on momentum and volume.
⏳ Note: This is a short-term analysis based on the 1H timeframe and is not intended for overnight holding unless supported by a clear setup.

Gold Sideways: A Short-Term Opportunity for Smart Traders⚙️ 1. Short-Term Trend
On the 1-hour timeframe, gold price is consolidating in a narrow range between $3,220 – $3,243 following a pullback from the recent peak at $3,265. Recent candlesticks suggest that selling pressure is weakening, but no clear reversal signal has appeared yet. The main trend remains slightly bearish within a tight channel, awaiting a breakout.
📍 2. Key Technical Levels
• Nearby Resistance:
o $3,230: A mid-session resistance level that has been tested multiple times but not yet convincingly broken.
o $3,243: Intraday high. A break above this level could trigger a move toward $3,265, with potential extension to $3,280.
• Key Support:
o $3,220: Minor intraday support, currently under repeated testing.
o $3,200: Strong support and a critical technical level. A breakdown below this level may lead to further decline toward $3,185 – $3,170.
📈 3. Technical Indicators
• EMA 50 & 200 (H1): Price is trading between the 50 and 200 EMAs, indicating consolidation and indecision before a breakout.
• RSI (14): Hovering around 45–50, suggesting slowing bearish momentum, but no clear sign of a bullish reversal.
💡 Short-Term Trade Scenarios:
SELL XAU/USD Zone : 3240 – 3243
💰 TP : 3235 – 3238
🚨 SL $3245
BUY XAU/USD Zone: 3219 – 3222
💰 TP : 3224 – 3227
🚨 SL $3214
⚠️ Trading Note
Volatility may spike if there is news from the Fed or new geopolitical developments.

Gold Price Analysis May 13Candle D shows a strong selling force approaching the key support zone of 3200, if it breaks this zone, it will confirm the continuation of the strong downtrend
Gold is facing some selling force around 3265. There will be a lot of selling force waiting around 3270 and 3280. Today, you can watch for SELL around these two zones. If the breakout is confirmed towards 3317, you can implement SELL strategies.
On the contrary, the nearest support zone for the breakout that gold is aiming for is around 3243. 3222 and 3200 act as two stops for a prolonged slide in gold prices today. Remember that in the large frame, a downtrend wave is starting to form, so the downtrend of gold can fall very strongly.

Gold prices are expected to rise in the future!Market news:
On Wednesday (May 14) in the early Asian session, spot gold fluctuated in a narrow range and is currently trading around $3,240/ounce. After the plunge on Monday, the London gold price rebounded slightly. The influx of bargain hunting provided support for the international gold price. In addition, the US CPI in April was weaker than market expectations, the Fed's expectations for rate cuts cooled, the US dollar index fell from a one-month high, and geopolitical concerns provided momentum for the gold price to rise.International gold faces three key variables: first, the follow-up progress of the Sino-US trade negotiations. Although the two sides reached a 90-day truce agreement, the comprehensive tariff policy still exists; second, the direction of the Federal Reserve's monetary policy. The mild performance of inflation data may create conditions for rate cuts; finally, global geopolitical risks, especially the evolution of the Russia-Ukraine peace talks and the India-Pakistan conflict. There are relatively few economic data on this trading day. US Secretary of State Rubio will attend the informal meeting of NATO foreign ministers from May 14 to 16 to discuss NATO's security priorities, including increasing defense investment and ending the Russian-Ukrainian war. In addition, several Federal Reserve officials will give speeches, and investors need to pay attention!
Technical Review:
The gold daily chart closed sharply below 3207, and the price broke away from the MA10/7-day gold bottomed out and rebounded in the late trading. The daily line closed with a small positive K and closed above the 3250 mark. After the extremely weak decline in the US market, the trend turned strong in the early morning, forming a wide range of fluctuations around the 3220/3270 range. The daily MA10/7-day moving average of the daily chart opened and suppressed 3296/3310 downward. The short-term four-hour chart and the hourly chart moving average were glued together, and the hourly chart Bollinger band closed. It closed strongly above the 3250 mark in the early morning, and the Asian market needs to pay attention to the strength of the counterattack of buying. Today's trading ideas are still expected to fluctuate, sell at high prices and buy at low prices to participate in short-term layout.At present, gold selling is temporarily resting. The intraday gold surge and the sharp drop before the data also show the repetitiveness of market sentiment. However, in the future, some factors that are conducive to selling are gradually implemented. The Fed's interest rate cut will be put on the agenda again in the medium term. The medium-term favorable pattern for gold has not changed, so in terms of operation, you can wait for the retracement to continue buying and continue to be bullish on gold.
Today's analysis:
The monthly chart of gold is running in an upward trend, and the long-term trend is neutral and upward; the weekly chart is a high-level shooting star, and the medium-term trend is expected to fall; the daily chart fails to hit the previous high and runs downward, and the short-term trend is expected to fall; the intraday short-term breaks through the 3248 suppression and continues upward, and the short-term stop-loss pattern appears. So far, the market has been repeatedly sorted above the 3215 area, and the short-term selling slows down and shows signs of stopping the decline!Note that if the one-hour closing today breaks above the 3348 area, then be careful when selling, and there is a high probability that the market will bottom out and reverse, which means that a new round of swing buying will start! At that time, you can directly choose the opportunity to buy the bottom! For the current short-term gold, focus on the stabilization of the two supports of 3215-3225. Take 3200 as the turning point of the Fengshui Ridge, and keep it to continue to maintain the bottom shock or gradually rebound; once it breaks through 3270, the rebound will be strengthened to test the 3300 mark; if it breaks through 3300 and stabilizes, the downward adjustment will end and the trend will return to rise;
Operation ideas:
Buy short-term gold at 3227-3230, stop loss at 3228, target 3270-3290;
Short-term gold sell at 3265-3268, stop loss at 3277, target 3230-3210;
Key points:
First support level: 3225, second support level: 3215, third support level: 3200
First resistance level: 3260, second resistance level: 3278, third resistance level: 3300

XAU/USD) Bullish trand line analysis Read The ChaptianSMC Trading point update
Technical analysis of Gold Spot (XAUUSD) on the 4-hour timeframe, featuring key support and resistance levels, price action projections, and RSI for momentum evaluation. Here's a breakdown of the idea:
Key Points in the Analysis:
1. Support & Resistance Zones:
Big Support / Buying Zone: Around 3,222 – 3,240. This zone has seen previous bullish reversals and is supported by the 200 EMA.
Intermediate Support Level: Around 3,270–3,290, where price might bounce before attempting a breakout.
Key Resistance Level: Around 3,350–3,365. Price must break this area to move toward higher targets.
2. Price Action Projections:
The analysis shows two bullish potential scenarios:
Scenario 1: Price breaks above the resistance level directly and moves toward the target point at 3,535.83.
Scenario 2: A retracement to the lower support or even the big buying zone before a bullish rally to the same target.
3. RSI (Relative Strength Index):
Currently near the neutral zone (around 49), suggesting there's room for movement in either direction.
No extreme overbought/oversold signals right now.
4. EMA (200):
The price is currently hovering above the 200 EMA (3,222.01), which acts as a long-term support and trend indicator.
Mr SMC Trading point
Summary of the Trading Idea:
Bias: Bullish
Entry Zones: Look for long entries at either the support level (3,270–3,290) or lower buying zone (around 3,222).
Target: 3,435.05 initially, then 3,535.83.
Invalidation: A clear breakdown below the 3,222 support level could invalidate the bullish bias.
Pelas support boost 🚀 analysis follow)

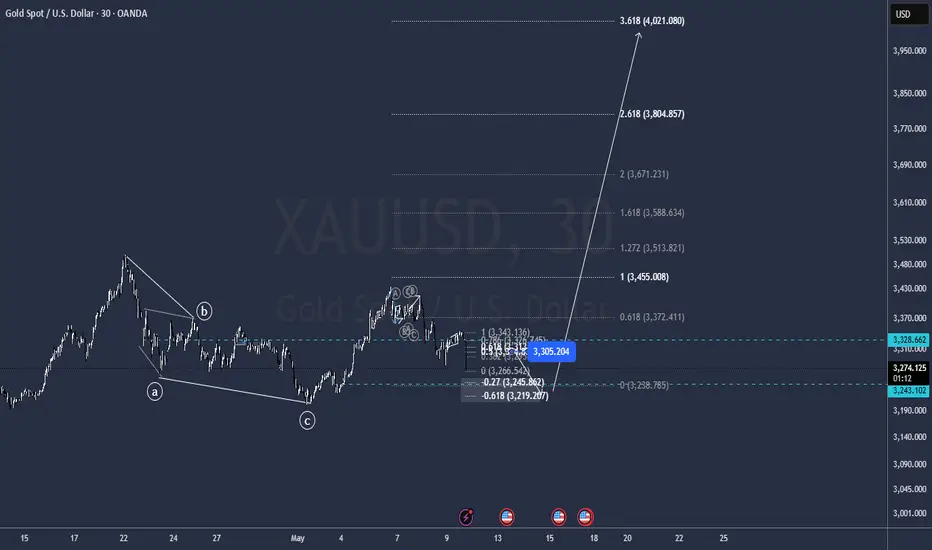
Bullish Reversal Forming at Key Support Zone – Targeting 3,450Instrument: Unspecified (likely XAU/USD or an index, judging by the price range)
Current Price: ~3,250.100
Indicators Used:
EMA 50 (Red): 3,284.255
EMA 200 (Blue): 3,287.152
🟣 Key Zones:
Support Zone: Around 3,200 – a strong demand zone where price previously bounced.
Target Zone: Around 3,450 – the last major resistance and recent high.
📉 Current Price Action:
Price recently tested the support zone and is forming a potential double bottom pattern.
EMAs are above the price, indicating a short-term bearish trend, but the price holding support may suggest a possible reversal.
A bullish trajectory is drawn, projecting a potential rise toward the target zone at 3,450.
📈 Potential Trade Idea (Hypothetical):
Entry: Near current price or on pullback to the small support box (~3,240)
Stop-loss: Below the major support (~3,190)
Take-profit: Around 3,450
⚠️ Key Considerations:
Price needs to break above the EMAs to confirm momentum shift.
Watch for confirmation with bullish candlesticks or volume spike.
Failure to hold the 3,200 support could invalidate this setup.

Gold's callback remains bearish
As expected, the market weakened and fell again. Today, the lowest price fell to 3215. There are countless opportunities to stop profit and leave the market. Even if you don't operate, you can see the strategy time I publish every day. This can be regarded as the first round of gains since the opening. Although there is no long position, the short position is still good!
Approaching the European session, I also mentioned at noon that the rebound upward can continue to bet on the second short position. Both the time and the point are given. The highest rebound in the European session is 3266. The point I gave is 3260-63. There should be countless opportunities to enter the market. The current gold price fell to 3237! Still the same point of view, it is easy to make a profit of at least 20-30 points each time! If you have been facing losses, it means that you have not focused on the free strategies I publish every day.
Traders who did not enter the market today are advised to continue to pay attention to the 3266 resistance and enter the market again. The support below is 3215. Before the data market is released, it will be treated as a volatile trend. I will make real-time suggestions when the breakout occurs.
Hello traders, if you have better ideas and suggestions, please leave a message below, I will be very happy

CPI data released, golden day analysis and operation layout🗞News side:
1. CPI data is in line with expectations, short-term positive
📈Technical aspects:
As we wrote in the last post, from the 4H point of view, the oversold is serious, and there is a need for rebound correction in the short term. At present, the fluctuation of gold prices is mainly affected by news. Technical analysis and indicators can only be used as a side analysis guide and reference. Gold bottomed out in the morning and rebounded, and the European market continued to rise above 3250. This means that today is not a very weak bear. At the same time, the daily line touches the 30-day moving average support. There is a high probability of turning positive today. The overall idea is to treat the market as a shock.
Intraday gold operation suggestions:
🎁BUY 3240-3250
🎁TP 3260-3270
Looking further towards the 3277 line
If you agree with this view, or have a better idea, please leave a message in the comment area. I look forward to hearing different voices.
OANDA:XAUUSD FX:XAUUSD TVC:GOLD FXOPEN:XAUUSD FOREXCOM:XAUUSD

XAU/USD – Things are waiting I’ve been quietly tracking XAU/USD, and something’s been standing out: no new high, no conviction, and no clear follow-through. That’s not weakness — that’s bait. It’s the kind of setup that shakes out the impulsive traders... right before the real move begins.
I’m not interested in chasing this range. The real opportunity — the one that matters — sits lower.
There’s only 2 zones I’m watching: the blue boxes.
That’s where I’ll position. That’s where the real story unfolds.
The market has been hovering just above a liquidity pocket, and I wouldn’t be surprised to see a fast sweep, a volume spike, or even a CDV divergence down there. I want to see a reaction — not just a touch. A reclaim. A shift in control. That’s when I act.
This zone isn’t random. It’s built on order flow and inefficiency — where price previously moved too fast, leaving imbalances behind. If we return there with intent, the bounce could be aggressive.
“I will not insist on my short idea. If the levels suddenly break upwards and do not give a downward break in the low time frame, I will not evaluate it. If they break upwards with volume and give a retest, I will look long.”
That applies here too. If we never reach the blue box, or if the move back into it lacks confirmation — I don’t touch it. No signal, no entry. That simple.
🧠 If you ignore this zone and price rockets without you — that’s fine. But if it hits the blue box cleanly and you hesitate, that’s on you.
As someone who’s watched this pattern unfold more times than I can count… this is where smart money loads, not where it exits.
Let’s see if we get the dip. If we do, and it reacts the way I expect — this could be the move.
📌I keep my charts clean and simple because I believe clarity leads to better decisions.
📌My approach is built on years of experience and a solid track record. I don’t claim to know it all but I’m confident in my ability to spot high-probability setups.
📌If you would like to learn how to use the heatmap, cumulative volume delta and volume footprint techniques that I use below to determine very accurate demand regions, you can send me a private message. I help anyone who wants it completely free of charge.
🔑I have a long list of my proven technique below:
🎯 ZENUSDT.P: Patience & Profitability | %230 Reaction from the Sniper Entry
🐶 DOGEUSDT.P: Next Move
🎨 RENDERUSDT.P: Opportunity of the Month
💎 ETHUSDT.P: Where to Retrace
🟢 BNBUSDT.P: Potential Surge
📊 BTC Dominance: Reaction Zone
🌊 WAVESUSDT.P: Demand Zone Potential
🟣 UNIUSDT.P: Long-Term Trade
🔵 XRPUSDT.P: Entry Zones
🔗 LINKUSDT.P: Follow The River
📈 BTCUSDT.P: Two Key Demand Zones
🟩 POLUSDT: Bullish Momentum
🌟 PENDLEUSDT.P: Where Opportunity Meets Precision
🔥 BTCUSDT.P: Liquidation of Highly Leveraged Longs
🌊 SOLUSDT.P: SOL's Dip - Your Opportunity
🐸 1000PEPEUSDT.P: Prime Bounce Zone Unlocked
🚀 ETHUSDT.P: Set to Explode - Don't Miss This Game Changer
🤖 IQUSDT: Smart Plan
⚡️ PONDUSDT: A Trade Not Taken Is Better Than a Losing One
💼 STMXUSDT: 2 Buying Areas
🐢 TURBOUSDT: Buy Zones and Buyer Presence
🌍 ICPUSDT.P: Massive Upside Potential | Check the Trade Update For Seeing Results
🟠 IDEXUSDT: Spot Buy Area | %26 Profit if You Trade with MSB
📌 USUALUSDT: Buyers Are Active + %70 Profit in Total
🌟 FORTHUSDT: Sniper Entry +%26 Reaction
🐳 QKCUSDT: Sniper Entry +%57 Reaction
📊 BTC.D: Retest of Key Area Highly Likely
📊 XNOUSDT %80 Reaction with a Simple Blue Box!
📊 BELUSDT Amazing %120 Reaction!
📊 Simple Red Box, Extraordinary Results
I stopped adding to the list because it's kinda tiring to add 5-10 charts in every move but you can check my profile and see that it goes on..

XAUUSDHey traders!
The second trade of the day comes from XAUUSD (Gold).
Yesterday, due to Trump’s recent remarks about agreements with China, gold saw a significant pullback. However, I believe this drop—whether short-term or long-term—is temporary. In fact, from a macro perspective, I still see gold potentially reaching levels like $3600 in the long run.
But as a day trader, I always aim for setups with 1:1.50 or 1:2 risk-to-reward ratios. That’s my focus. Long-term expectations don’t impact my short-term executions.
🔍 One important note: My signals are often sniper entries, and that’s no coincidence. I closely monitor order flow and volume-based price movements. That’s why, if the price starts moving sideways (ranging) after my entry, I tend to manually close the position to protect capital.
🔍 Criteria:
✔️ Timeframe: 15M
✔️ Risk-to-Reward Ratio: 1:2
✔️ Trade Direction: Buy
✔️ Entry Price: 3255.39
✔️ Take Profit: 3265.55
✔️ Stop Loss: 3250.16
🔔 Disclaimer: This is not financial advice. It's a trade I’m taking based on my own system, shared purely for educational purposes.
📌 If you're also interested in systematic and data-driven trading strategies:
💡 Don’t forget to follow the page and subscribe to stay updated on future analyses.

GOLD Correction Complete - Rally Toward $3,450 AheadOANDA:XAUUSD is trading within a well-defined ascending channel, signaling ongoing bullish momentum. The price has continued to respect the channel structure, printing higher highs and higher lows, a clear sign of an intact uptrend. The recent retracement represents a healthy correction, potentially setting the stage for another bullish leg.
Price is now approaching a key support zone, marked by the lower boundary of the channel and a previous demand area. If this zone holds, it may offer a strong re-entry opportunity for buyers. The projected upside target is $3,450, which aligns with both the midline of the ascending channel and a previous resistance level.
As long as the price remains above the support zone and the ascending trendline, the bullish scenario remains valid. A break below this level, however, could invalidate the setup and increase the likelihood of a deeper retracement.
Always confirm your setups and trade with a proper risk management.
Best of luck!

Today's gold trend analysis, go long in batches🗞News side:
1. China-US trade relations eased, suspending some tariffs and countermeasures
2. Russia and Ukraine suspended firing for 30 days, and the India-Pakistan conflict was temporarily mediated
📈Technical aspects:
Since the US and China lowered some tariffs after the negotiation, the US dollar has recovered some of its losses, but gold has not completely recovered some of its losses. At present, the price of gold has once again retreated to near the 3260 line. Although the hourly level MACD indicator shows a golden cross, the daily level is still a dead cross and heavy volume.
Then in the short term, the gold price may show some counter-twitching momentum before the US dollar steps back to confirm support, or it may touch near the 3277 line. The gold price may fall further after the US dollar steps back to confirm the support. From a technical point of view, the upper daily resistance is near 3287, while the lower first-line support of 3200 is strong, and there is a tendency to form a double bottom. The European market can consider using 3250-40 US dollars as a support point, and the early trading low near 3220 as a defensive position. First, let's see the gold price continue to rebound to 3277-80-87, unless the European market weakens and breaks the Asian low, and then the US market adjusts. Temporarily, we will see a rebound correction.
If you agree with this view, or have a better idea, please leave a message in the comment area. I look forward to hearing different voices.
FOREXCOM:XAUUSD FXOPEN:XAUUSD TVC:GOLD FX:XAUUSD OANDA:XAUUSD

CPI-Inflation Assessment, Gold Accumulation
📌 Drivers
In geopolitics, Indian Prime Minister Narendra Modi said on Monday that military action against Pakistan was only paused, warning that future actions would depend on Islamabad's position. Meanwhile, Ukrainian President Volodymyr Zelensky expressed his willingness to meet with Russian President Vladimir Putin later this week after U.S. President Donald Trump called on Zelensky to "immediately" accept an invitation to a peace summit in Turkey. These developments have heightened geopolitical risks, which could boost demand for safe-haven assets such as gold, thereby enhancing the appeal of gold amid continued global uncertainty.
📊Comment Analysis
CPI evaluates the inflation level of the US economy, and the price of gold continues to strive to maintain a price range of around 3200
💰Strategy Package
🔥Selling gold area: 3281-3283 SL 3288
TP1: $3270
TP2: $3260
TP3: $3250🔥
Buying gold area: $3176 - $3174 SL $3169
TP1: $3185
TP2: $3198
TP3: $3210⭐️
Labaron believes
Guaranteeing the principal is the bottom line for survival, controlling risks is the armor for survival, earning profits is a stage medal, and long-term stable and continuous profits are the only proof that can finally stand up from the sea of corpses and blood.


(XAU/USD) Bearish Trade Setup – Targeting $3,222 with 1:6 Risk/REntry Point: Around 3,409.33 - 3,408.41 USD.
Stop Loss: 3,437.87 USD.
Target (Take Profit): 3,222.53 USD.
Risk/Reward Ratio: Approximately 1:6, which is favorable.
📉 Price Action & Trend Analysis:
A rising wedge (or channel) appears to have formed and broken to the downside — a bearish signal.
The current price at 3,341.47 has broken below a minor support zone (highlighted in purple), indicating bearish momentum.
Price is now approaching the 200 EMA, which is acting as potential dynamic support.
📌 Key Levels Highlighted:
Support Zones: Near 3,347.47 (previous minor support) and 3,222.53 (main target zone).
Resistance Zones: At the entry level and above, near 3,437.87 (Stop Loss zone).
🔄 Indicators:
Moving Averages (Red and Blue Lines): Shorter-term moving average (red) is below the longer-term (blue), indicating downward pressure.
Momentum Shift: The sharp drop suggests a likely continuation of the bearish trend.

The tariff storm has subsided and gold has plummeted!
The tariff storm has come to an end, and gold has plummeted. At 3 o'clock today, gold plummeted by more than 40 US dollars in 10 minutes in the short term, because the tariff storm has ended, and China and the United States will only impose a 10% base tariff. So the so-called tariff storm of more than 100 points by all parties has ended. At present, it is no longer good for gold in terms of the trade war, and the short-term plunge has been encountered long ago!
At the same time, this point, coupled with the hawkish "holding troops" of the Federal Reserve, helped the US dollar to stabilize near the highs of several weeks and put pressure on gold. It also became the fuse for a new round of gold price selling. In addition, the current situation in the Middle East countries has temporarily begun to mediate, and the difficulty of maintaining risk aversion makes it difficult for buyers to enter the market again!
How to enter the market after the plunge?
After the market plummeted across the board, from a technical point of view, the oscillator indicators on the hourly chart have been gaining negative traction and supporting the prospect of further declines in gold prices during the session. Coupled with the current continued selling of gold, a position that needs to be focused on in the European session is around 3200. If it falls below this position decisively, it will pave the way for the weekly retracement trend.
At present, since the mid-term short orders I have arranged have been profitable and exited, if I want to gamble again, I need to pay close attention to the position of 3200. Breaking down and rebounding from support will usher in different market crazes and long-short games. The market fluctuates violently, and real-time entry is mainly based on real trading!

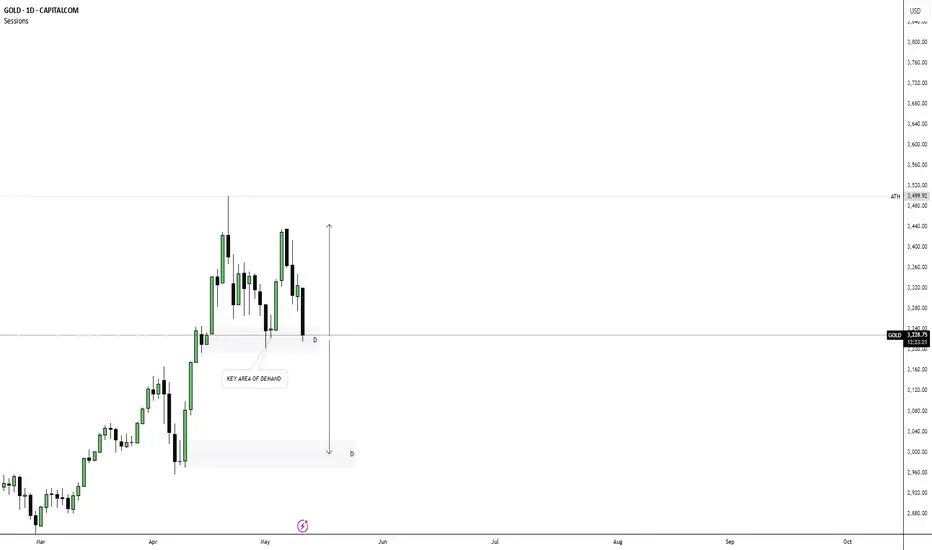
GOLD ANALYSIS💸GOLD💸
Chart Timeframe: DAILY
Overall Trend: Bullish
Current Market Structure: Bearish
Scenario 1 :
Price is at a current demand area , if we do not respect this level at 3210 & We break and close below it .
We can anticipate price to move to the downside , Targeting the imbalance in the market at 3000 .
The golden earthquake storm is coming!In terms of news: Major events over the weekend include the conflict between Russia and Ukraine, the sudden change in the situation between India and Pakistan, and the progress of Sino-US negotiations: Although India and Pakistan announced a truce, India's surprise attack turned the agreement into a joke. The high-level economic and trade talks between China and the United States are still continuing in Geneva, and it is difficult to have clear results in the short term. The war between Russia and Ukraine is still in a stalemate. The superposition of multiple events has injected uncertainty into the market.
Technical aspects:
Pay attention to the pressure in the 3360-3380 area. If it stands firm at 3346, it can fall back to arrange long orders. If it directly breaks below 3300 at the opening, pay attention to the support near 3280 - this position is likely to be lost, and effective support depends on the downward pattern formed after the 3260 break, and the ultimate target is 3200.