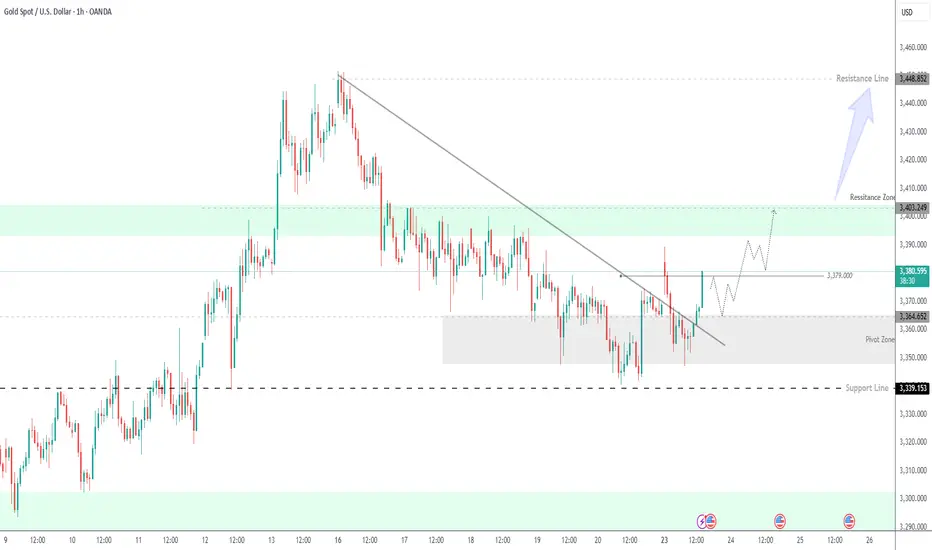
GOLD Outlook: Bullish Above 3379, Correction Likely BelowGOLD – Technical Overview
Gold maintains bullish momentum, driven by heightened geopolitical tensions in the Middle East, which are increasing safe-haven demand.
The price is approaching the pivot level at 3379. A confirmed 1-hour close above this level would likely extend the bullish trend toward 3393 and 3404.
However, if the price remains below 3379, we may see a short-term bearish correction toward 3364, potentially dipping as low as 3339 before resuming the upward trend.
Key Levels
• Pivot: 3379
• Resistance: 3393, 3404
• Support: 3364, 3339
Goldlong
XAUUSD – Is Gold About to Break Out of Balance? Market Overview As the U.S. dollar maintains its upward momentum fueled by expectations that the Federal Reserve will keep interest rates elevated for an extended period, gold (XAUUSD) is currently trading near the key Point of Control (POC) for June. The consolidation around the $3,350–$3,360 zone indicates a temporary balance of supply and demand, and the market appears to be gearing up for a strong directional breakout in the upcoming sessions.
Detailed Technical Analysis ✅ Volume Profile & Price Structure
POC (highest volume level): $3,360 – the central volume area for the week/month
Current price: $3,353 – just below the POC, reflecting selling pressure dominance
Price is reacting to the demand zone at $3,343–$3,345, with significant volume support below
Short-term reversal signals from ParLE and ParSE indicators suggest a potential market shift
🔍 Key Resistance Levels:
$3,360 – POC and immediate resistance zone
$3,398 – previous supply zone with strong rejection history
$3,451 – Fibonacci extension high and the strongest resistance for the month
🔍 Key Support Levels:
$3,345 – high-volume support cluster
$3,343 – Fibonacci and dynamic support zone
$3,276 – final support before mid-term structure breakdown
🎯 XAUUSD Trading Strategy for Today (June 23, 2025) 🔻 Primary Scenario: SHORT based on short-term bearish structure
Entry: $3,358–$3,360 (on POC retest + bearish rejection candle)
Stop Loss: $3,370
Take Profits:
TP1: $3,345
TP2: $3,343
TP3: $3,327
Probability: High, if price remains below POC
🔺 Alternative Scenario: LONG if price holds $3,343 support
Entry: $3,343–$3,345 (strong bullish candlestick setup in demand zone)
Stop Loss: $3,330
Take Profits:
TP1: $3,360 (POC)
TP2: $3,383
TP3: $3,398
⚠️ Risk Warning & Macro Factors to Watch
The USD Index is surging – applying downward pressure on gold
Fed's short-term rate projections (FedWatch Tool) reflect “no cut” expectations through Q3
Traders should maintain tight risk management within high-volume zones to avoid false breakouts
Follow @Henrybillion ” to stay updated with the most accurate and actionable XAUUSD trading ideas every day!

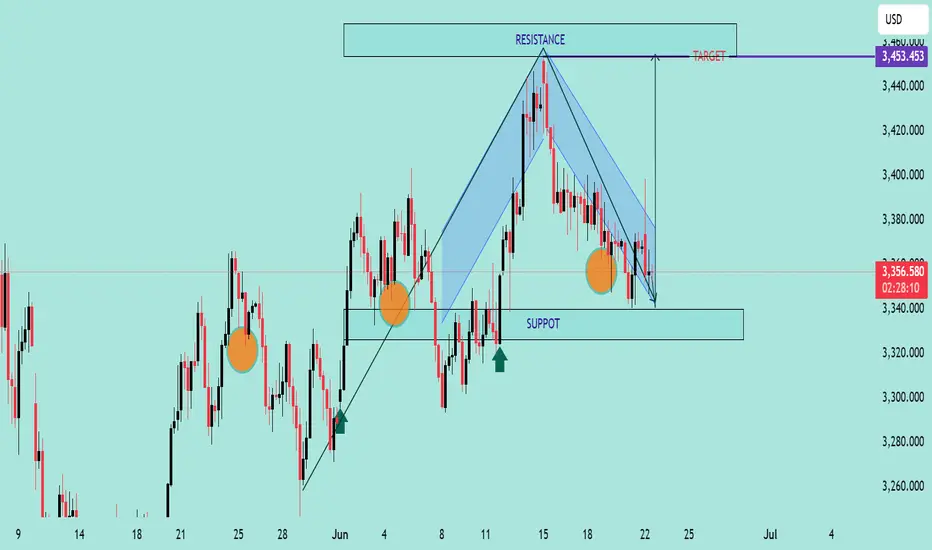
GOLD/USD Falling Wedge Breakout PotentialChart Analysis:
The chart illustrates a Falling Wedge Pattern, a bullish reversal setup typically signaling a breakout to the upside.
📌 Key Observations:
📉 Downward Channel: Price has been compressing within a falling wedge (highlighted in blue), indicating potential exhaustion of sellers.
💪 Support Zone: Strong support observed near the 3,340 level, with price rejecting this zone multiple times (highlighted with orange circles).
🔼 Bullish Signals: Price recently tested the lower wedge boundary and bounced, suggesting potential reversal.
🎯 Breakout Target: Projected target after breakout is around 3,453.453 USD, aligned with previous resistance zone.
🟢 Buy Pressure Arrows: Green arrows signal previous bullish reactions from similar demand zones.
📈 Conclusion:
If price breaks above the wedge’s upper boundary with volume confirmation, a bullish rally toward 3,453 is expected. Keep an eye on breakout retest for entry validation.
✅ Trading Plan Suggestion:
Entry: On breakout above wedge resistance
SL: Below recent swing low (~3,330)
TP: 3,453 zone 🎯
🔔 Note: Wait for a confirmed breakout before entering to avoid false signals.
Gold Spot (XAU/USD) $3400 Incoming again??Gold Spot (XAU/USD) – 1H Chart:
Chart Overview:
Overall Market Context:
Gold is currently retracing after a strong downtrend from a swing high near the supply zone. Price is reacting near a key bullish trend line and a local swing low.
Key Technical Elements:
OBV (On-Balance Volume):
The OBV has broken out of its downtrend resistance, suggesting a potential reversal in volume flow.
This shift implies bullish momentum could be building.
Trendline & Structure:
Price is respecting a bullish trend line, which has acted as dynamic support across multiple touches.
The current swing low sits right on this trend line, suggesting a possible bounce scenario.
Fair Value Gaps (FVGs) – 4H:
Two FVGs are located above current price around the 0.28–0.5 Fibonacci zone, indicating a likely magnet area if price starts to retrace upward.
These FVGs may act as short-term targets or resistance zones.
Fibonacci Retracement:
Price is currently near the 0.618–0.65 retracement zone, a classic golden pocket reversal area.
If price holds this level, a bounce toward the FVGs and supply zone is likely.
Supply Zone:
The major resistance sits above at the supply zone formed around the previous swing highs.
A rejection here could signal a return to range or continuation lower if not broken.
Demand Zone :
Below current price, a strong demand zone is marked, which historically triggered a large upward move.
If price fails to hold the trendline/swing low, this would be the next key support area to watch.
Scenarios:
🔼 Bullish Case:
OBV breakout holds and price bounces from the trendline/swing low.
Price moves up into the FVG zones and attempts to reclaim the previous swing high.
If it breaks above the supply zone, the next logical targets would be the psychological levels (e.g., $3,400+).
🔽 Bearish Case:
Failure to hold the current trendline and swing low.
Break below could lead to a move toward the demand zone, possibly sweeping lows and filling deeper FVGs.
If volume remains weak on bounce attempts, continuation of the downtrend is likely.
Summary:
Gold is at a critical inflection point. The bullish trendline and swing low offer a potential reversal area, supported by a breakout in OBV. A recovery into the FVGs above looks likely if price can maintain this level. However, failure here would lead to a drop toward the demand zone. Traders should monitor volume, OBV continuation, and price action near FVGs for confirmation.

GOLD Intraday H1 Chart Update For 23 June 25 GOLD Intraday Chart show mid term Bearish move for now
For Today keep an eyes on 3368 level Breakout for Buy Scalping for long trade we may wait for dip around 3330-3340 zone SL remains possibly 100 pips
As long as market sustains below 3400 Psychological Level it will remains Bearish and will try to move towards 3200-30 Psychological

Gold Set to Rise If U.S.–Iran Tensions Escalate📊 Market Overview:
Gold traded within a volatile range this past week, hovering between $3,360 and $3,385/oz. The U.S. dollar weakened on expectations that the Fed will maintain current interest rates in July, while persistent inflation concerns globally have kept gold supported. However, a geopolitical shock emerged late in the week: President Donald Trump announced readiness to deploy troops to the Middle East if Iran continues provocation, raising the possibility of serious military escalation.
📉 Technical Analysis:
•Key Resistance Levels: $3,387 – $3,403 (weekly highs), $3,450, and extended targets at $3,500–$3,520.
•Nearest Support: $3,358 – $3,365 (lower bound of the bullish channel), then $3,344 and $3,320.
•EMA09: Price remains above EMA 09, confirming a short-term uptrend on both 4H and daily charts.
•Chart Pattern: On the H4 chart, a Bullish Flag/Wedge Breakout is forming. A solid hold above $3,360 and breakout above $3,387 may trigger a strong upward move.
📌 Outlook:
Gold is likely to break higher next week if U.S.–Iran tensions escalate into direct conflict. Safe-haven demand could surge, driving gold toward $3,450 or even $3,500/oz.
On the other hand, if tensions ease and the U.S. dollar recovers on strong economic data, gold may pull back to $3,344–$3,320 before resuming any uptrend.
💡 Suggested Trading Strategy
🔺 BUY XAU/USD
Entry: $3,358–3,365
🎯 TP: $3,387 / $3,403 / $3,450
🛑 SL: $3,344
🟡 Enter on pullback to support — preferably if geopolitical tensions rise.
🔻 SELL XAU/USD
Entry: $3,400–3,410 (if price becomes overbought, RSI > 70)
🎯 TP: $3,380 / $3,365
🛑 SL: $3,420
🟡 Only apply this if tensions de-escalate and the U.S. dollar strengthens.

gold bullish trading ideagold f3345ollow bullish channel gold make higher high and higher low now gold malke high high 3345

Gold Trade Setup - 22/Jun/2025Hi Traders,
I expect this pair to go Up after finishing the correction.
1) We are in uptrend and potentially correcting for further upside.
2) The current move can be just a part of a intermediate correction or can even go to break the top.
How to Enter : Look for engulfing with in the SL zone.

GOLDGOLD seems to be going upwards due to unrest in the world. Pullback is your opportunity for further upside.
Disclosure: We are part of Trade Nation's Influencer program and receive a monthly fee for using their TradingView charts in our analysis.

GOLD 1H CHART ROUTE MAP UPDATE & TRADING PLAN FOR THE WEEKHey Everyone,
Please see our updated 1h chart levels and targets for the coming week.
We are seeing price play between two weighted levels with a gap above at 3376 and a gap below at 3348. We will need to see ema5 cross and lock on either weighted level to determine the next range.
We will see levels tested side by side until one of the weighted levels break and lock to confirm direction for the next range.
We will keep the above in mind when taking buys from dips. Our updated levels and weighted levels will allow us to track the movement down and then catch bounces up.
We will continue to buy dips using our support levels taking 20 to 40 pips. As stated before each of our level structures give 20 to 40 pip bounces, which is enough for a nice entry and exit. If you back test the levels we shared every week for the past 24 months, you can see how effectively they were used to trade with or against short/mid term swings and trends.
The swing range give bigger bounces then our weighted levels that's the difference between weighted levels and swing ranges.
BULLISH TARGET
3376
EMA5 CROSS AND LOCK ABOVE 3376 WILL OPEN THE FOLLOWING BULLISH TARGETS
3395
EMA5 CROSS AND LOCK ABOVE 3395 WILL OPEN THE FOLLOWING BULLISH TARGET
3419
EMA5 CROSS AND LOCK ABOVE 3419 WILL OPEN THE FOLLOWING BULLISH TARGET
3440
BEARISH TARGETS
3348
EMA5 CROSS AND LOCK BELOW 3348 WILL OPEN THE SWING RANGE
3330
3306
EMA5 CROSS AND LOCK BELOW 3306 WILL OPEN THE SECONDARY SWING RANGE
3288
3271
As always, we will keep you all updated with regular updates throughout the week and how we manage the active ideas and setups. Thank you all for your likes, comments and follows, we really appreciate it!
Mr Gold
GoldViewFX

Gold Weekly Friday Trend Analysis and Trading RecommendationsOn Thursday, gold maintained a sideways trend, currently trading near $3,370. It hit a low of $3,347 and then rebounded immediately, while yesterday's Federal Reserve interest rate decision had little impact on market volatility. Since Monday, when bearish forces were stronger than bullish ones, the gold market has been seeing equalized bullish and bearish forces, consolidating as it waits for the next stimulus direction.
Once it stabilizes above $3,400 again, there is likely to be an inflection point, and it will gradually rise to test the upper track at $3,460–3,470. At the 4-hour level, it is currently under pressure at the middle track of $3,405, with support at $3,345.
Gold may break out of the current range on Friday. Intraday trading can focus on range operations between the support of $3,345 and the resistance of $3,400: when the gold price stabilizes above $3,360, you can lightly go long, with targets sequentially at $3,375 and $3,395; if it is resisted below $3,395, you can try to lightly go short.
XAUUSD
buy@3350-3360
tp:3380-3390-3400
Investment itself is not the source of risk; it is only when investment behavior escapes rational control that risks lie in wait. In the trading process, always bear in mind that restraining impulsiveness is the primary criterion for success. I share trading signals daily, and all signals have been accurate without error for a full month. Regardless of your past profits or losses, with my assistance, you have the hope to achieve a breakthrough in your investment.

The rebound is weak, is it expected to continue to decline? 📰 Impact of news:
1. Geopolitical situation
2. Pay attention to the impact of short-term trends of the US dollar and silver on gold
📈 Market analysis:
The weekly level large range sweep is still going on, with a focus on the space defense dividing line area of the 10-day moving average and the 3315-3310 area. After falling back to the lifeline in four hours, it continued to bend downward under pressure. During the sweeping decline, the suppression became more obvious. Whether there will be a wave of large-volume market, the pattern is expected to further open and guide the direction. In this process, note that the lifeline 3375 is also the resistance point determined by the last rebound last night. Use this as suppression to sweep the range below. On the whole, for the future gold, if it can maintain the rhythm of defending highs and breaking lows, and successfully closes at a low level today, then next week it is expected to further switch downwards to sweep space. Therefore, we will continue to focus on two support areas, one is 3345-3335, and the other is 3315-3310 after breaking
🏅 Trading strategies:
BUY 3345-3335
TP 3355-3365
SELL 3365-3375
TP 3345-3335-3315
If you agree with this view, or have a better idea, please leave a message in the comment area. I look forward to hearing different voices.
TVC:GOLD FXOPEN:XAUUSD FOREXCOM:XAUUSD FX:XAUUSD OANDA:XAUUSD

Gold Rebounds from Support, Eyes Breakout Above 3,370📊 Market Dynamics:
– Gold briefly dipped to 3,344 this morning before rebounding to 3,355 as of now.
– The USD is steady after cautious Fed commentary, while geopolitical tensions continue to support safe-haven flows into gold.
📉 Technical Analysis:
• Key resistance: 3,370 – 3,380
• Immediate support: 3,344 – 3,340
• EMA: Price remains above EMA 09, signaling continued short-term bullish bias.
• Patterns / Momentum: A bullish engulfing pattern formed on the H1 chart at 3,344.
📌 Outlook:
Gold may continue to rebound toward 3,370–3,380 in the short term. A break above 3,380 could open the path to 3,400.
💡 Trading Strategies:
🔻 SELL XAU/USD at: 3,375 – 3,380
🎯 TP: 3,355 – 3,360
❌ SL: 3,385
🔺 BUY XAU/USD at: 3,344 – 3,348
🎯 TP: 3,365 – 3,370
❌ SL: 3,335

Gold XAUUSD Possible Move🚨 Trade Setup Alert
📍 H1 Orderblock Zone at 3330–3320
🔑 High-probability BUY setup after liquidity sweep 🟢
🎯 Target: 3362 and possibly 3396+
🛑 SL below 3315
📍 Mitigated Supply Zone at 3396–3400
🔻 Possible SELL setup if price rejects that level 🔴
🎯 Target: 3365 / 3340
🛑 SL above 3412
⚠️ Key Level: 3362–3365 must break to reach upper supply zone.
✅ A level viz. 3340 shared yesterday, I bought from 3340 and bagged +180 pips 💸
👀 Watch price action closely near these zones for confirmation.
📊 Trade with proper risk management! 💼
Gold Eyes Breakout from Ascending Channel Toward $3,500📈 Chart Analysis
1. Rising Channel Structure
Gold (XAU/USD) has been trading within an upward-sloping channel, marked by the blue trendlines connecting interior lows and highs, culminating at point C (~$3,497). The latest bounce off the lower channel near “B” reinforces bullish bias – if this trendline holds, another leg higher toward resistance around $3,497–$3,500 is likely.
2. Support & Resistance Confluence
The purple trendline and the dotted horizontal green level (~$3,498) converge near the projected breakout point. This synergy provides a strong pivot zone — a successful breakout would validate targets near channel highs.
3. Harmonic Pattern in Play
The chart displays a bullish harmonic structure (likely a Bat or Gartley formation), with retracement ratios (0.719, 1.627) anchoring reversal areas. These reinforce the bounce at B and the potential move toward point C.
4. Trade Scenarios
Bullish Scenario (primary): A bounce off the trendline triggers a rally to the channel top and resistance zone ($3,497–$3,500).
Bearish Caution: A drop below the trendline invalidates the pattern, potentially bringing prices back to horizontal support around $3,296 or even $3,120, as indicated at point A.
🛠️ Technical & Market Context
Technicals: Daily trend remains bullish as long as price holds above ~$3,340–$3,350, with resistance forming in the $3,380–$3,400 range
Fundamentals: Geopolitical tension (e.g., Middle East conflict) and safe-haven inflows continue to underpin gold — though Citi expects prices to eventually correct toward $3,300–$3,500 mid‑term
.
Sentiment: Some analysts advocate “selling the rallies,” especially into the $3,450–$3,500 zone . But central banks’ ongoing buying and potential Fed rate cuts support a stronger floor
.
✅ Trade Strategy
Scenario Entry Zone Target Stop Loss Placement
Play the Bounce ~$3,350–$3,360 $3,497–$3,500 Below trendline near B zone (~$3,320)
Breakout Trade On momentum above $3,400 $3,497–$3,550 Below breakout (sub-$3,380)
Bearish Trigger Break & close below trendline Back to $3,296 / 3,120 Just above trendline ($3,360)
🔍 Summary
Gold remains in a structurally bullish setup inside an ascending channel. The confluence of harmonic reversal, strong trendline support, and pending fundamental catalysts presents a high-probability opportunity to push toward the $3,500 area—provided the trendline and $3,340–$3,350 support hold. A drop below would invalidate the bullish outlook and favor deeper retracement.

The bear market is over? Short at high and long at low📰 Impact of news:
1. The interest rate remains unchanged and leads to new lows in the short term
2. Geopolitical tensions provide support for risk aversion
📈 Market analysis:
Due to the early closing yesterday, the volatility of the US market was limited and the market seemed relatively flat. From a technical perspective and the current trend, 3340 is a key defensive support level. If it retreats to this level, you can consider going long. If the gold price continues to rise and reaches 3375, from the perspective of trading strategy, you can choose to place a short order here. Focus on the resistance line of 3370-3375 during the day, and pay attention to the support of 3345-3335 below.
🏅 Trading strategies:
SELL 3370-3375
TP 3360-3355-3345
BUY 3345-3335
TP 3360-3370
If you agree with this view, or have a better idea, please leave a message in the comment area. I look forward to hearing different voices.
OANDA:XAUUSD FX:XAUUSD FOREXCOM:XAUUSD FXOPEN:XAUUSD TVC:GOLD

GOLD H1 Intraday Chart Update For 20 JUNE 25Hello Traders we are now at closing day of the week, for today market expected is in tight range and better to wait for closing of the week
strong resistance for the day is 3382 level while strong support for the day is 3333
scalping range for today is 3340-3375
Disclaimer: Forex is Risky

XAU/USD Technical Analysis 📊 XAU/USD Technical Analysis (June 18, 2025)
🟢 Current Market Overview
Price: $3,381.19
The market is currently trading within a defined range, showing consolidation above a strong support zone.
🔍 Key Technical Levels
Support Zone: $3,360 – $3,375
This level has been tested multiple times and held firmly, indicating strong buying interest 📈.
Resistance Zone: $3,435 – $3,455
Price has previously rejected this zone, suggesting active sellers in this area ⚠️.
🧠 Price Action Insight
The recent price structure shows a pullback into support after a strong bullish move.
The current consolidation suggests accumulation before a potential breakout.
A bullish reversal pattern seems to be forming near support, pointing toward a possible rally toward resistance.
📈 Projected Move
📍 Scenario: Bounce from support zone → Break toward resistance.
The marked projection curve suggests price may retest support, then rally to the $3,440–$3,455 resistance area.
🧾 Trading Outlook
Bias: Bullish (above $3,360)
Entry Zone: $3,365 – $3,375
Target: $3,440 – $3,455
Invalidation: Break and close below $3,355 (would indicate weakness) 🚫
📅 Fundamental Context
Multiple high-impact USD events are approaching 🇺🇸 (noted at the bottom of the chart). These could cause volatility and may act as catalysts for the breakout.
✅ Conclusion
The market is currently in a bullish accumulation phase above strong support. As long as this level holds, a move toward the resistance zone remains the high-probability scenario. Monitor closely for confirmation via bullish candlesticks or volume increase.

Gold: update hello friends✋️
According to the recent growth of gold, you can see that it is constantly resisting and forming a falling pattern.
For this reason, it can be a warning that the fall can continue and the price will fall to the specified limits.
🔥Follow us for more signals🔥
*Trade safely with us*

GOLD ROUTE MAP UPDATEHey Everyone,
Once again our levels deliver the magic!!
Yesterdays update, we stated that we got the move into 3393 just like we analysed for the first level of swing and that we will now look for ema5 to cross and lock 3372 or 3393 to confirm direction.
🔄 Update:
No ema5 lock above 3393 confirmed the rejection into 3372 followed with ema5 cross and lock opening the full swing range test into 3353. We got the test and the perfect bounce back into 3372. A move into 3393 will complete the full swing range.
We will keep the above in mind when taking buys from dips. Our updated levels and weighted levels will allow us to track the movement down and then catch bounces up.
We will continue to buy dips using our support levels, taking 20 to 40 pips. As stated before, each of our level structures gives 20 to 40 pip bounces, which is enough for a nice entry and exit. If you back-test the levels we shared every week for the past 24 months, you can see how effectively they were used to trade with or against short/mid-term swings and trends.
🌀 The swing ranges give bigger bounces than our weighted levels - that's the difference between the two.
BULLISH TARGET
3440 - DONE
EMA5 CROSS AND LOCK ABOVE 3340 WILL OPEN THE FOLLOWING BULLISH TARGETS
3463
EMA5 CROSS AND LOCK ABOVE 3463 WILL OPEN THE FOLLOWING BULLISH TARGET
3483
EMA5 CROSS AND LOCK ABOVE 3483 WILL OPEN THE FOLLOWING BULLISH TARGET
3508
BEARISH TARGETS
3418 -DONE
EMA5 CROSS AND LOCK BELOW 3418 WILL OPEN THE FOLLOWING BEARISH TARGET
3393 - DONE
EMA5 CROSS AND LOCK BELOW 3393 WILL OPEN THE SWING RANGE
3372 - DONE
3353 - DONE
EMA5 CROSS AND LOCK BELOW 3353 WILL OPEN THE SECONDARY SWING RANGE
3330
3306
As always, we will keep you all updated with regular updates throughout the week and how we manage the active ideas and setups. Thank you all for your likes, comments and follows, we really appreciate it!
Mr Gold
GoldViewFX

buy in GOLD ??After gold reached a strong support area and was successfully confirmed, I think it is good to take a buy trade.

The market is closed today. How to arrange gold in the evening?📰 Impact of news:
1. The interest rate remains unchanged and leads to new lows in the short term
2. Geopolitical tensions provide support for risk aversion
📈 Market analysis:
The market is expected to not fluctuate much today. Generally speaking, it is difficult to stand on one foot to form a short-term bottom. There should be a second wave of bottom exploration, a secondary low point, and then the bottom is explored and pulled up to break through the previous high point. Only then can the turning point be officially established and the decline end. Moreover, the 1H moving average is spreading downward. Therefore, in the short term, we still pay attention to the 3375-3385 line of resistance and the 3360-3355 line of support below.
🏅 Trading strategies:
SELL 3375-3385
TP 3365-3360-3355
BUY 3360-3355
TP 3370-3380-3405-3420
If you agree with this view, or have a better idea, please leave a message in the comment area. I look forward to hearing different voices.
TVC:GOLD FXOPEN:XAUUSD FOREXCOM:XAUUSD FX:XAUUSD OANDA:XAUUSD

GOLD/USD Support Retest & Breakdown SetupGOLD/USD Support Retest & Breakdown Setup 📉🔍
🔹 Overview:
The chart indicates a potential bearish continuation pattern on GOLD/USD as the price is approaching a key support level at 3,335.305. Previous price action shows multiple rejections from the resistance zone (~3,435), followed by lower highs – a sign of weakening bullish momentum.
📊 Technical Analysis:
🔺 Resistance Zone (~3,435)
Multiple rejections (🔴 red arrows) indicate strong supply pressure.
Price has failed to break above this area thrice, forming a clear ceiling.
🔻 Support Zone (~3,335)
Marked as the target for a short setup.
Price is testing this level again after forming a minor consolidation below lower highs.
A clean break below this purple zone may trigger a continuation to the downside, targeting the broader support range below (~3,240).
🟠 Bearish Structure:
Series of lower highs (highlighted with circles).
Breakdown pattern is developing with declining bullish momentum.
📈 Potential Play:
A confirmed breakdown below 3,335 could lead to a drop toward the next major support.
If support holds, short-term bounce is possible but limited by the dominant resistance.
📌 Conclusion:
GOLD/USD is currently in a bearish setup, with the market eyeing a potential breakdown below a critical support zone. If this level fails to hold, we could see accelerated bearish momentum toward the lower support range.
💡 Caution: Wait for a confirmed close below support before entering any short trades.

XAU/USD) Back Bullish trand Read The captionSMC Trading point update
Technical analysis of Gold (XAU/USD) on the 3-hour timeframe based on a price action setup within a rising channel and a key support zone. Here's a breakdown of the analysis:
---
Technical Overview:
Trend Structure:
The price is moving within a rising channel (marked by the black trendlines). Recent touches on both the top and bottom of the channel suggest that it is being respected.
Key Support Zone (Yellow Box):
Price recently tested a strong support zone around $3,338 – $3,350, which aligns with:
Historical price reaction area.
The 200 EMA (blue line).
An uptrend line support.
A bullish reaction (green arrow) confirming demand.
Bear Trap Breakout:
There’s a false breakout below the support followed by a sharp reversal (green arrow), which could indicate a bear trap, often followed by a bullish rally.
Price Projection:
The projected move suggests a bullish rally toward $3,478.89, offering a potential 3.97% gain (~133 points).
The path includes a possible consolidation before a breakout (illustrated by the wavy arrow).
RSI Indicator:
RSI is recovering from the oversold zone (~45), indicating increasing bullish momentum.
Mr SMC Trading point
---
Trade Idea Summary:
Bias: Bullish
Entry Zone: Around $3,350–$3,370 (post-retest of support)
Target: $3,478.89
Confirmation: Bullish price action at support, 200 EMA bounce, RSI reversal
---
Please support boost 🚀 this analysis)
