Gold bottomed out and rebounded, and gold is still rising!The latest news indicates that Trump has announced a 50% tariff on Brazilian products and a 25% tariff on Indian products, and has firmly stated that the tariffs will take effect on August 1st, with no further grace period. These positive factors will also support a rebound in gold.
As for tomorrow's big non-farm payrolls, considering that both the previous two times were negative and contrary to the ADP, it is very likely to be bullish for gold, which may help boost a steady rebound in gold, so there is no need to worry if you are stuck with gold.
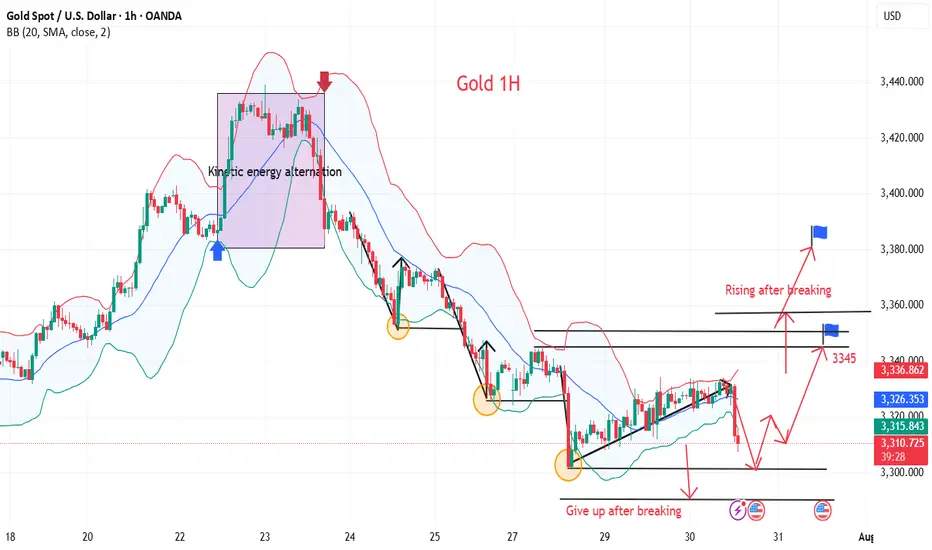
Nothing rises forever, and nothing falls forever. Last week, the market rose in the first half, then fell in the second half. With the first half of this week's decline, the daily chart has already fallen to near the 100-day moving average. Be wary of a rebound in the second half. Gold is bearish today, but don't chase shorts. Focus on the 3300 resistance level. If it breaks above and stabilizes, expect a continued rebound to 3330-3345!
A real-time strategy is like a beacon guiding your investment journey. The market will never disappoint those who persevere and explore wisely. FX:XAUUSD VELOCITY:GOLD FXOPEN:XAUUSD ACTIVTRADES:GOLD PYTH:XAUUSD
Goldlong
Short position profit. Latest strategyYesterday's gold price fluctuated: it maintained sideways fluctuations in the morning and started a downward channel after the opening of the US market. The Federal Reserve's interest rate decision remained unchanged. In addition, Powell's speech suppressed expectations of a September rate cut. The gold price directly fell to around 3267 and closed the day with a negative line, which exceeded expectations.
Looking back at recent trends, gold prices saw a brief correction on Tuesday after four consecutive days of decline, but failed to sustain the upward trend, falling sharply again yesterday, demonstrating that the weak market remains intact. Judging from today's market, theoretically there is still room for further decline, but before yesterday's low is broken, we don't expect a big drop for the time being; if the support here is effective, the market may tend to correct.
Pay attention to the daily resistance near 3315, and try shorting with a light position; the hourly resistance is near 3301, which is also a good position for shorting; the intraday bull-bear watershed is near 3294. If the market falls weakly and rebounds here, there may be a decline. The target below will first look at 3275. If yesterday's low of 3267 is broken, look further to 3250: On the long side, pay attention to the 3249 support below. If it is close to broken, you can try short-term buying.
【Operation ideas】👇
The bearish strategy in the morning remains unchanged. The short position at 3315 was publicly set up in the morning. The market rebounded to 3314 and then went down directly. The idea of setting up short positions at 3301 in the morning session remains unchanged. Friends who did not follow up with the short positions at 3315 can now add short positions with a light position at 3300.
PEPPERSTONE:XAUUSD ACTIVTRADES:GOLD VANTAGE:XAUUSD ACTIVTRADES:GOLD ICMARKETS:XAUUSD VELOCITY:GOLD PYTH:XAUUSD

XAUUSD Long Setup – 1HGold (XAUUSD) has shown strong bullish rejection from the lower volatility band after a sharp selloff. The appearance of a Heikin Ashi reversal candle, suggests a short-term reversal is forming. Price has reclaimed key structure and is now targeting a reversion back to the mean, supported by Fibonacci retracement levels.
Entry: 3293.55
Target Zone: 3308.91 → 3333.76 (Fib 38.2% – 100%)
Stop Loss: 3253.35
Confluences:
✅ Bullish engulfing + Heikin Ashi trend shift
✅ Oversold bounce from lower channel extremity
✅ Fib retracement aligns with key structural resistance zones
✅ Custom signal confirmation (green dot)
✅ Clean R:R toward upper band and previous POI
Short-term counter-trend long targeting liquidity grab and mean reversion toward the 3308–3333 zone. Risk tightly managed with SL below local swing low.


XAUUSD and AUDUSD Analysis todayHello traders, this is a complete multiple timeframe analysis of this pair. We see could find significant trading opportunities as per analysis upon price action confirmation we may take this trade. Smash the like button if you find value in this analysis and drop a comment if you have any questions or let me know which pair to cover in my next analysis

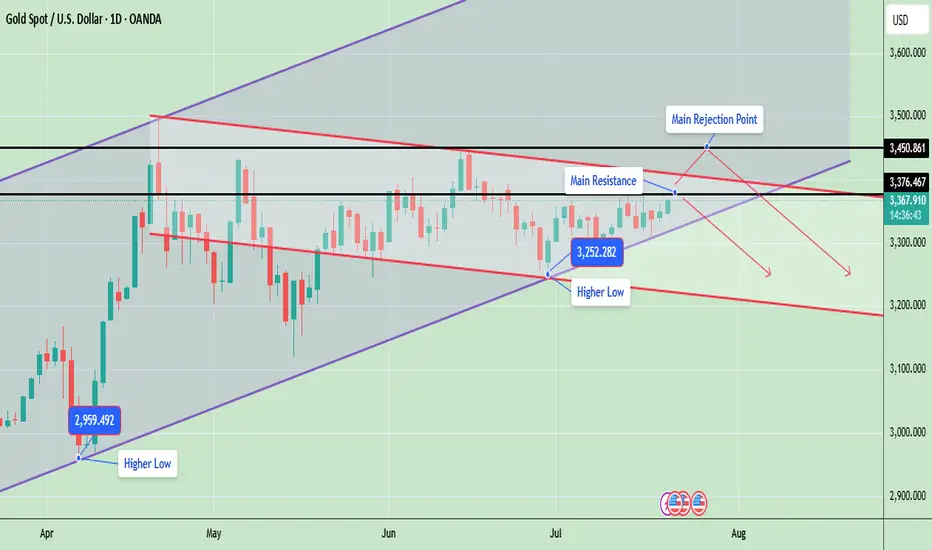
Gold Price Update – Testing Key ResistanceGold is currently trading around 3367, showing strong bullish momentum as it continues to form higher lows, which indicates an ongoing uptrend. The market structure is developing inside a rising wedge pattern, with the price consistently respecting both the ascending support and resistance lines.
Gold is now testing a key resistance zone between 3376 and 3450, an area that previously acted as a major supply zone and caused sharp rejections. A successful breakout and close above 3450 will likely confirm a bullish continuation and may open the door for a rally toward 3500 and possibly 3580. However, if gold fails to break this level, it could retrace back to the 3300 or 3250 support zones, especially if a rejection candle forms in the daily timeframe.
📊 Key Technical Highlights:
- Price has approached the upper resistance boundary of the wedge.
- Daily candle is bullish, indicating strong buying momentum.
- However, unless price closes above 3,376–3,450, there’s still a risk of rejection from the top channel and a pullback toward 3,300–3,250.
🔑 Key levels to watch:
- Gold is currently trading around $3,367, just below a crucial horizontal resistance at $3,376
- A strong breakout above $3,376, and especially above $3,450, could open the door for further bullish movement toward the $3,500–$3,600 range, following the upper trendline of the ascending channel.
- On the downside, if price fails to hold the higher low at $3,252, a drop toward $3,200 or even $3,100 is possible aligning with the downward red trendline.
- The structure remains bullish overall, as price is still making higher lows and staying within the rising channel
📊 Weekly Gold Chart Analysis
Gold is currently trading around $3,368, forming a symmetrical triangle pattern on the weekly timeframe. This pattern typically indicates a period of consolidation before a potential breakout in either direction. The price is getting squeezed between lower highs and higher lows, which is a sign of decreasing volatility and approaching breakout.
🔑 Key Technical Insights:
- ✅ Current Structure: Price has been consolidating within a triangle since April 2025 after a strong upward move. It is now near the apex of the triangle, suggesting a breakout is imminent—most likely in the next 1–2 weeks.
🔼 Bullish Breakout:
- If gold breaks above the triangle resistance (~$3,385–$3,393), it could trigger a sharp rally.
- Upside targets post-breakout: $3,450, $3,500, $3,600+ (if momentum continues)
🔽 Bearish Breakdown:
- A break below the triangle support (~$3,335–$3,325) may lead to a deeper correction.
- Downside targets post-breakdown: $3,285, $3,200
- Possibly $3,100–$3,050 if bearish sentiment intensifies
📉 Volume Drop:
As typical with triangles, volume has likely decreased, signaling indecision. Once volume returns, it will likely confirm the breakout direction.
Note
Please risk management in trading is a Key so use your money accordingly. If you like the idea then please like and boost. Thank you and Good Luck!
Beyond the Chart – GOLD Market Technical Analysis🧠 OANDA:XAUUSD Market Outlook: Gold (XAU/USD)
✅ Bullish Case (Upside Bias)
• Price has reclaimed multiple Fair Value Gaps (FVGs) on the way up.
• Holding above the 0.382 Fib level (3293) indicates moderate bullish momentum.
• A confirmed breakout above 3301 (0.5 Fib) may open the path to key resistance levels:
• 3308 (0.618 Fib)
• 3314 (0.705 Fib)
• 3319 (0.786 Fib)
📌 This move is likely a retracement rally within a broader downtrend — unless price reclaims above 0.786 with strength, confirming a shift in structure.
⸻
🛠️ Trading Plan
• Bullish Setup: Long above 3301, targeting 3308 → 3314, with tight stops.
• Bearish Setup: Look for rejection patterns at 3308–3314 zone, targeting a move back to the 3280 area.
⸻
📘 Disclaimer: This is educational content and not financial advice. Always do your own analysis and manage your risk accordingly
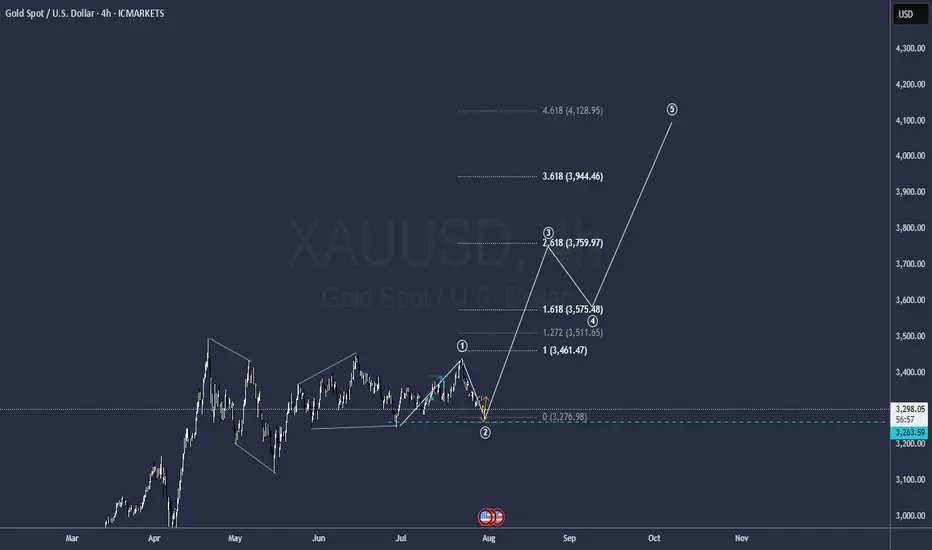
GOLD to all time highsIt is ready
a bitch wave one correction seems to be over so get ready to hit 4.000
GG
The Federal Reserve maintains a neutral stanceAs the Federal Reserve maintains its neutral monetary policy stance despite acknowledging slowing economic growth, the gold market is attempting to reclaim the $3,300 per ounce mark.
As expected, the Fed kept interest rates unchanged, maintaining them within a range of 4.25% to 4.50%. The most notable change in the Fed's monetary policy statement was a slight downward revision of its assessment of the economy, noting that growth in the first half of the year slowed from the "solid pace" seen in June.
In its monetary policy statement, the Fed stated: "While volatility in net exports continues to impact the data, recent indicators suggest that the growth of economic activity has moderated somewhat in the first half of the year."
The market's initial reaction to the Fed's statement was renewed volatility in gold prices. On Wednesday (July 30), spot gold closed at $3,274.88, down $51.47, or 1.55%, with an intraday low of $3,268.02. In early Asian trading on Thursday, spot gold rebounded to around $3,296, putting it within reach of the previous support level of $3,300.
While the Federal Reserve maintained its neutral monetary policy stance, dissent began to emerge within the committee. Fed Governors Bowman and Waller both voted in favor of a rate cut at this meeting.
However, analysts noted that the split vote was unsurprising, as both committee members had been outspoken about their dovish views.
With the Fed's decision unsurprising, Michael Brown, senior market analyst at Pepperstone, predicts the Fed will be slightly more hawkish this year than the market currently anticipates.
Despite the Fed's current neutral stance, the market still expects the Fed to cut interest rates twice this year, starting as early as September.
"My baseline forecast remains that the resilient nature of the labor market and continued tariff-induced price pressures will keep the Fed on the sidelines for now," Brown said. "My view remains that only one 25 basis point rate cut is likely this year, likely at the December meeting." OANDA:XAUUSD ACTIVTRADES:GOLD EIGHTCAP:XAUUSD FOREXCOM:GOLD EIGHTCAP:XAUUSD
Be cautious with the numerous news and short sell on rebound#XAUUSD
The market is fluctuating sideways, and whether it can achieve a V-shaped reversal still needs to wait for information such as ADP and the Federal Reserve's decision.🗞 Invest lightly today and avoid letting emotions dictate your thinking.⚖️
⚠️Although the market currently predicts that the news information is bullish for gold, and most of the trading voices are centered around bulls, we still need to be wary of the resistance area above 3345-3350.
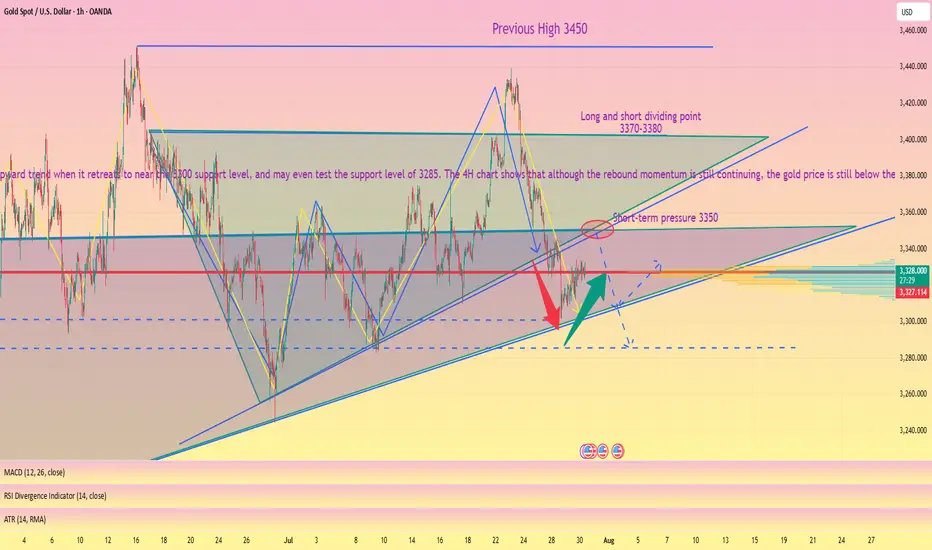
📉Judging from the daily chart, I have clearly stated in the figure before that the current trend is a converging triangle. If the price hits the triangle boundary, coupled with the interference of external news, it may trigger panic selling, killing a wave of long buyers first🐂, and then trigger an upward trend when it retreats to near the 3300 support level, and may even test the support level of 3285. 🩳
The 4H chart shows that although the rebound momentum is still continuing📈, the gold price is still below the short-term moving average and has only recovered the lower support level. It is necessary to wait for a second retracement confirmation to determine whether a true trend reversal has been achieved. 📈
In addition, the price on the hourly chart continues to run in a downward channel. Combined with the previous trend pattern, after the rebound correction at the 4H level is completed, it is highly likely that the downward trend will continue to return to the lower support level of the daily level.🐻
If resistance is encountered at 3345-3350 for the first time today, consider shorting.💡
If the price currently retreats to around 3320-3315, consider a short-term long position. Long positions held yesterday can be manually closed at around 3330.💡
🚀 SELL 3340-3350
🚀 TP 3330-3320-3300
🚀 BUY 3320-3315
🚀 TP 3330-3340
Gold Alert: Key Levels for Potential Sell Setup!Good morning, my friends 🌞
Here’s today’s gold analysis. I'm expecting a decline in gold prices, specifically from the 3,383–3,420 level.
Once a correction starts around that zone, my target will be 3,310. Gold has been riding a strong uptrend, and if we reach those levels, I’ll be expecting a pullback and opening a sell position accordingly.
Please set your stop loss based on your personal margin preferences.
Your likes and support are my biggest motivation for continuing to share these analyses. Thank you to everyone showing appreciation 🙏

Gold is in the Bearish Direction after Breaking SupportHello Traders
In This Chart GOLD HOURLY Forex Forecast By FOREX PLANET
today Gold analysis 👆
🟢This Chart includes_ (GOLD market update)
🟢What is The Next Opportunity on GOLD Market
🟢how to Enter to the Valid Entry With Assurance Profit
This CHART is For Trader's that Want to Improve Their Technical Analysis Skills and Their Trading By Understanding How To Analyze The Market Using Multiple Timeframes and Understanding The Bigger Picture on the Charts

We go up!Gold trapped all the buyers, flash crash like said yesterday, now we buy till 3400. Rates ain't getting cut, they already have gold at the price they want.

The golden direction in the volatile trend
💡Message Strategy
The market is currently in a wait-and-see phase ahead of major fundamental events. With the Federal Reserve's interest rate decision and key data such as second-quarter GDP and the core PCE price index set to be released, traders are generally cautious. Gold has stabilized slightly after a series of declines, but a meaningful reversal has yet to materialize. The divergence between bulls and bears is intensifying, and the market is on the verge of a breakout. This week's gold market is driven by uncertainty surrounding macroeconomic expectations and the Fed's monetary policy.
After four consecutive trading days of gains, the US dollar index has slowed its gains, temporarily retreating to around 99. Traders are still betting on a September Fed rate cut, with the market placing a 64% probability on a September rate cut. However, this week's release of Q2 GDP and the core PCE price index data will significantly impact this outlook.
If GDP and inflation data are weak, this will reinforce market expectations of easing and potentially attract renewed buying for gold. Conversely, strong data could dampen expectations of a rate cut, supporting a stronger dollar and putting pressure on gold.
Furthermore, the Federal Reserve is about to hold its interest rate meeting. While it's almost certain that interest rates will remain unchanged, Powell's speech will be a key focus for the market. Any signals regarding internal disagreements, adjustments to the inflation path, or adjustments to the policy framework could trigger significant market volatility. From a global perspective, geopolitical risks have been relatively stable recently, providing no sudden support for gold.
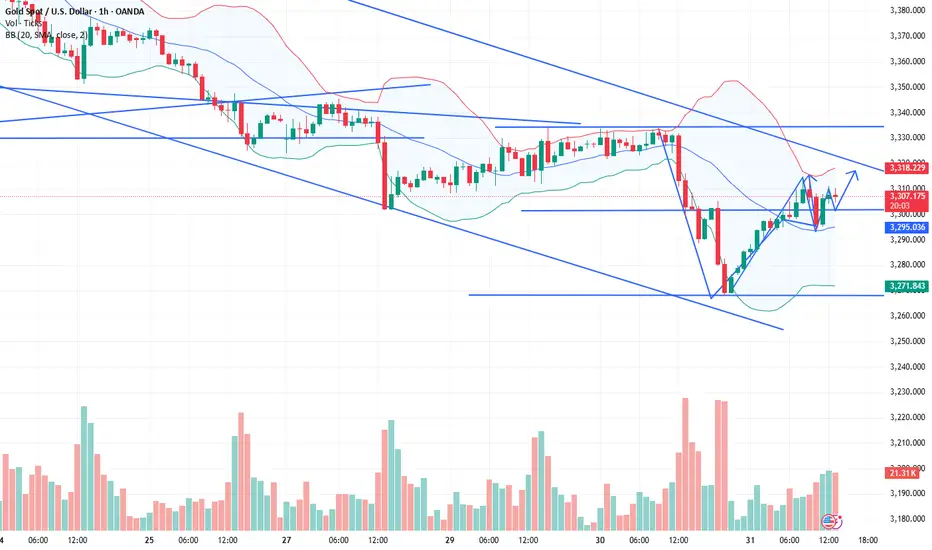
📊Technical aspects
Gold is showing signs of a short-term rebound, but the technical structure still indicates a weak rebound, with no confirmed trend reversal. A break above 3350 would be considered a temporary stabilization, while a break below 3300 would reopen the downside. Current market sentiment is in a "wait for a signal" phase.
Gold currently has limited downward space, and data factors are accelerating this week. Gold is likely to undergo a long-short conversion, so our trading strategy uses a small stop loss to counter the larger space for gold's shape conversion.
💰Strategy Package
Long Position:3290-3305,SL:3280,Target: 3340-3360
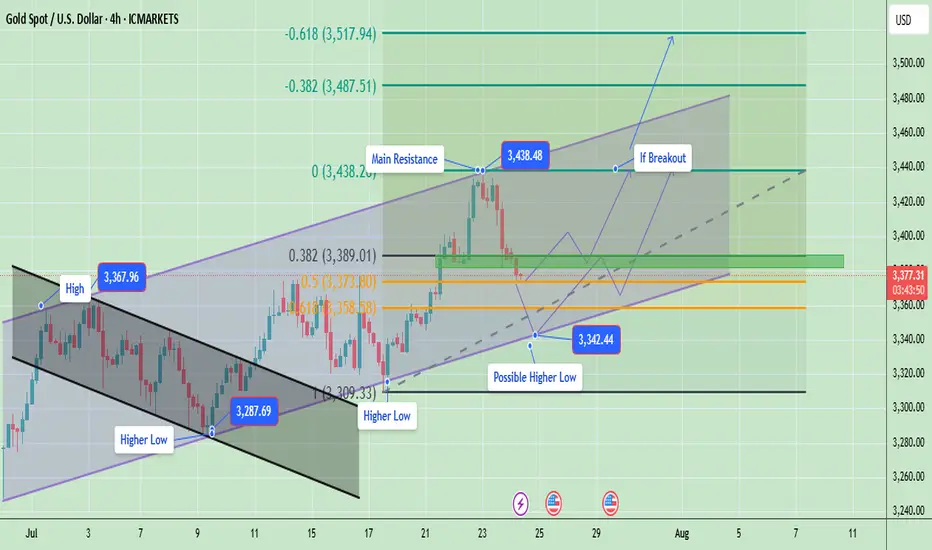
Gold Breakout or Pullback Ahead?Currently, price is in a correction phase within this rising channel after hitting the upper resistance near $3,438. The pullback is moving toward the mid and lower channel zones, which is healthy for a bullish continuation. Gold is in a healthy pullback phase inside a bigger bullish trend. If support at $3,358 – $3,373 holds, expect an upward push back to $3,438 → $3,487 → $3,517 in the coming sessions. Only a clean break below $3,309 would signal a deeper bearish move.
Gold is likely to consolidate or retest the lower channel support ($3,358 – $3,373). If buyers defend this zone, the price is expected to bounce back toward $3,400 – $3,420 and eventually retest $3,438.
Key Price Zones
- Main Resistance: $3,438 (if broken, potential rally toward $3,487 → $3,517)**
- Immediate Support: $3,373 (first reaction level)
- Major Support: $3,358 (key level to protect bullish structure)
- Potential Higher Low Zone: Around $3,342.44
Expected Price Behavior
- If gold holds above $3,373 – $3,358, it is likely to form a new higher low near $3,342 – $3,358 before attempting to push higher.
- A successful breakout above $3,438 would indicate continuation of the bullish momentum targeting $3,487 and $3,517 ).
- Failure to hold above $3,358 may open the door for a deeper correction toward $3,309, but the overall trend remains bullish unless that level is broken.
Trend Outlook
- Short-Term Trend: Consolidation / corrective pullback within a bullish channel
- Medium-Term Trend: Bullish (higher lows and breakout structure intact)
- Long-Term Trend: Bullish as long as the channel holds above $3,309
Gold is currently in a pullback phase after a strong bullish breakout. The market is likely forming a higher low and may resume upward momentum once the $3,373 – $3,358 zone is confirmed as support. A breakout above $3,438 would validate a bullish continuation toward $3,487 - $3,517.
Note
Please risk management in trading is a Key so use your money accordingly. If you like the idea then please like and boost. Thank you and Good Luck!
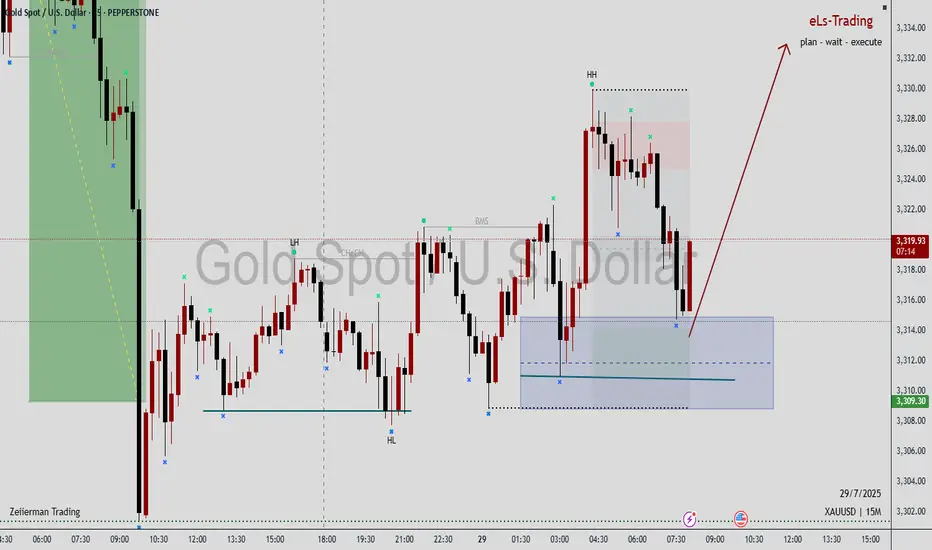
XAUUSD m15 : Long Position R.R 4The price reacted positively after touching the bullish daily and 4-hour order blocks, forming a 15-minute uptrend that continued its bullish movement by repeatedly taking liquidity.

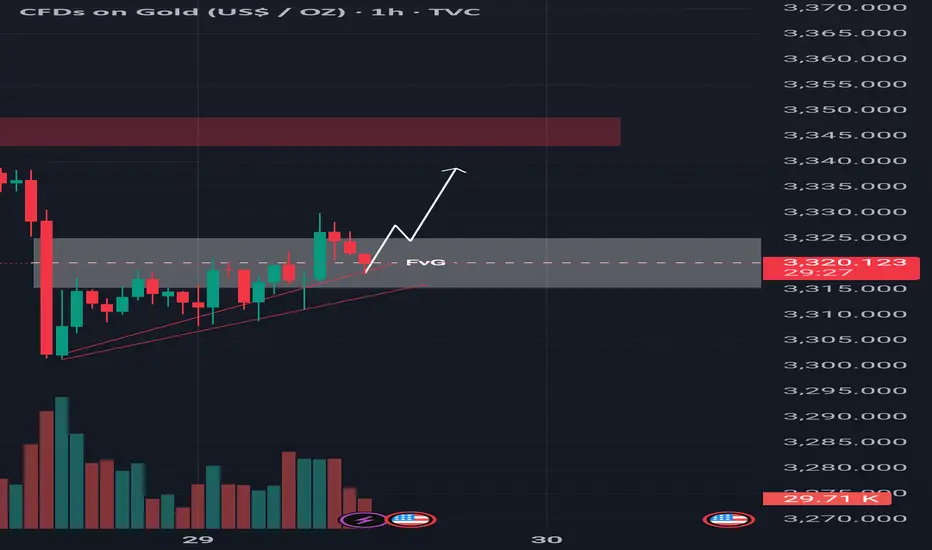
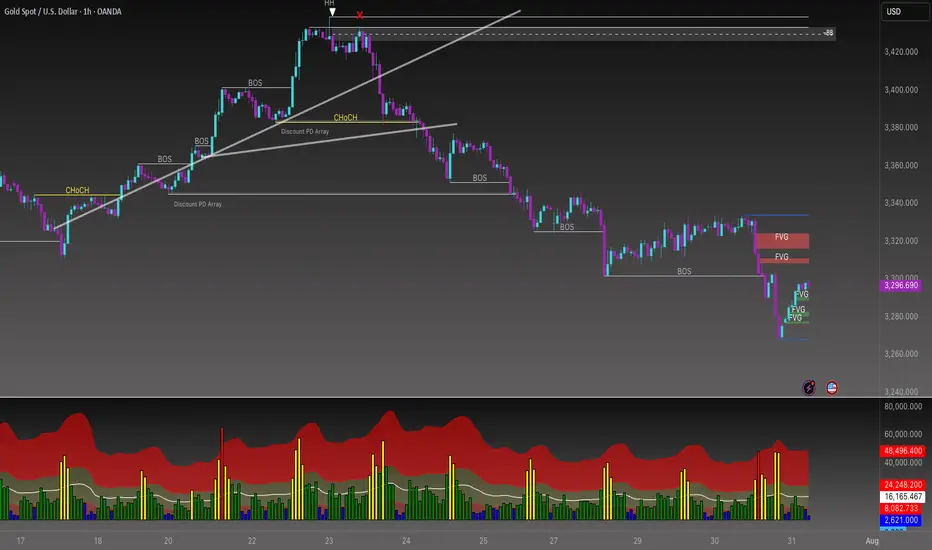
GOLD (XAUUSD) Analysis : Major Break + Bullish Setup + Target🟩 Today’s GOLD Analysis based on Volume Behavior, Smart Money Traps & Market Structure (MMC)
🔍 Chart Breakdown and MMC Concepts Explained:
1. Preceding Downtrend – Smart Money Trap Initiated
The chart begins with an extended downtrend, marking significant bearish pressure. However, deeper into the move, we notice price entering a Volume Absorption (VA) Zone — a key MMC signal where institutional orders quietly absorb aggressive retail selling.
This Volume Absorption Zone is highlighted on the left of the chart.
Smart money quietly positions longs here while inducing panic-selling from retail traders.
Wicks and indecision candles show early signs of sell exhaustion.
2. QFL Breakdown & Liquidity Sweep
The breakdown from the QFL (Quick Flip Level) is another hallmark of MMC behavior. The market intentionally breaks previous lows to trigger stop-loss clusters — known as a liquidity sweep or stop-hunt.
Price aggressively drops to a well-marked demand zone.
Massive bullish reaction from this zone confirms that smart money has completed accumulation.
The QFL move is not a true breakout, but a trap, designed to mislead retail into chasing shorts.
3. Demand Zone Reaction – Shift in Momentum
Price finds support at the demand zone (highlighted in green) and starts forming higher lows. This transition from lower lows to higher lows is a structural confirmation of market reversal.
Buyers have regained control.
Large bullish candles and wick rejections at key levels signal institutional entry.
4. SR Interchange Zone – Key MMC Confirmation
One of the most important zones on this chart is the SR Interchange area.
This level was previously resistance and is now acting as support — a concept known as support-resistance flip.
MMC teaches us that this is where smart money re-tests the breakout zone to trap late sellers and confirm the trend.
This zone is reinforced by:
Previous rejections
Retest with wicks
Alignment with ascending trendline support
5. Minor & Major Resistance Levels
Currently, price is attempting to break above a minor resistance at ~$3,330–3,332.
If it breaks, the next major target lies at the ~$3,340–3,345 level, marked on the chart.
This zone is crucial for short-term targets and may act as a profit-taking zone for early bulls.
Once this major resistance is cleared, the trendline projection suggests a continuation toward higher highs.
📐 Trendline Analysis
An ascending trendline is supporting price action. Each bounce off this line has led to higher lows — a clear sign of bullish intent.
Trendline + SR Interchange = Confluence zone
Traders should watch for bullish engulfing candles or strong wick rejections at this trendline area for re-entry or add-ons.
🧠 MMC Strategy Interpretation (Mirror Market Concepts)
This chart perfectly follows the MMC logic:
Trap retail sellers during the downtrend.
Absorb their volume at a key zone (Volume Absorp).
Sweep liquidity below QFL level.
Reverse structure with a shift to higher highs and higher lows.
Interchange SR zone to test buyers' strength.
Continue trend post-confirmation with breakout above resistance.
This is the classic "trap-to-trend" sequence smart money uses repeatedly in gold and other volatile markets.
✅ Trade Setup Summary:
Bias: Strongly Bullish (based on market structure shift)
Entry #1: Pullback into SR Interchange (ideal if price rejects 3,326–3,328)
Entry #2: Break and retest of Minor Resistance (3,332–3,334)
Targets:
TP1: 3,340 (Major Resistance)
TP2: 3,345–3,350 (Projection based on breakout path)
Invalidation: Clean break below trendline and demand zone (~3,318)
🧭 Final Words for Traders:
Gold is currently positioned at a critical junction where structure, volume, and institutional behavior all align. If you're following MMC strategies, this is a textbook scenario:
Trap ✅
Absorption ✅
Structure Shift ✅
Trendline Support ✅
SR Interchange ✅
Now, we wait for confirmation and execute with discipline.


GOLD GOLDEN XauUsd is now still respecting the trend and will keep holding expecting an even stronger push to the up side

XAUUSD Monthly Technical OutlookMarket Structure Overview:
• The chart reveals consistent Breaks of Structure (BOS) to the upside, confirming a strong bullish market trend.
• Price has successfully reclaimed and retested the strong resistance zone (~3390–3400), which now acts as new support.
• A series of higher highs and higher lows show clear bullish intent, supported by sustained bullish momentum after each correction.
⸻
📈 Volume & Price Action:
• The Volume Profile (VRVP) on the left shows strong historical accumulation near the current breakout zone.
• After the breakout from resistance, the price retested this zone—validating it as support—and is expected to continue its bullish leg toward $3,500, the next psychological and technical target.
⸻
📍 Key Levels:
• Support Zone: $3,375 – $3,390 (previous resistance turned support)
• Immediate Resistance: $3,425
• Target Level: $3,500 (Monthly High Projection)
⸻
📘 Educational Note:
• This setup aligns with classic market structure theory: BOS + Retest + Continuation.
• The pullback into the breakout zone is a textbook bullish continuation signal often used in institutional trading strategies.
• Traders watching this pattern should combine it with confirmation entries such as bullish engulfing candles, FVGs, or order block rejections for safer entries.
⸻
🎯 Projection:
• As long as the price holds above $3,375, the bullish scenario toward $3,500 remains valid.
• Expect possible consolidation or minor pullbacks before continuation.
⸻
📌 Disclaimer:
This analysis is for educational purposes only and does not constitute financial advice. Always do your own research before entering the market.

GOLD XAUUSD Gold moving as expected respecting our price and entries, will look for swinging opportunities ,and SL adjustments to BE

XAUAUSD ideaWe are waiting for our asset to reach our action zone, and based on the reaction, we’ll decide on our next moves.ALWAYS WAIT FOR A CONFIRMATION TO SEE IF THE PRICE VALIDATES THE ZONE.and you what is your vision of the EURUSD its interests me! i wait you in the commentary
Technical Shift FVG Break and Retest Hints at Further Upside!Gold is currently showing strength after taking support from the trendline, indicating buyers are stepping in around that level. Moreover the price has successfully broken above the 4-hour bearish Fair Value Gap (FVG), which suggests a shift in market sentiment. This FVG zone has now transitioned into an inversion level meaning what was once a resistance area could now act as support. At the moment, the market is pulling back, likely to retest this newly flipped zone. If buyers defend this area on the retest, it could provide the base for a potential bullish continuation. From this zone, we may witness a strong upward move, with the next target likely being the liquidity resting above key resistance levels. As always, it’s important to conduct your own analysis and manage risk accordingly (DYOR).