Gold updateAfter the previous level was broken and structure shifted, we’re now entering a new phase of analysis.
In this fresh setup, we’re looking for buy opportunities — but not blindly!
As always, waiting for a clean pullback to the new zone and a solid entry signal.
Experience teaches us: real profits come from patience and planning.
Here’s my new gold analysis — high probability, low risk.
For detailed entry points, trade management, and high-probability setups, follow the channel:
ForexCSP
Goldlongsetup

Bearish Continuation Pattern Detected on GOLD/USD Bearish Continuation Pattern Detected on GOLD/USD 📉
📊 Chart Analysis Summary:
The GOLD/USD chart shows a clear bearish continuation pattern, following a rejection from a major resistance zone.
🔍 Key Technical Highlights:
🔺 Resistance Zone:
Strong resistance at 3,420 – 3,440 USD, marked by multiple rejections (🔴 red arrows).
Price formed a Bearish Harmonic Pattern (likely a Gartley or Bat), suggesting reversal from this resistance.
🔻 Bearish Momentum:
After the pattern completed, price broke below the minor support structure and is currently forming lower highs and lower lows, indicating bearish structure.
📉 Support Level:
Strong horizontal support zone around 3,298 – 3,300 USD, marked as “TARGET.”
This area was previously tested (🟠 orange circles) and now projected to act as a target level again.
🔄 Minor Retracement Zone:
Expecting a minor pullback to 3,347 USD (purple line) before potential continuation downward.
This zone aligns with the previous support turned resistance (classic SR flip).
🎯 Target Projection:
Based on the bearish impulse and measured move, the projected target is around 3,298.758 USD, which coincides with the previous support zone.
📌 Conclusion:
The price action suggests a high-probability bearish continuation, targeting the 3,298 USD zone unless the price breaks and holds above 3,347 USD. Traders may consider selling on rallies with a confirmation of rejection at resistance.
📉 Bias: Bearish
📍 Invalidation: Break and daily close above 3,347 USD
📉
📊 Chart Analysis Summary:
The GOLD/USD chart shows a clear bearish continuation pattern, following a rejection from a major resistance zone.
🔍 Key Technical Highlights:
🔺 Resistance Zone:
Strong resistance at 3,420 – 3,440 USD, marked by multiple rejections (🔴 red arrows).
Price formed a Bearish Harmonic Pattern (likely a Gartley or Bat), suggesting reversal from this resistance.
🔻 Bearish Momentum:
After the pattern completed, price broke below the minor support structure and is currently forming lower highs and lower lows, indicating bearish structure.
📉 Support Level:
Strong horizontal support zone around 3,298 – 3,300 USD, marked as “TARGET.”
This area was previously tested (🟠 orange circles) and now projected to act as a target level again.
🔄 Minor Retracement Zone:
Expecting a minor pullback to 3,347 USD (purple line) before potential continuation downward.
This zone aligns with the previous support turned resistance (classic SR flip).
🎯 Target Projection:
Based on the bearish impulse and measured move, the projected target is around 3,298.758 USD, which coincides with the previous support zone.
📌 Conclusion:
The price action suggests a high-probability bearish continuation, targeting the 3,298 USD zone unless the price breaks and holds above 3,347 USD. Traders may consider selling on rallies with a confirmation of rejection at resistance.
📉 Bias: Bearish
📍 Invalidation: Break and daily close above 3,347 USD

GOLD Intraday Chart Update For 24 June 2025Hello Traders, As you can see that GOLD fell sharply this morning due to Israel- Iran Cease fire scenario
Further more FED Chair POWELL Testifies Starts from Today and end on Tomorrow make sure to manage you trading accordingly
Right now GOLD is in Strong Bearish Trend only clear Breakout of 3368 level for the day below this market remains Bearish
All eyes on 3300 Psychological Digit for now if market breaks 3300 Successfully then it will move towards 3250 soon
Disclaimer: Forex is Risky

Gold, Will USA-Iran-Israel conflict affect it? The USA-Iran-Israel conflict can significantly impact gold prices. Gold is a safe-haven asset, so demand often rises during geopolitical tensions, pushing prices up
3406 gonna be first target for me, if it breaks this lvl with huge volume and FVG on 1h+ then most likely we will see ATH in near future
bearish scenario(lest likely) - price breaks down 3340 and close with nice volume and fvg on 1h+ which will open move all the way down to MO

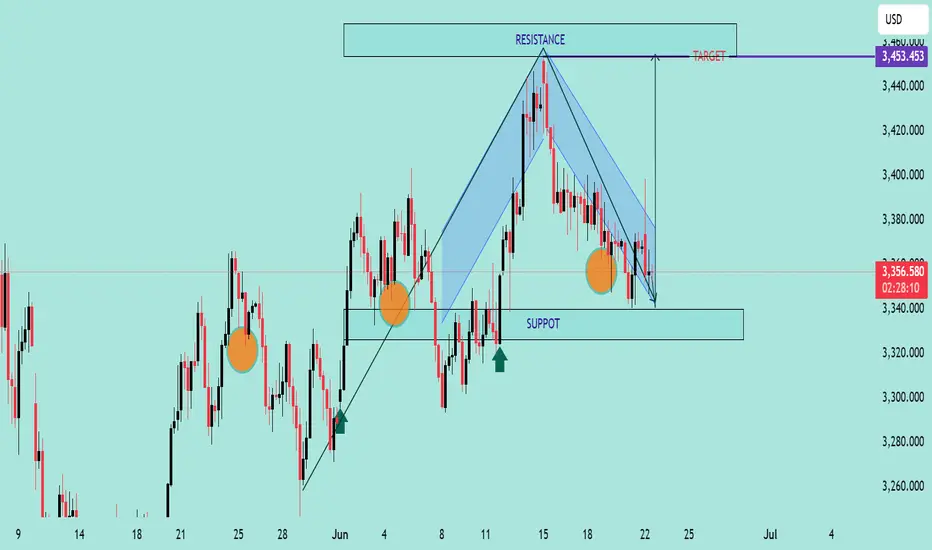
GOLD/USD Falling Wedge Breakout PotentialChart Analysis:
The chart illustrates a Falling Wedge Pattern, a bullish reversal setup typically signaling a breakout to the upside.
📌 Key Observations:
📉 Downward Channel: Price has been compressing within a falling wedge (highlighted in blue), indicating potential exhaustion of sellers.
💪 Support Zone: Strong support observed near the 3,340 level, with price rejecting this zone multiple times (highlighted with orange circles).
🔼 Bullish Signals: Price recently tested the lower wedge boundary and bounced, suggesting potential reversal.
🎯 Breakout Target: Projected target after breakout is around 3,453.453 USD, aligned with previous resistance zone.
🟢 Buy Pressure Arrows: Green arrows signal previous bullish reactions from similar demand zones.
📈 Conclusion:
If price breaks above the wedge’s upper boundary with volume confirmation, a bullish rally toward 3,453 is expected. Keep an eye on breakout retest for entry validation.
✅ Trading Plan Suggestion:
Entry: On breakout above wedge resistance
SL: Below recent swing low (~3,330)
TP: 3,453 zone 🎯
🔔 Note: Wait for a confirmed breakout before entering to avoid false signals.
Gold Set to Rise If U.S.–Iran Tensions Escalate📊 Market Overview:
Gold traded within a volatile range this past week, hovering between $3,360 and $3,385/oz. The U.S. dollar weakened on expectations that the Fed will maintain current interest rates in July, while persistent inflation concerns globally have kept gold supported. However, a geopolitical shock emerged late in the week: President Donald Trump announced readiness to deploy troops to the Middle East if Iran continues provocation, raising the possibility of serious military escalation.
📉 Technical Analysis:
•Key Resistance Levels: $3,387 – $3,403 (weekly highs), $3,450, and extended targets at $3,500–$3,520.
•Nearest Support: $3,358 – $3,365 (lower bound of the bullish channel), then $3,344 and $3,320.
•EMA09: Price remains above EMA 09, confirming a short-term uptrend on both 4H and daily charts.
•Chart Pattern: On the H4 chart, a Bullish Flag/Wedge Breakout is forming. A solid hold above $3,360 and breakout above $3,387 may trigger a strong upward move.
📌 Outlook:
Gold is likely to break higher next week if U.S.–Iran tensions escalate into direct conflict. Safe-haven demand could surge, driving gold toward $3,450 or even $3,500/oz.
On the other hand, if tensions ease and the U.S. dollar recovers on strong economic data, gold may pull back to $3,344–$3,320 before resuming any uptrend.
💡 Suggested Trading Strategy
🔺 BUY XAU/USD
Entry: $3,358–3,365
🎯 TP: $3,387 / $3,403 / $3,450
🛑 SL: $3,344
🟡 Enter on pullback to support — preferably if geopolitical tensions rise.
🔻 SELL XAU/USD
Entry: $3,400–3,410 (if price becomes overbought, RSI > 70)
🎯 TP: $3,380 / $3,365
🛑 SL: $3,420
🟡 Only apply this if tensions de-escalate and the U.S. dollar strengthens.

Middle East war, gold breaks through 3400 early next week
Hello everyone:
Let's analyze the gold price next week (June 23, 2025 to June 27, 2025)
📌Gold information:
Gold prices held steady on Friday, hovering around $3,369, and are expected to fall nearly 1.90% this week as the market digests U.S. President Donald Trump's decision to abandon immediate military action against Iran and turn to diplomacy. As of writing, XAU/USD fell 0.11%.
While easing geopolitical tensions helped boost risk sentiment, concerns that the United States may restrict allies operating semiconductor factories in China put additional pressure on gold, according to Bloomberg. Trump's restraint on Iran encouraged risk appetite and suppressed the appeal of this safe-haven metal.
What has President Trump been busy with in the past 24 hours? (2025-06-22)
1. Announced the successful airstrike on Iran's three nuclear facilities - Trump issued a message saying that he had successfully launched attacks on Iran's three nuclear facilities, including Fordow, Natanz and Isfahan. The main target Fordow nuclear facility was bombed with a full load of bombs. All fighter jets are returning safely. Iran's Fordow (nuclear facility) no longer exists.
2. Was willing to go to Turkey to negotiate with Iran in person - According to the AXIOS website, sources said that when Trump attended the G7 summit last Monday, Erdogan called and proposed to hold talks between US and Iranian officials in Istanbul the next day to explore diplomatic solutions to the war. Trump agreed, and he was willing to send Vice President Vance and White House envoy Vitkov, and even if necessary, he was willing to go in person. But it was later cancelled because Khamenei could not be contacted.
3. Threatening to strike Iran again if the conflict does not stop - According to Reuters, US President Trump said in a telephone interview that tonight was a stunning success and Iran should immediately achieve peace and stop the war, otherwise they will be hit again.
4. Saying that Iran will either usher in peace or fall into tragedy - Trump said that the US goal is to destroy Iran's nuclear enrichment capabilities and stop Iran's nuclear threat. Iran's facilities have been completely destroyed. Iran will either usher in peace or fall into tragedy. Many goals have not yet been achieved. Tonight's strike is the "toughest target". If peace is not achieved in the future, other targets will be accurately struck.
5. Warning Iran not to retaliate - Trump posted on social media: "Any retaliatory action by Iran against the United States will lead to a military response 'far beyond what we saw tonight.'"
6. US Democratic lawmakers call for Trump's impeachment - On the evening of June 21, local time, according to NBC, New York Democratic Congresswoman Alexandria Ocasio-Cortez said that President Trump's decision to attack Iran without the authorization of Congress "absolutely and clearly constitutes grounds for impeachment." She said that the US President's disastrous decision to bomb Iran without authorization was a serious violation of the Constitution and Congress' war powers.
📣Personal analysis:
Tensions in the Middle East escalate, and gold prices will continue to rise above 3400 at the beginning of next week
🔥 Technical:
Based on the resistance and support levels of gold prices on the 4-hour chart, Labaron identified the important key areas as follows:
Resistance: $3395, $3448
Support: $3302, $3255
⭐️ Note: Labaron hopes that traders can properly manage their funds
- Choose the number of lots that matches your funds

Gold Trade Setup - 22/Jun/2025Hi Traders,
I expect this pair to go Up after finishing the correction.
1) We are in uptrend and potentially correcting for further upside.
2) The current move can be just a part of a intermediate correction or can even go to break the top.
How to Enter : Look for engulfing with in the SL zone.

Gold Rebounds from Support, Eyes Breakout Above 3,370📊 Market Dynamics:
– Gold briefly dipped to 3,344 this morning before rebounding to 3,355 as of now.
– The USD is steady after cautious Fed commentary, while geopolitical tensions continue to support safe-haven flows into gold.
📉 Technical Analysis:
• Key resistance: 3,370 – 3,380
• Immediate support: 3,344 – 3,340
• EMA: Price remains above EMA 09, signaling continued short-term bullish bias.
• Patterns / Momentum: A bullish engulfing pattern formed on the H1 chart at 3,344.
📌 Outlook:
Gold may continue to rebound toward 3,370–3,380 in the short term. A break above 3,380 could open the path to 3,400.
💡 Trading Strategies:
🔻 SELL XAU/USD at: 3,375 – 3,380
🎯 TP: 3,355 – 3,360
❌ SL: 3,385
🔺 BUY XAU/USD at: 3,344 – 3,348
🎯 TP: 3,365 – 3,370
❌ SL: 3,335

A glimmer of hope for bullish lovers!Gold is currently dominated by bears, but thanks to the support of risk aversion caused by geopolitical conflicts, gold has shown a certain degree of resistance to decline while falling. Therefore, the current market direction is very clear, with weak and volatile downward movement. But under this market situation, we cannot short gold excessively. We can only wait for it to rebound to the pressure level and then short gold, or try to go long on gold with strong support.
At present, gold has touched the 3350 area again, which has a certain support effect. If gold cannot effectively fall below 3350, then gold may still rebound to the 3370-3380 area again; but once gold effectively breaks the support near 3350, gold is expected to continue to fall to the 3340-3330 area.
In terms of short-term trading, I think it is possible to consider starting to try to go long on gold in batches in the 3350-3330 area, TP: 3365-3375

Gold Spot / U.S. Dollar (XAU/USD) 4-Hour Chart4-hour chart displays the price movement of Gold Spot against the U.S. Dollar (XAU/USD) from early June to mid-June 2025. The price, currently at $3,350.76, has experienced a recent decline of $19.76 (-0.59%) as of 01:06:10. The chart highlights a downward trend with a shaded area indicating a potential support or resistance zone between $3,310.41 and $3,374.21. Key price levels are marked, showing fluctuations between $3,300.00 and $3,374.21 over the observed period.

GOLD H1 Intraday Chart Update For 20 JUNE 25Hello Traders we are now at closing day of the week, for today market expected is in tight range and better to wait for closing of the week
strong resistance for the day is 3382 level while strong support for the day is 3333
scalping range for today is 3340-3375
Disclaimer: Forex is Risky

Gold Gains Ahead of Fed📊 Market Overview
• Reason: Gold is trading around ~$3,380–$3,400/oz, supported by geopolitical tensions in the Middle East and expectations that the Fed will maintain high interest rates before potentially cutting later this year.
• Weak U.S. economic data (retail sales, housing, industrial production) also adds to safe-haven demand, providing further support for gold prices.
📉 Technical Analysis
• Key resistance: $3,410 – $3,465
• Nearest support: $3,340 – $3,300
• EMA 09 (short-term): Price remains above the 09 EMA, rebounding from ~$3,366 and holding above the 50 EMA → indicates a bullish trend is still intact.
• Candlestick patterns & volume: Bearish engulfing appeared on June 17 but lacked follow-through. Lower volume suggests range-bound movement ahead of the Fed announcement.
📌 Outlook
Gold may continue to rise modestly (bullish) in the short term if:
• The Fed keeps rates unchanged or takes a moderately hawkish stance,
• Geopolitical risks persist,
• U.S. economic data continues to show weakness.
However, a surprise from the Fed or a strong USD could lead to a pullback. Watch key levels: $3,340 (support), $3,410 (resistance).
💡 Suggested Trading Strategy
🔻 SELL XAU/USD
Entry zone: $3,410–$3,420
• 🎯 TP: ~$3,390 – $3,400
• ❌ SL: ~$3,430
•
🔺 BUY XAU/USD
Entry zone: $3,340–$3,350
• 🎯 TP: ~$3,360 – $3,370
• ❌ SL: ~$3,330

GOLD/USD Support Retest & Breakdown SetupGOLD/USD Support Retest & Breakdown Setup 📉🔍
🔹 Overview:
The chart indicates a potential bearish continuation pattern on GOLD/USD as the price is approaching a key support level at 3,335.305. Previous price action shows multiple rejections from the resistance zone (~3,435), followed by lower highs – a sign of weakening bullish momentum.
📊 Technical Analysis:
🔺 Resistance Zone (~3,435)
Multiple rejections (🔴 red arrows) indicate strong supply pressure.
Price has failed to break above this area thrice, forming a clear ceiling.
🔻 Support Zone (~3,335)
Marked as the target for a short setup.
Price is testing this level again after forming a minor consolidation below lower highs.
A clean break below this purple zone may trigger a continuation to the downside, targeting the broader support range below (~3,240).
🟠 Bearish Structure:
Series of lower highs (highlighted with circles).
Breakdown pattern is developing with declining bullish momentum.
📈 Potential Play:
A confirmed breakdown below 3,335 could lead to a drop toward the next major support.
If support holds, short-term bounce is possible but limited by the dominant resistance.
📌 Conclusion:
GOLD/USD is currently in a bearish setup, with the market eyeing a potential breakdown below a critical support zone. If this level fails to hold, we could see accelerated bearish momentum toward the lower support range.
💡 Caution: Wait for a confirmed close below support before entering any short trades.

GOLD H1 Intraday Chart Update For 19 June 2025Hello Traders,
For today market still stuck in between 3350 to 3400 Psychological levels we still need to wait for clear breakout of 3400 level
Today scalping range is 3360-90 but remember must placing SL
if market goes below 3350 clearly then it will move towards 3321 Major Support level
Reminder: There is Bank Holiday in US
Disclaimer: Forex is Risky

How to trade the Fed's interest rate decision!In nearly an hour, the Fed will announce the Fed's interest rate decision and a summary of economic expectations;
In nearly an hour and a half, Powell will hold a monetary policy press conference.
If the Fed's policy statement or the latest forecast shows a dovish tendency, it may resume the downward trend of the US dollar, thereby supporting the upward trend of gold; and the recent mild inflation and weak employment data in the United States may prompt the Fed to soften its previous assessment, thereby strengthening expectations of interest rate cuts and providing support for gold prices.
From the current technical structure, gold maintains a volatile and anxious market during the day, and there is no clear direction in the short term, but gold is currently always below 3400, and the overall market is still in a weak trend; but gold has repeatedly touched the 3375-3365 area and can quickly recover, proving that there is still strong buying support below; in fact, it stands to reason that if gold is really weak, it should have continued to fall and touched the 3360-3350 area, but gold did not touch the area as expected, but used sideways trading to exchange time and space, and there was no sign of any downward breakthrough, so gold is likely to choose an upward direction.
In addition, the Middle East geopolitical crisis, global economic uncertainty, intensified trade frictions and rising inflation expectations will all provide structural support for gold. So if gold does not fall below the 3365-3355 area today, we will be bullish on gold first; but if gold cannot break through the 3410-3420 area in one fell swoop during the rise, then we need to be careful of the trend of gold rising and then falling.
As for how to trade the news next: the Federal Reserve interest rate decision. The above are my trading ideas and opinions, you can read them carefully and use them as a reference! If you still want to trade news after careful consideration, please be sure to set SL during the transaction to protect your account to the greatest extent!

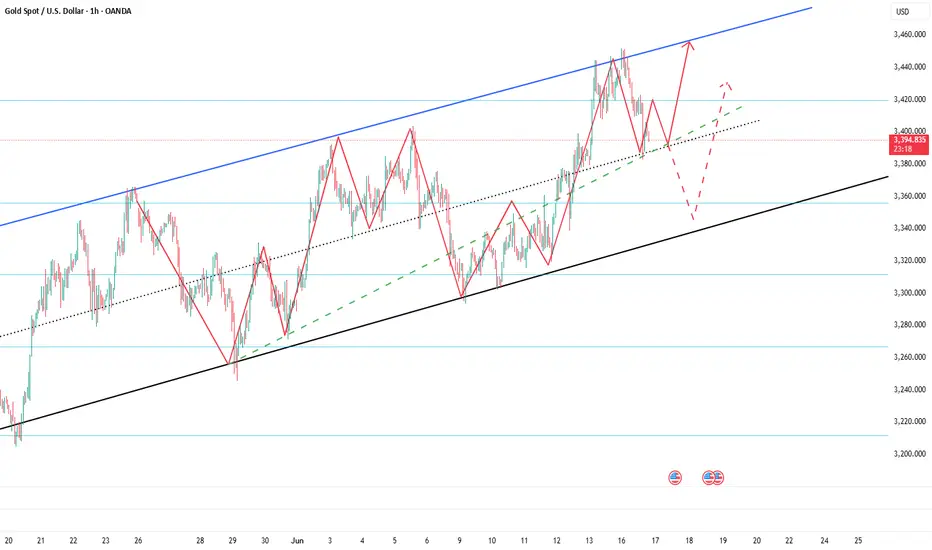
Gold’s in a Trap — And That’s Exactly Why You Should Be CarefulGold is stuck in a tight sideways range. It’s been bouncing between $3,370–$3,380 for two days now. Everyone sees it. Every trader watching gold knows this level acted as support — and judging by the candle shadows, buyers are getting aggressive here.
So if you're purely technical — yeah, looks like a solid buy right now.
But here’s the twist…
___________________________________________________________
I’m not buying.
And I’ll tell you why — because it's too obvious.
When something screams "buy" from every chart and every textbook, that’s when you pause and ask yourself:
“Am I about to walk into a classic setup… or actually catch a real move?”
Because history shows us — these textbook setups often play out like this:
Motivation → Encouragement → Payback. (See Chart 2)
It goes like this:
Price breaks a visible high or low (Motivation)
Traders jump in and get some pips(Encouragement)
Then — brutal reversal (Payback)
Only then will everything get off the ground, and it will be fast, so that the "unnecessary" passengers who were "dropped off" should not have time to return to this train. So why are they "unwanted"? Well, here's one possible answer: because retail tends to hold losing trades too long , but gets spooked early on winners. We’re wired that way.
So what happens when everyone starts booking profits after a small bounce?
You get limit sell orders piling up , slowing momentum — sometimes even flipping the trend.
And then what do big players do?
Then come back in — buying at higher levels, averaging their positions. Not the best case scenario....
Key Takeaway:
______________________
Here’s my advice — especially if you’re in this game long-term:
1. Avoid those super obvious setups everyone else is jumping into.
2. Instead of asking, "Why should I open a trade now?"
Try asking: "Why shouldn’t I open a trade now?"
p.s.
If you liked this kind of deep-dive — follow along. We don’t just read charts. We read the market behind them.
Conclusion:
_________________________
📍 Gold is testing a key zone — but don’t let the crowd pull you in.
🧠 The first quick impulse is often a trap
📈 Stay sharp, stay ahead.

GOLD/USD Bearish Rejection at ResistanceGOLD/USD Bearish Rejection at Resistance 📉🟥
🔍 Technical Analysis Overview:
The GOLD/USD chart shows a clear bearish rejection pattern forming near the resistance zone around $3,450, marked with red arrows. After price tested this level twice, strong selling pressure appeared, resulting in a sharp decline.
📌 Key Observations:
🔴 Resistance Zone:
Price was rejected from the resistance area around $3,450 twice, indicating strong seller presence.
Double top-like behavior seen with lower highs confirming weakening bullish momentum.
🟠 Support Zone:
A well-respected support level near $3,250 has been identified based on past reaction (highlighted with orange circles).
Price previously bounced twice from this zone, validating it as a strong support level.
🎯 Target Level:
A near-term target of $3,305.586 is marked, which aligns with previous reaction zones and short-term structure support.
If momentum continues, a deeper push toward $3,250 support is probable.
📉 Bearish Bias Justified By:
Clear rejection from resistance
Lower high formation
Current consolidation with downward bias
Possible breakout to downside if $3,305 fails to hold
⚠️ Risk Note:
If price retraces and breaks back above $3,400 with volume, the bearish setup will be invalidated.
📊 Conclusion:
The chart favors bearish continuation with a primary target around $3,305, and extended downside to $3,250 if bearish pressure sustains. Traders should watch for bearish confirmation patterns below current price before engaging.
🔽 Resistance: $3,450
🔼 Support: $3,250
🎯 Target: $3,305

GOLD H1 Intraday Chart Update for 18 June 25Hello Traders, Welcome to the FOMC Day
as you can see that market is in tight range for now which is 3370-3400, we are still waiting for long above 3400 Psychological Level once market will clearly breaks 3400 level we consider long opportunities
if market breaks 3350 Psychological digit successfully then it will move towards 3325 first then focus will 3300 Major Support Level
All eyes on FOMC for the day
Disclaimer: Forex is Risky

GOLD Intraday Chart for 17 June 25Hello Traders,
as you can see that market was going down very badly and it's actually stuck below 3400 Psychological Level
Definitely we are sellers now as long as market sustain below 3400 Psychological Level
below 3380 level GOLD will move towards 3360 or even 3350
Disclaimer: Forex is Risky

Gold is expected to hit 3410-3420 againBecause of the news that Iran hopes to ease the hostile relationship with Israel, gold fell sharply in the short term, then rebounded after touching 3383, and quickly recovered above 3390. From this point of view, the buying support below is strong, and the market sentiment is still high, which limits the downside of gold, and the support of 3390-3380 area is still valid.
Although the bullish momentum of gold has weakened relatively due to the retracement in the short term, as long as gold remains above 3380, it still maintains a strong upward structure; and the retracement only exacerbates the short-term shock trend. Gold is still likely to maintain a shock upward structure and try to touch the 3410-3420 area again. Once gold breaks through 3420 strongly, it is expected to hit the area near 3450 again.
So for short-term trading, I still hold a long position in gold, and there is still a certain profit now. I have to say that if gold can reach the 3410-3420 area as expected, our profits will increase significantly!
Gold Spot / U.S. Dollar - 1 Hour FX Chartthe 1-hour price movement of Gold Spot (XAUUSD) against the U.S. Dollar, with the current price at 3,418.02, reflecting a decrease of 15.96 (-0.46%). The chart includes a candlestick pattern showing recent trends, with a highlighted upward movement and key price levels marked at 3,405.38, 3,392.15, 3,360.00, and 3,320.00. The time frame spans from 6 AM to 1 PM on June 16, 2025.

GOLD/USD – Bullish Reversal Pattern FormingGOLD/USD – Bullish Reversal Pattern Forming 🟢📈
📊 Chart Analysis:
The chart shows a strong Inverse Head and Shoulders pattern forming, which is a classic bullish reversal signal:
🔹 Left Shoulder and Right Shoulder – Marked with orange circles, both found support near the 3,263 level (purple line), suggesting strong buying interest at this zone.
🔹 Head – The lowest point in between the shoulders, also bouncing from support.
🔹 Resistance Zone – Marked with red arrows around 3,500–3,520. This zone has rejected price action multiple times in the past.
🔹 Support Zone – Marked below 3,200, where previous consolidation and buying took place.
📈 Projected Move:
The neckline breakout suggests a potential move toward the 3,520+ level. A minor pullback is expected before continuation. If price breaks above resistance, we could see a strong bullish rally.
📌 Key Levels:
Support: 3,263 🟩
Resistance: 3,500–3,520 🟥
Potential Target After Breakout: 3,550+ 🎯
✅ Bias: Bullish above 3,263 support
⚠️ Invalidation: A break below the neckline would cancel the bullish setup
