ETH HIT THE LIKE TO MANIFEST THISETH/USD is teasing the breakout zone again... 👀
Are we finally ready for liftoff, or is it another fakeout? 🚀🔄
The chart’s looking spicy, and the energy feels right. 🌌
Hit that like to manifest the pump — we’re in this together. 💎🙏
Let’s speak green candles into existence! 📈✨
#ETH #Ethereum #CryptoVibes #ManifestMoneyMoves #ETHUSD #ToTheMoon"
Goldprediction

Gold Price Analysis June 11Yesterday's D1 candle was still a balance candle closing below the important breakout zone 3347.
Today's Asian session saw strong buying pressure pushing the price back close to the important resistance zone in shaping the trend. At the end of the Asian session, it failed to break 3342, giving a SELL signal to 3327
The breakout zone 3310 is also very important to wait for price reaction for BUY scalping points. 3295 is an important daily support zone. If there is a price slide from 3295, do not BUY until it touches the support zone 3275.
In the opposite direction of today's Break 3345, wait for 3363-3365 to SELL. The 3345 zone is considered a Breakout zone when broken to trade BUY.

GOLD M30 intraday chart update for 11 June 25Hello Trader, Welcome to the US CPI Day
AS you can see that market is still below 3350 Psychological level with given rewards multi-time from that level
now all eyes on US CPI if market successfully breaks 3350-60 zone today the it will move towards 3370/80 or even 3400 psychological level
below 3350 psychological level market remains bearish for shorter term
Disclaimer: Forex is Risky

Gold continues to fluctuate, CPI data becomes the key
Technically, the daily chart continues to fluctuate sideways, the moving average is glued together, and the RSI indicator runs near the middle axis. The moving average of the four-hour chart is also glued together, the price is adjusted near the middle track of the Bollinger Band, and the RSI indicator also runs near the middle axis. The gold price once broke through the 3349 mark yesterday, and then fell back and closed near 3320.
Focus on the 3320 position during the Asian session. From a technical perspective, the gold price continues to fluctuate in a range. Under the premise of the lack of news stimulating negative impact, from a technical perspective, the gold price continues to maintain low buying.
From the daily level, gold has been fluctuating at a high level since the high of 3500. The current highs of 3500, 3435, and 3403 are gradually moving down, and the lows of 3120, 3245, and 3293 are gradually moving up. The range of fluctuations is gradually narrowing. The short-term market may continue to fluctuate. If it breaks through, it will need to wait for major news stimulation to break through the direction!
💰Strategy Package
Then today's lock-up range is 3293-3350. It is recommended to sell high and buy low. Before the effective breakthrough of the range, short-term or ultra-short-term scalping is the main means.
Key points:
First support level: 3320, second support level: 3306, third support level: 3292
First resistance: 3346, second resistance: 3358, third resistance: 3376
Buy: 3303-3305, stop loss: 3292, target: 3320-3330;
Sell: 3350-3353, stop loss: 3362, target: 3330-3320;
⭐️ Note: Labaron hopes that traders can properly manage their funds
- Choose the number of lots that matches your funds

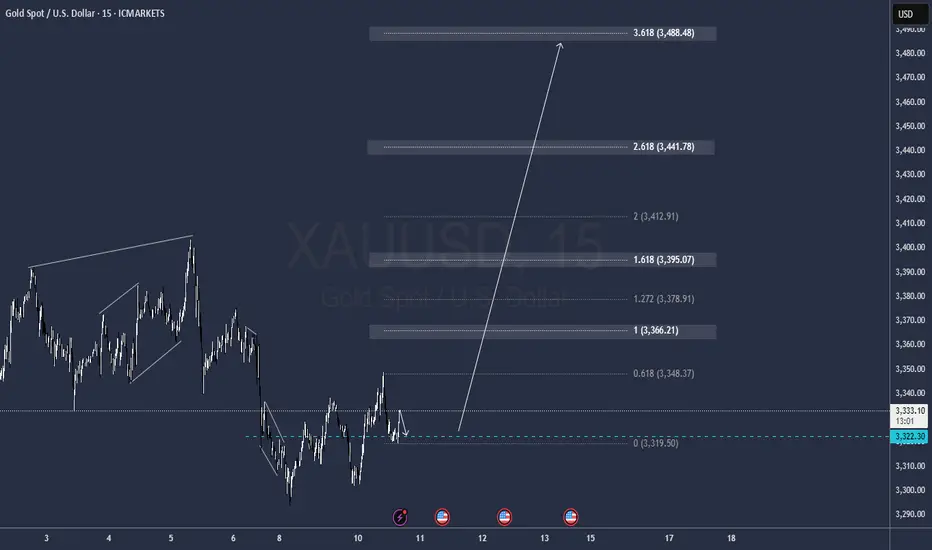
GOLD PRICE ACTION ANALYSIS – June 11, 2025 GOLD PRICE ACTION ANALYSIS – June 11, 2025 🟡
Technical Breakdown & Bearish Scenario Ahead ⚠️📉
🔍 Overview:
The chart presents a clear range-bound structure with strong horizontal resistance around the $3,400–$3,420 zone and support around the $3,120–$3,160 level. Price is currently trading near the upper range of the consolidation.
📊 Key Technical Levels:
🔴 Resistance Zone: $3,400 – $3,420
➤ Price has been rejected here multiple times (highlighted by red arrows and orange circles), showing strong supply pressure.
🟣 Intermediate Support: $3,260.618
➤ This level acted as a minor support and could be tested again if the current pullback deepens.
🟤 Major Support Zone: $3,120 – $3,160
➤ A key demand area where price previously bounced significantly.
📉 Bearish Setup:
A potential lower high is forming just below the resistance zone.
The projected path suggests a minor pullback to form a bearish retest, followed by a potential breakdown below $3,260.
If the $3,260 support is broken decisively, further downside toward the $3,120–$3,160 support is likely (blue arrow projection).
🔄 Bullish Scenario (Invalidation):
A breakout and strong close above $3,420 could invalidate the bearish structure.
In that case, price might attempt to target higher resistance levels beyond $3,440.
📌 Conclusion:
Gold remains in a range with a bearish bias unless the $3,420 resistance is breached.
🔽 Watch for confirmation below $3,260 for bearish continuation.
✅ For bulls, wait for a strong breakout above resistance with volume.

XAUUSD WONDERMAPXAUUSD WONDERMAP 🔥
DOJI DAILY CANDLE just dropped, we ain’t guessing, we’re executing.
📍 Buy Bias Breakdown:
✅ Daily indecision candle, primed for reversal
✅ H4 breakout retest in motion
✅ H1 forming support
✅ M30 flipped into RBS
✅ M15 continuation buy zone spotted
We’re at the base of ignition. Let the market breathe, let her pull back. Then we strike.

How is the market situation during the China-US talks?Information summary:
On Tuesday, as the China-US trade negotiations entered the second day, the US dollar index fluctuated around the 99 mark.
The gold price once approached the 3,300 US dollar mark in the Asian market, and then continued to rise, reaching the highest of the 3,350 US dollar mark. After the opening of the US stock market, all the gains during the day were given up, and it has been maintained below 3,350 for consolidation.
From the current known negotiation information, the two sides basically agree on the general direction and principles, but it means that more specific content and details have not yet been fully negotiated, and more dialogue is needed to resolve.
Market analysis:
From the current gold market, as long as the 3,350 mark cannot be strongly broken through next, the price will fall again. The consolidation range will remain at 3,300-3,350. As long as the price fails to break through strongly, there will still be a fifth wave of downward trend.
Therefore, gold is still maintaining short selling operations at high points.
Operation strategy:
Short at 3345-3450, stop loss at 3360, the first target is this week's low of 3300, the second target is 3285, and the third target is 3250.

Analysis of gold prices on June 11
📌Gold news
🎈Economic data and policy expectations
U.S. employment data; initial jobless claims increased for two consecutive weeks, and the market focus shifted to the non-farm payroll report released this week. The data performance will affect the Fed's policy path.
Trump pressures interest rate cuts: Trump recently called on the Fed to cut interest rates by "one percentage point" again, and hinted that he would consider replacing the Fed chairman, exacerbating market expectations for loose monetary policy.
🎈Long-term support factors
Despite short-term fluctuations, global economic and geopolitical uncertainties (such as repeated trade frictions and debt risks) still provide long-term safe-haven demand for gold, especially in the context of the divergence of monetary policies between European and American central banks, the allocation value of gold is highlighted.
📊Technical analysis
Before the European session, the gold price showed a continuous positive trend. I gave a hint in my analysis that I was not in a hurry to guess the top, and followed the trend to rise to around 3340 and wait for the turning point to appear. The opening trend of the European session tended to fluctuate until it rose to around 3348 in the evening and then turned from rising to falling, but the decline was not strong. It rose again at the position of the European session. Now the gold price is trading around 3350. From the market point of view, this wave of rise was supported by the trend line at 3300. Whether it was geopolitical conflicts or various news about Sino-US trade negotiations that stimulated buying to drive gold prices up, the second rise in the US session has exceeded 3340.
The next key suppression level is around 3360, which is 618 from 3403 to 3300, which can be treated as a turning point. The initial support below focuses on the high point of yesterday's Asian session at 3338.
💰Strategy Package
Waiting for gold: short at 3355-3360, stop loss at 3365, target at 3340-3328!
⭐️ Note: Labaron hopes that traders can properly manage their funds
- Choose the number of lots that matches your funds

XAUUSD: Analysis June 11Positive signals in US-China trade negotiations put pressure on gold. However, escalating geopolitical tensions between Iran and Israel and Russia and Ukraine have limited the decline of gold. Today, the market focuses on CPI data released today. If the data is released above expectations, it may force the FED to keep interest rates high for a longer period of time, thereby causing gold prices to decrease. On the contrary, if the data is released below expectations, gold will be supported to increase.
From a technical perspective.
The gold sell signal 3340 - 3342 in the US session last night had a very good profit. Gold declined below 3320 but then increased again and moved steadily above this support zone, indicating that the gold's upward momentum may continue.

Our Sell Setup hit all tpOur last sell signal hit all tp 246 pips Profit we take be ready for next analysis and signals

Gold rebounds and repairs, is it a shock or a bull market?📰 Impact of news:
1. Geopolitical situation
2. Impact of the US dollar trend on gold
📈 Market analysis:
At the gold hourly level, after the pressure in the Asian session in the morning, it directly fell to the vicinity of 3302. The big Yin effectively lost the lower track of the descending flag consolidation channel. The original 3318 line was the confirmation of the channel counter-pressure point, which happened to be the 61.8% split resistance level at that time. At the same time, it lost the middle track. Therefore, we gave a trading idea of looking at the rebound under pressure and continuing to decline in the European session. As a result, the market directly took a V-shaped wash-up and once pulled up to the vicinity of 3342.
The European session fluctuated strongly and rose. Before and after the US session, it took advantage of the retracement to lure the short position, and there is still the possibility of a second pull-up space. Therefore, in the subsequent retracement support level, pay attention to two positions, one is 3322-3324, and the other is the 61.8% division support level of 3318. If it stabilizes, there is a high probability that there will be a second upward space, pointing to 3348. If the pressure here cannot be overcome, the bottom will continue to oscillate back and forth. At that time, it will fall back to see if a secondary low point can be formed to further stabilize the support. If it goes straight through and stands on it, 3293 may already be the short-term low.
On the whole, I still hold short orders before the effective breakthrough of 3345, but at the same time, as the gold price rebounds and moves upward, the short-term support level is temporarily expected to be 3325-3320.
🏅 Trading strategies:
SELL 3335-3345
TP 3325-3315
BUY 3325-3330
TP 3350-3360
If you agree with this view, or have a better idea, please leave a message in the comment area. I look forward to hearing different voices.
TVC:GOLD FXOPEN:XAUUSD FOREXCOM:XAUUSD FX:XAUUSD OANDA:XAUUSD

Gold fluctuates widely, strategy remains unchanged
📌Gold news
The US and Chinese delegations will continue talks in London for the second consecutive day. President Trump expressed optimism, saying the talks "should go well". US officials said the talks could lead to Washington lifting certain technology export restrictions in exchange for Beijing relaxing controls on rare earth exports - a material that is critical to industries such as energy, defense and advanced technology. The results of these negotiations may provide a new direction for precious metals
📊Comment analysis
The European session continued to retrace and gave a low of 3293, then slowly strengthened. The current high reached 3349, so today's strategy does not need to be changed for the time being. If the current market is given to 3335-3345 again, short orders can still be entered. The current trend is still weak, and the US market is likely to follow the old path of a second decline, so the current idea of shorting on the pullback remains unchanged for the time being!
💰Strategy package
Gold: Short on rebound 3335-3345, stop loss 3350, target 3300-3280!
⭐️ Note: Labaron hopes that traders can properly manage their funds
- Choose the lot size that matches your funds
-

GOLD TODAYHello friends🙌
🔊Due to the weakness of buyers and the strength of sellers, the price continues to fall...
We have identified two supports for you that will not be seen if the price continues to fall, and if the selling pressure increases, we will update you.
🔥Join us for more signals🔥
*Trade safely with us*

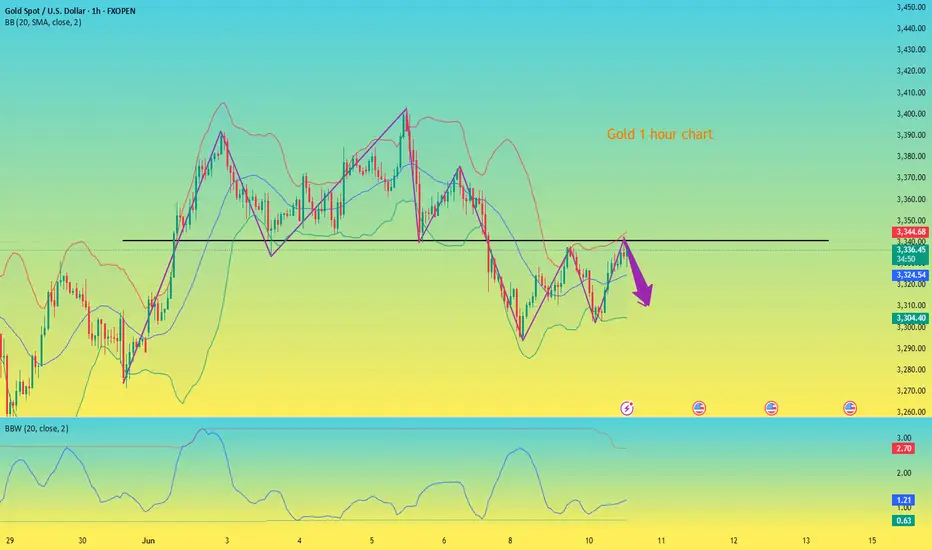
Gold is under pressure and bearish outlook remains unchanged
Gold has been rebounding during the day, but the strength of the rebound has weakened significantly. Although the one-hour trend broke through the upper pressure of 3340, it did not stand on 3340. The one-hour trend closed with a negative line, which means that the short-term rebound has come to an end. For this, we will continue to maintain a bearish view.
The pressure level of the one-hour market is at 3340. Before the gold price stands firm at 3340, it means that the rebound is an opportunity for us to short. The idea of our analysis just now is correct. Our internal strategy is also short at 3335. At present, the market has begun to fall back. Our positions are profitable. The target below will gradually look to around 3270, and our defense only needs to bring a little break loss.
Specific strategy
Gold 3335 short, stop loss 3345, target 3310
Is there more than $100 room for gold to fall?
💡Message Strategy
Gold is under the dual pressure of risk aversion cooling and dollar strengthening in the short term. As the high-level negotiations between Asian powers and the United States entered the second day in London, the market was optimistic about reaching an agreement in the field of export controls, which improved the overall risk sentiment and safe-haven assets such as gold were under obvious selling pressure.
At the same time, the US non-farm payrolls report last week far exceeded expectations, further suppressing expectations of a rapid rate cut this year, pushing up the US dollar index, and putting pressure on gold at the $3,340 mark.
Recently, the gold price has failed to effectively break through the 200-hour moving average, reflecting the lack of bullish momentum, and the short-term trend is likely to be consolidated or further adjusted.
📊Technical aspects
From a technical perspective, gold prices fell again after failing to test the 200-hour moving average and are currently fluctuating below $3,340. Hourly chart indicators (MACD, RSI) show that bearish momentum continues to increase. If the price falls below the previous trading day's low of $3,290, it will further open up space to fall back to the May 29 low of $3,245 or even $3,200.
The first support is in the 3340 area. After breaking through, it may accelerate the decline to test 3290; if this position is lost, it may re-test the 3200 integer mark.
💰 Strategy Package
Short Position:3340-3355,3355-3365

Gold Trading Strategy June 10Gold price in D1 frame reacted at EMA and Trend zone yesterday and bounced back but at the end of the day still closed below the 3335 breakout zone. The downtrend can still continue as long as 3335 remains stable today.
Looking at H1, it is still in a fairly clear downtrend. 3327 is the area that is currently in dispute. 3310 is the resistance zone that Gold broke through in the Asian session. To BUY this area, you must wait for price reaction and confirmation from the candle. Breaking 3309, Gold will head towards today's important support 3295. This is a good zone for BUY signal. The daily support zone around 3275 will prevent any excessive price slide of Gold.
On the other hand, when the buyers push the price strongly through 3327, you must wait for the US session resistance around 3338 yesterday for a SELL signal. (H1 does not break through 3328, we can set up SELL with the confirmation of selling force) Breaking 3338, the bearish structure will no longer exist, the market will switch to a short-term uptrend towards 3364.
Resistance 3337-3364-3374
Support 3310-3295-3275
Wish you successful trading. If you do not understand the strategy clearly, you can contact me for support.

Gold is in the Bearish DirectionHello Traders
In This Chart GOLD HOURLY Forex Forecast By FOREX PLANET
today Gold analysis 👆
🟢This Chart includes_ (GOLD market update)
🟢What is The Next Opportunity on GOLD Market
🟢how to Enter to the Valid Entry With Assurance Profit
This CHART is For Trader's that Want to Improve Their Technical Analysis Skills and Their Trading By Understanding How To Analyze The Market Using Multiple Timeframes and Understanding The Bigger Picture on the Charts

Sell Setup updates our Sell setup hit TP1 & TP2 130 Pips profit done now hold with breakeven or close all also follow me for daily analysis and Signals

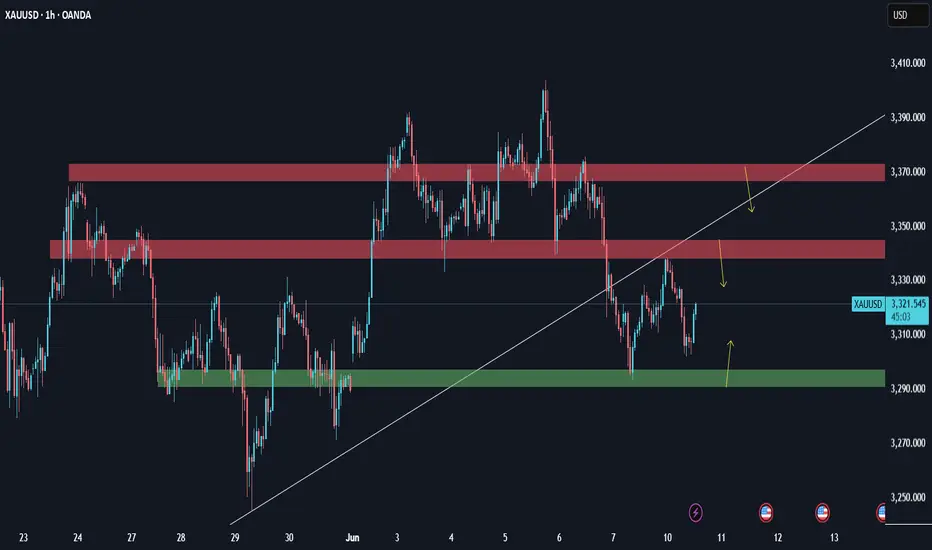
XAUUSD: Analysis June 10Gold recovered to nearly 3340 yesterday after a sharp decline at the end of last week. But gold then declined again as the market digested positive signals from the US-China trade talks. There is no important economic data released from the US today, investors continue to monitor the developments of the US-China trade talks and CPI data released on Wednesday.
After falling to test the broken down channel, gold rebounded to near 3340. It is currently declining again, but is still moving steadily above the psychological support zone of 3300. In the European session, you can buy gold again when approaching this support zone again. Or you can sell according to the two resistance zones above.
We are waiting for the H4 liquidity backtest to place SELL GOLDYesterday there was a BUY point and a missed SELL. Currently gold is in wave 5. We are waiting for the H4 liquidity backtest to place a SELL order.
World gold prices rose after the People's Bank of China announced on June 7 that it had added gold to its reserves for the seventh consecutive month in May. China's gold reserves were valued at $241.99 billion at the end of last month, down from $243.59 billion at the end of April. Gold prices hit an all-time high (over $3,500/ounce) in April, which boosted the value of China's holdings of the precious metal.
Investors are now waiting for the US Consumer Price Index (CPI), data due on June 13, to assess the country's economic health and predict the trajectory of the US Federal Reserve's interest rate cuts.
Let's wait for SELL
Best regards, StarrOne !!!

XAUUSD SELL signal from 3343-3346I'm going to sell from 3343 and add layer until 3346 my Target is 3320 its going to hit on us session so go for sell with me

Gold Price Late LonDon Session Trading StrategyGold is looking for support at 3314 in the late European session. If Gold breaks 3314, it will look for a daily trading plan around 3295. Note that 3314 will give a BUY signal if there is a reaction from the buyers. Target for BUY signals 3335 today
