GOLD - TIME TO DIGGING GOLDTeam, we do not often trade gold, but when we do, we kill them
I have been waiting for a few days for my entry-level setup.
Please follow the strategy and structure below
Target 1 - take 50% volume
Target 2 - take 30%
Target 3 - all your
WITH RISK management, make sure once it hits 1st target, bring stop loss to BE
I look forward to killing GOLD together.
If you see my videos, 95% of my target is always hit.
Please NOTE: i still hold my short UK100/FTSE100 and AUS200 as well.. This week, we should hit our target for both.
Goldprediction

In the new week, is gold brewing a new market?Information summary:
This week, the market continued to be affected by Trump's tariff policy and the progress of negotiations. On Thursday, the phone call between the Chinese and US heads of state boosted market sentiment. In the early stage, the precious metals market ushered in a collective rise, and the prices of silver and gold performed strongly. Silver rose to a 13-year high on Thursday, breaking through $36 for the first time since February 2012.
After gold hit the $3,400 mark during trading on Thursday, the US dollar rose as friendly talks between China and the United States stimulated the rise of the US dollar; gold fell rapidly and gave up all the gains during the day. On Friday, the US stock market closed at its highest level since February due to the boost of non-agricultural data.
Gold continued its retreat trend again, closing at around 3,310 as of Friday.
Market analysis:
From the trend of the US dollar, there is already an opportunity to bottom out, and the trend at the beginning of the week is critical.
Once the US dollar stands above 99.5 at the beginning of the week, it will continue to touch the 100.0--100.2 mark.
If it stabilizes above this position, gold will most likely fall below 3300 next week.
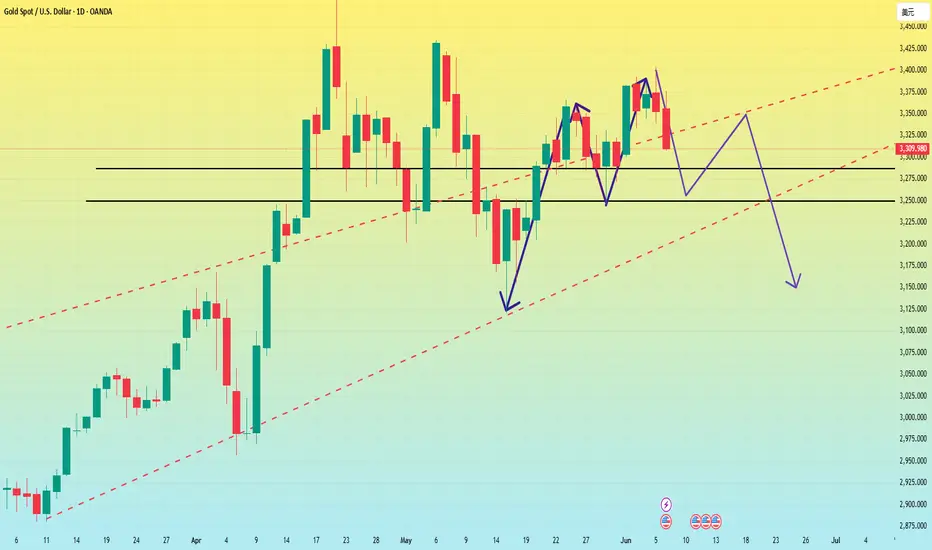
First, from the weekly chart:
The current moving average support below the weekly line is almost at 3250-3260. If it can hold here, gold may continue to maintain consolidation and wait for an opportunity to choose a new trend. However, if it falls below 3250, it can fall to the 3200 mark. If 3200 falls below again, it will be the low point of 3100.
It can also be seen from the daily chart that the important position of gold is at 3318-3280. If it stands above 3318, gold is in a bullish upward trend. If it falls below 3280, gold will enter a bearish trend. At present, gold has closed below 3318, so from the daily line, the next target is around 3280. If 3280 falls below again, then as the weekly analysis shows, it will test 3250-3260. However, judging from the daily chart, I think the market will not go down too easily.
Therefore, I guess that gold may follow the head and shoulders top structure of the daily chart next week. It may fall to 3250-3260 at the beginning of the week to lure short sellers into the market, and then stretch and rebound to around 3350 to form a shoulder position. Finally, it will directly dive down to around 3150.
The Asian market is about to open, and I hope my analysis can help everyone make some profits in the market. A new week is about to begin, and I wish you all good luck.
Gold will still fall below 3,300 next week!
📣World Situation:
Gold prices fell for the second consecutive trading day on Friday, but are still expected to close with a gain of more than 1.30% as traders readjusted expectations for Fed policy easing after a stronger-than-expected US non-farm payrolls report. At the time of writing, XAU/USD was trading at $3,322, down 0.84% on a daily basis.
The US Bureau of Labor Statistics (BLS) reported that the labor market continued to show resilience, with the unemployment rate remaining stable from April. Meanwhile, Wall Street rebounded modestly from Thursday's losses despite increased political tensions between President Donald Trump and Tesla CEO Elon Musk after the House of Representatives approved a bill to raise the US debt ceiling.
Next Wednesday: ① Data: API crude oil inventory in the United States for the week ending June 6, US May unadjusted CPI annual rate, May seasonally adjusted CPI monthly rate, May seasonally adjusted core CPI monthly rate, May unadjusted core CPI annual rate, pay attention to real-time data changes.
Geopolitical risks and trade tensions have eased, and the call between Chinese and American leaders has released a signal of easing. Trump said that the trade negotiations have reached a "positive conclusion", weakening the attractiveness of gold as a safe-haven asset.
🔥 Technical side:
Based on the resistance and support levels of gold prices on the 4-hour chart, NOVA sorted out the important key areas as follows:
Resistance: $3347, $3400
Support: $3252, $3202

Analysis of gold price trend next week!Market news:
This week (June 2 to June 6), the spot gold market has become more volatile due to the interweaving of multiple factors. Spot gold prices fell more than 1% on Friday due to the impact of strong US employment data, but still recorded a 0.8% increase for the whole week, showing the game between safe-haven demand and the strengthening of the US dollar. The trade uncertainty caused by Trump's tariff policy, the continued increase in international gold holdings by global central banks, and the tense geopolitical situation provide support for London gold prices, while the solid US employment data pushed up US Treasury yields, weakened the Fed's expectations of rate cuts, and put pressure on international gold prices. The market continues to pay attention to geopolitical risks and trade uncertainties. Silver performed even better, hitting its highest level since 2012, and platinum and palladium also recorded weekly gains. The precious metals market as a whole was driven by speculative funds. The market's uncertainty about the Trump administration's steel and aluminum tariffs and fiscal policies has driven global central banks to increase their gold holdings. And the cautious attitude of Federal Reserve officials towards rate cuts is beneficial to long-term demand for gold. Next week, the US CPI data and the progress of trade negotiations will become the focus of the market. If inflationary pressure rises, it may further push up US bond yields and put pressure on gold prices; if the data is soft, it may rekindle expectations of interest rate cuts, which is good for gold. In addition, the progress of trade negotiations and geopolitical risks such as the conflict between Russia and Ukraine will continue to affect market sentiment.
Technical Review:
From the perspective of this week's market, the high-rise and fall-down trend continued, and the low point was refreshed. The signal that gold is heading towards an extremely weak pattern is getting stronger and stronger, and selling has the capital to pierce 3300. From a technical perspective, on the weekly chart, this week's high-rise and fall closed with an inverted head, and the MACD indicator showed signs of a dead cross downward at a high level. The current pattern is conducive to continued selling! On the daily chart, two consecutive negative lines on the daily chart caused the price to run below the short-term moving average, and led to a downward trend near the 10-day moving average of 3330. The 5-day moving average also followed closely at around 3355. In addition, the upward momentum of other periodic indicators weakened, and the MACD indicator showed a dead cross downward pattern, so the daily chart should tend to be short. However, one thing is worth noting, that is, after the gold price rebounded at 3307 on Friday, the middle track of the Bollinger Band has moved up, which means that the buying defense has been strengthened. Therefore, while the daily line is biased towards selling, we must also pay attention to the strength of the bulls' counterattack.
Next week's analysis:
Next week's operation suggestion is to maintain the idea of selling as the main idea, supplemented by buying at low prices. For the upper resistance, pay attention to the 3328-3330 area first, and then pay attention to the 3345-3350 area. The former is regarded as the key to selling and exploring the low point, or even breaking the middle track of the Bollinger Band at 3295, which is also the low point of this week. The latter is a strong defense for selling in the short-term shock trend! In other words, selling below 3330 can complete the touch of the low point or new low next week in the short term, while selling below 3350 is still expected to test the new low, but the time period will be extended. As for the support below, focus on 3280. It is expected that it will be close to or touched at the beginning of next week, but whether it can break directly needs to be judged according to the actual trend, so it is best to wait for it to touch or break once before taking more. The 1-hour moving average of gold has formed a dead cross downward, so gold still has downward momentum. After the 1-hour high box of gold oscillated, gold finally broke through the box downward, indicating that gold is better sold. Then the bottom of the gold box has now formed resistance, and the short-term 3333 line of gold has formed resistance to gold. If gold is under pressure at 3333 at the beginning of next week, then gold can continue to be sold.
Operation ideas:
Buy short-term gold at 3277-3280, stop loss at 3268, target at 3310-3330;
Sell short-term gold at 3330-3333, stop loss at 3342, target at 3300-3280;
Key points:
First support level: 3300, second support level: 3280, third support level: 3261
First resistance level: 3330, second resistance level: 3348, third resistance level: 3375

GOLDGOLD is getting ready to go the reaction level before giving us further upside.
Disclosure: We are part of Trade Nation's Influencer program and receive a monthly fee for using their TradingView charts in our analysis.

Accurately grasp the gold trend analysis next week📰 Impact of news:
1. The geopolitical situation is gradually deteriorating
2. Trump again calls on the Federal Reserve to cut interest rates
📈 Market analysis:
The current weekly moving average support for gold prices is roughly 3250-3260. If 3250-60 can be maintained, then gold may continue to maintain consolidation and wait for an opportunity to choose a trend. If it falls below 3250, then it can directly see the 3200 mark. If 3200 falls below again, then it will see 3100. In the short term, the first focus of the gold price below is 3315. As long as it stays above 3315, gold is still in a bullish trend. Secondly, pay attention to the 3280 line below. If it falls below 3280, the gold price will further test the support of 3260-3250. It is possible that gold will form a head and shoulders top structure on the daily chart next week. It may fall to 3250-60 at the beginning of the week to lure shorts into the market, and then stretch and rebound to around 3350 to form a shoulder position, and finally directly dive down to around 3150.
If you agree with this view, or have a better idea, please leave a message in the comment area. I look forward to hearing different voices.
OANDA:XAUUSD FX:XAUUSD FOREXCOM:XAUUSD FXOPEN:XAUUSD TVC:GOLD

GOLD 1H CHART ROUTE MAP UPDATE & TRADING PLAN FOR THE WEEKHey Everyone,
Please see our updated 1h chart levels and targets for the coming week.
We are seeing price play between two weighted levels with a gap above at 3318 and a gap below at 3281. We will need to see ema5 cross and lock on either weighted level to determine the next range.
We will see levels tested side by side until one of the weighted levels break and lock to confirm direction for the next range.
We will keep the above in mind when taking buys from dips. Our updated levels and weighted levels will allow us to track the movement down and then catch bounces up.
We will continue to buy dips using our support levels taking 20 to 40 pips. As stated before each of our level structures give 20 to 40 pip bounces, which is enough for a nice entry and exit. If you back test the levels we shared every week for the past 24 months, you can see how effectively they were used to trade with or against short/mid term swings and trends.
The swing range give bigger bounces then our weighted levels that's the difference between weighted levels and swing ranges.
BULLISH TARGET
3318
EMA5 CROSS AND LOCK ABOVE 3318 WILL OPEN THE FOLLOWING BULLISH TARGETS
3352
EMA5 CROSS AND LOCK ABOVE 3352 WILL OPEN THE FOLLOWING BULLISH TARGET
3388
EMA5 CROSS AND LOCK ABOVE 3388 WILL OPEN THE FOLLOWING BULLISH TARGET
3428
EMA5 CROSS AND LOCK ABOVE 3428 WILL OPEN THE FOLLOWING BULLISH TARGET
3478
BEARISH TARGETS
3281
EMA5 CROSS AND LOCK BELOW 3281 WILL OPEN THE FOLLOWING BEARISH TARGET
3254
EMA5 CROSS AND LOCK BELOW 3254 WILL OPEN THE FOLLOWING BEARISH TARGET
3210
EMA5 CROSS AND LOCK BELOW 3210 WILL OPEN THE SWING RANGE
3179
3146
As always, we will keep you all updated with regular updates throughout the week and how we manage the active ideas and setups. Thank you all for your likes, comments and follows, we really appreciate it!
Mr Gold
GoldViewFX

GOLD 4H CHART ROUTE MAP UPDATE & TRADING PLAN FOR THE WEEKHey Everyone,
Please see our updated 4h chart levels and targets for the coming week.
We are seeing price play between two weighted levels with a gap above at 3376 and a gap below at 3302. We will need to see ema5 cross and lock on either weighted level to determine the next range.
We will see levels tested side by side until one of the weighted levels break and lock to confirm direction for the next range.
We will keep the above in mind when taking buys from dips. Our updated levels and weighted levels will allow us to track the movement down and then catch bounces up.
We will continue to buy dips using our support levels taking 20 to 40 pips. As stated before each of our level structures give 20 to 40 pip bounces, which is enough for a nice entry and exit. If you back test the levels we shared every week for the past 24 months, you can see how effectively they were used to trade with or against short/mid term swings and trends.
The swing range give bigger bounces then our weighted levels that's the difference between weighted levels and swing ranges.
BULLISH TARGET
3376
EMA5 CROSS AND LOCK ABOVE 3376 WILL OPEN THE FOLLOWING BULLISH TARGETS
3438
EMA5 CROSS AND LOCK ABOVE 3438 WILL OPEN THE FOLLOWING BULLISH TARGET
3498
EMA5 CROSS AND LOCK ABOVE 3498 WILL OPEN THE FOLLOWING BULLISH TARGET
3551
BEARISH TARGETS
3302
EMA5 CROSS AND LOCK BELOW 3302 WILL OPEN THE FOLLOWING BEARISH TARGET
3235
EMA5 CROSS AND LOCK BELOW 3235 WILL OPEN THE SWING RANGE
3171
3113
EMA5 CROSS AND LOCK BELOW 3113 WILL OPEN THE SECONDARY SWING RANGE
3045
2987
As always, we will keep you all updated with regular updates throughout the week and how we manage the active ideas and setups. Thank you all for your likes, comments and follows, we really appreciate it!
Mr Gold
GoldViewFX

GOLD DAILY CHART ROUTE MAPHey Everyone,
Following up on our previous analysis, price action has continued to respect our Goldturn channel beautifully. After the strong move to 3272, we saw another push toward the channel top near 3433. However, just before completing the move, price was met with another sharp rejection, highlighting the strength of the range and the precision of our channel levels.
The key takeaway here is that 3272 is still providing solid support, and the price remains well contained within our defined range between 3272 and 3433. This reaffirms our strategy of buying dips near the lower end of the range rather than chasing strength near the top.
We remain focused on trading within this range, using our weighted Goldturns to guide entries on the lower timeframes (1H and 4H). As long as the structure holds, we’ll continue to target quick 30–40 pip intraday moves while positioning ourselves for a potential breakout scenario when the time is right.
This is the beauty of our Goldturn channels, drawn using weighted averages instead of pure price action. This unique approach helps us clearly identify fake outs and real breakouts, cutting out much of the noise that usually confuses traders.
Keep an eye on how price behaves around 3272 and 3433. A clean break and close above the channel top would be significant but until then, range play remains our primary game plan.
Let’s stay patient and disciplined.
Mr Gold
GoldViewFX

GOLD WEEKLY CHART MID/LONG TERM ROUTE MAPHey Everyone,
Following up on last week’s chart update, we saw another perfect test of the channel top, right in line with our Goldturn Channel expectations. The new weekly candle completed the channel top challenge with precision, once again confirming the strength of our resistance levels.
As anticipated, the rejection came in cleanly, followed by a correction into EMA5 detachment, which halted just short of the 3281 level, a crucial axis we've been tracking for multiple weeks. This level continues to act as firm support, holding price within an evolving range.
We’re now seeing price action contained between 3281 and 3387, with potential for expansion higher as the ascending channel continues to rise. This expanding structure offers more room for strategic positioning, especially as price coils tighter within the upper band.
The 3387 gap remains active and is an obvious magnet if momentum builds. As long as we stay above the half line and especially above 3281, we remain in buy the dip mode, favouring long setups off our intraday Goldturns for quick 20 40 pip scalps or swing entries when conditions align.
Should we see a deeper pullback or close below 3281, we’ll reassess potential movement toward the lower channel boundary. Until then, the structure remains bullish within the channel.
The Goldturn methodology continues to prove its worth, cutting through noise and keeping us aligned with the real structure of the market.
Stay sharp, stay patient.
MR GOLD
GOLDVIEWFX

D1 looking BullingGold on Daily TF looking buy till 3,780$ per ounce on 4h it’s on strong Support zone.!
Let see on monday what will do.!
Note: it’s not financial advice, Trade your own.

GOLD (XAU/USD) Imminent long opportunitiesThis week, my focus for GOLD is on potential long opportunities around the current price level. Price is sitting within a strong area of demand, so my plan is to wait for signs of accumulation and a clear slowdown in bearish momentum before considering any entries.
Ideally, I’d like to see the Asia low swept, which currently lies in the middle of the zone — that would offer even stronger confirmation for a buy setup.
If this current zone doesn’t hold, I have a well-defined 9H demand zone around the 3,220 level, which sits in a more discounted area and aligns well with the overall bullish trend on the higher timeframes.
Confluences for GOLD Buys:
- Clean major daily demand that caused a change of character to the upside
- Plenty of liquidity above and an unmitigated supply higher up
- This is a pro-trend trade, aligning with overall higher timeframe bullishness
- DXY has been bearish over the past few weeks, supporting gold upside
P.S. If price respects this current demand and moves higher, we may see a short-term reaction from the 3H supply zones above — but we’ll monitor price action and adjust accordingly.
Have a great trading week

Gold plunges, what will be the trend next week?From the daily chart:
Since the last round of breaking the triangle convergence oscillation and breaking the trend line, gold has surged to 3400, but the upward momentum is insufficient and it has retreated. The low point of the retreat on Friday happened to be the support level of the previous triangle convergence trend line near 3300. If it falls below, the price will return to the triangle convergence oscillation range, and the gold price may fall further;
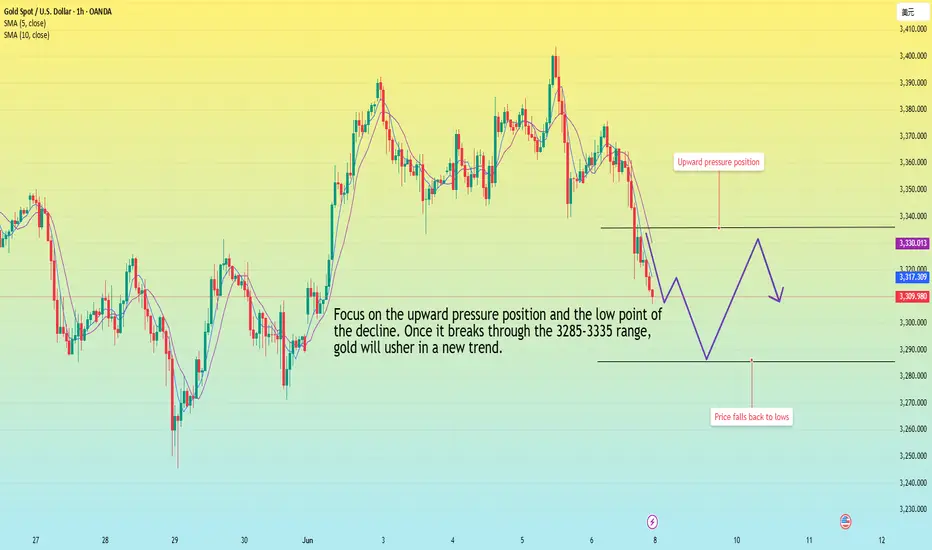
From the perspective of gold 1 hour, the MA5-day and 10-day moving averages have formed a dead cross downward, so gold still has downward momentum. After the gold 1-hour high box oscillation, gold finally broke through the box downward, indicating that the gold shorts are better, so the bottom of the gold box has now formed resistance, and the gold short-term resistance to gold has been formed near 3335. If gold is 3335 at the beginning of next week, then gold can continue to be short.
Next week's operation strategy is still around the 3285-3335 range.
GOLD H4 Weekly Chart Update For 9-13 June 25Hello Trader,
As you can see that there are some crucial levels appear in the chart, right market sustain above 3300 Psychological Level if market break 3300 Psychological Level Successfully then it will might be testing 325+-60 zone
Above 3300 Psychological Level Market will move towards 3326 level or even 3345
Furthermore kindly check all mentioned zone in the chart carefully
Disclaimer: Forex is Risky

Gold layout on the eve of non-agricultural
💡Message Strategy
Gold has experienced the baptism of war, the first round of interest rate cuts by the Federal Reserve, and the stimulus of trade tariffs, and has reached a high of $3,500 in one fell swoop. What kind of support is needed for the next round to continue to rise? Obviously, on the first day, the US dollar must fall before gold can rise.
The only condition for the dollar to fall is that the Fed cuts interest rates and releases the dollar. At that time, the US stock market will continue to rise and remain strong, and commodities will continue to rise. Behind this, inflation will be re-stimulated, but the premise is that the inflation problem is controllable, which is exactly what the Fed needs to balance. On the contrary, Trump hopes for superficial prosperity, which is why Trump called on the Fed to cut interest rates as soon as possible, but the Fed did not do anything.
📊Technical aspects
Today's main strategy non-agricultural layout ideas
ADP data is bullish for gold, and gold will rise in the short term. Once it goes sideways at a high level, even if tomorrow's non-agricultural data is positive or negative, the probability of gold changing is very high. The positive news at a high level will inevitably limit the upward momentum. In addition, near $3,400, it will inevitably trigger profit-taking. Therefore, it is unwise to chase the rise in the current situation.
If the non-agricultural data is negative, gold may fall sharply. At present, around $3,370, the idea of looking at a periodic correction remains unchanged. Around $3,370-3,390, the layout is still based on the high-altitude idea.
💰 Strategy Package
Short Position:3355-3365,3375-3395

GOLD ROUTE MAP UPDATEHey Everyone,
A great finish to the week with our 1H chart idea finishing off with the rejection from 3389 with no further cross and lock above that level confirming the rejection. We continued to see a drop into the lower Goldturns with each level giving 20 to 40 pip bounces.,
We are now seeing 3334 Goldturn being tested. Lets see if we get the 20 to 40 pip reactional bounce before close of play.
We’ll be back now on Sunday with our multi-timeframe analysis and trading plans for the week ahead. Thanks again for all your likes, comments, and follows.
Wishing you all a fantastic weekend!!
MR GOLD

Analysis and layout of the latest gold trend in the evening📰 Impact of news:
1. The United States issues new sanctions on Iran
2. Trump continues to criticize the Federal Reserve
📈 Market analysis:
The 1H moving average of gold has shown signs of turning downward. If a death cross structure is formed subsequently, it will open up further downward space. From the market point of view, the price of gold rebounded to around 3364 after the release of non-agricultural data. This position constitutes a short-term key resistance level. If the rebound is under pressure here during the US trading session, short selling on rallies can still be considered. Although the price of gold has started to decline, it has not been able to fall below the important support of 3,300, so the long-term direction remains unchanged. At the same time, we need to pay attention to the effectiveness of the 3310 support line in the short term, and consider long trading only after the bottom is confirmed. For short-term trading, consider shorting at 3340-3350, and look to 3320-3310
🏅 Trading strategies:
SELL 3340-3350
TP 3320-3310
If you agree with this view, or have a better idea, please leave a message in the comment area. I look forward to hearing different voices.
TVC:GOLD FXOPEN:XAUUSD FOREXCOM:XAUUSD FX:XAUUSD OANDA:XAUUSD

Long positions have made profits, focus on support📰 Impact of news:
1. The United States issues new sanctions on Iran
2. Trump continues to criticize the Federal Reserve
📈 Market analysis:
At present, the gold price has touched 3340. If it stabilizes here, we can arrange to go long. However, the gold price is constantly testing downwards, which is why I did not arrange to go long immediately. At the same time, we need to be vigilant about whether the gold price will fall below the important support of 3330. If it really falls below 3330, the gold price may test the support of the integer mark of 3300, which will also determine the future market trend.
🏅 Trading strategies:
SELL 3400-3370
TP 3340-3330-3300
BUY 3335-3330
TP 3350-3370
SELL 3325-3320
TP 3310-3300
If you agree with this view, or have a better idea, please leave a message in the comment area. I look forward to hearing different voices.
OANDA:XAUUSD FX:XAUUSD FOREXCOM:XAUUSD FXOPEN:XAUUSD TVC:GOLD

AJA's Gold view. The Bear is in charge for now.Just the start of the Bearish move.
Like I analysed. For now, we're selling till 3315.
Check my last analysis. What do you think?

H4 PLAN FOR GOLD. SIMPLE TRADING DIRECTION.As we bounced back from a daily resistance, we might fall back to daily FVG. Before that we may jiggle a bit in the 4H support area.

Short gold after reboundOvernight, gold broke through the 3400 mark due to the intensification of geopolitical risks, but plunged sharply due to the reduction of the risk of Sino-US trade decoupling. Because the news swept up and down, it brought certain difficulties to the transaction. Today, we will focus on the NFP market!
After overnight gold plunged to around 3340, it is currently maintaining a small rebound state. Relatively speaking, the rebound potential is weak, and with the sharp plunge of gold in the short term, the market bulls' confidence has been hit. At present, without major good news, it is difficult to make breakthrough progress based on technical support alone. The upper side faces short-term resistance of 3365-3375 area resistance. If gold cannot break through this area in the short term, gold will be weak!
Trading strategy:
Consider shorting gold in the 3370-3380 area, TP: 3355-3345
Gold Overview Strategy June 6The 3-candle D1 cluster did not close above 50% of the main bullish candle on Friday last week. Today's main view will be to BUY to 3413.
Today's resistance is around 3413 for the SELL strategy of the US Session. The Asian-European session is looking for a BUY point. There was just a nice BUY wave around 3363 where the price swept liquidity to 3359.
3382 is the target for the BUY order and this area can SELL Scalp in today's Asian-European session for a recovery wave because today's target is up to 3413 according to the bullish structure.
In the direction of Gold Down, contrary to our analysis, the support zone 3341 and support 3324 will support the upward force of gold prices.
The breakout boundary zone 3382 and 3341. Pay attention to breaking out from important resistances, then do not trade against the trend.
Resistance: 3373-3382-3399-3413
Support: 3357-3341- 3325

Long and short battle break out before NFP,gold operation layout📰 Impact of news:
1. NFP data released
2. Geopolitical situation worsens
3. Trump and Musk start a war of words
📈 Market analysis:
During today's U.S. trading session, we need to pay close attention to the impact of NFP on the market. Bros who trade independently must do a good job of risk control. The gold 1H chart shows that the current gold price is suppressed by the downward opening of the Bollinger Bands. Gold shorts dominate in the short term, and the MACD indicator has a tendency to form a death cross. At the same time, the 5-day moving average and the 10-day moving average form a death cross and move downward, indicating that the gold price is still facing adjustment pressure in the short term. Looking at the 4H chart, we can find that although gold is currently rising on the 4H trend line, gold has not yet fallen back to the right level. Therefore, we cannot rule out the possibility that gold will continue to fall back in the future. The key resistance level above is 3390-3400, and the support level below is 3350-3340, with a focus on the important support level of 3330. Participate in high-altitude and low-multiple in the European session today, and consider retreating to 3350-3340 to place longs
🏅 Trading strategies:
BUY 3350-3340
TP 3365-3385-3395
If you agree with this view, or have a better idea, please leave a message in the comment area. I look forward to hearing different voices.
TVC:GOLD FXOPEN:XAUUSD FOREXCOM:XAUUSD FX:XAUUSD OANDA:XAUUSD
