XAU/USD(20250605) Today's AnalysisMarket news:
U.S. economic data-① ADP employment increased by 37,000 in May, far below the expected 110,000 and the previous value of 62,000. ② The U.S. ISM non-manufacturing index in May fell to 49.9, shrinking for the first time in nearly a year, and the expected increase was from 51.6 to 52.
Technical analysis:
Today's buying and selling boundaries:
3366
Support and resistance levels:
3407
3392
3382
3351
3341
3326
Trading strategy:
If the price breaks through 3382, consider buying in, and the first target price is 3392
If the price breaks through 3366, consider selling in, and the first target price is 3351
Goldprediction

Can gold prices continue to rebound?Market news:
Spot gold rose slightly in early Asian trading on Thursday (June 5), currently trading around $3,382/oz. Supported by a weaker dollar and weaker U.S. data, investors are struggling to cope with growing economic and political uncertainty. Against the backdrop of rising risk aversion demand and weak economic data, gold prices rose slightly. At the same time, tensions between major powers, progress in EU-U.S. trade negotiations, and rising market expectations for a Fed rate cut have further ignited enthusiasm in the gold market, and the possibility of London gold prices rising above the 3,400 mark has increased.
The job market is sluggish, some industries are laying off employees, and wage growth is offset by the cost of living. Inflationary pressures continue, and companies plan to raise prices to pass on tariff costs. The Fed said the economic outlook is unclear and it will continue to monitor data to adjust its policies. As a safe-haven asset in times of political and economic uncertainty, gold tends to perform strongly in a low-interest rate environment.
Investors are closely watching the U.S. non-farm payrolls report to be released on Friday, June 6, for clues to the Fed's next move. In addition, we also need to pay attention to the ECB interest rate decision and the changes in the number of initial jobless claims in the United States on this trading day. The market expects the ECB to cut interest rates by 25 basis points. In the medium and long term, it tends to support the international gold price. In addition, continue to pay attention to the international trade situation and speeches by Fed officials.
Technical Review:
Gold successfully bottomed out yesterday, with the lowest point of the day at 3344, which is not much different from the point of 3345 that we disclosed in the morning. The market point is basically in place. The small non-agricultural positives in the evening helped the gold price to rise further. The high point of gold is gradually approaching the pressure level of 3392. In the short term, the gold price is expected to break through the pressure and continue the upward trend!
The technical side of gold maintains the bullish low-multiple thinking. The daily chart price extends the MA5/10/7-day moving average high point upward, and the RSI indicator is hooked upward above the middle axis. The short-term four-hour chart and hourly chart moving average open upward, the Bollinger band opens upward, and the price is running on the upper and middle track of the Bollinger band. The main idea is to buy at a low price and sell at a high price.
Today's analysis:
Recently, the market, tariff trade policies, and geopolitical tensions have been affecting the strength of the US dollar and gold. Although it seems that gold is fluctuating upward for the time being and has not gone out of the space for a unilateral surge, it can be seen from this week's slow rise that gold is still an absolute buying trend. Therefore, no matter how it adjusts, falls back, or fluctuates, it is an opportunity to buy into the warehouse.
How to plan for the future market? I believe everyone has a clear direction in mind. Buying is very strong, just go with the trend. The important thing is the point. The low point below is moving up, which means that if the gold price drops again, the low point will not fall below 3344. Yesterday, the gold Asian and European sessions were in a volatile adjustment trend. After the release of the US session data, the gold price rose from 3350 to the current price of 3385 and then fell back. In terms of short-term operations, since the high point of the Asian session broke, it is still recommended to buy at a low price and focus on bullish operations.
Operation ideas:
Short-term gold 3350-3360 buy, stop loss 3340, target 3380-3400;
Short-term gold 3397-3400 short, stop loss 3408, target 3360-3340;
Key points:
First support level: 3363, second support level: 3350, third support level: 3333
First resistance level: 3388, second resistance level: 3396, third resistance level: 341

GOLD - where is current Resistance? Holds or not??#GOLD... perfect holdings and bounced back and now market have his ultimat resistance area is 3382-84
Thats play key role from yesterday and in today it will be our key level.
Keep close and only hold shorts below that other use not
Note: above 3382 we will go for cut n reverse on confirmation.
Good luck
Trade wisely

Gold------Buy near 3360-3380, target 3390-3400Gold market analysis:
Recently, the daily gold trading has begun to be a game. Today's idea is to continue buying and looking for buying opportunities. At present, it is an obvious shock rise, not a direct one-sided one. Don't rush to enter the warehouse. Yesterday, the daily line closed positive, and the short-term 3392 was suppressed. The daily moving average began to diverge. There is not much time for high-level shocks. The shock is mainly because this week is a data week. The market has too many uncertainties about the future. For example, yesterday's ADP employment data is like this. There is a more heavy NFP later. I estimate that the shock market will continue before the non-agricultural data. Today, we focus on the opportunity of shock retracement and continue to buy.
The analysis chart shows that the hourly shock range is 3392-3342. Yesterday's daily closing raised the shock platform. Today, we focus on the support of two shock platforms. One is around 3363, which is an hourly shock, and the other is 3354. This position is the moving average and pattern support. These two supports in the Asian session are both buying opportunities. In addition, if it breaks 3392, it may stand on 3400 and start a new bullish pull.
Support 3363, 3354, strong support 3343, suppression 3385, strong pressure 3392, the market strength and weakness watershed 3363.
Fundamental analysis:
The US ADP employment data released this time showed a significant reduction in employment, supporting gold to suppress the US dollar, and also giving the US market a new expectation for non-agricultural.
Operation suggestion:
Gold------Buy near 3360-3380, target 3390-3400

Bull market returns? Aiming at 3400?📰 Impact of news:
1. New uncertainty in Russia-Ukraine negotiations
📈 Market analysis:
The current trend of gold prices is erratic and discontinuous, and only swing trading can be adopted during the day. In the short term, there is a certain pressure at 3385-3395 above. If this resistance area is broken, the gold price is expected to continue to rise. The short-term support below FOREXCOM:XAUUSD is at 3350-3340. At present, the news has a greater impact on the gold price, coupled with the support of market risk aversion, so in the short term, attention should be paid to the break of the upper resistance.
🏅 Trading strategies:
BUY 3370-3365
TP 3385-3395-3400
SELL 3395-3400
TP 3380-3370
BUY 3350-3340
TP 3370-3380
If you agree with this view, or have a better idea, please leave a message in the comment area. I look forward to hearing different voices.
OANDA:XAUUSD FX:XAUUSD FXOPEN:XAUUSD TVC:GOLD

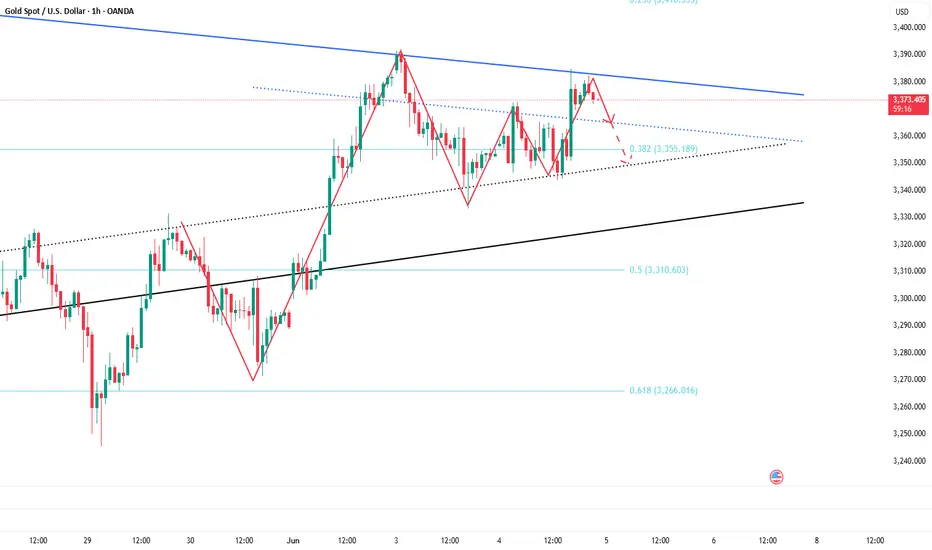
I still have a short position.Although gold has risen sharply to above 3380 due to the intensification of the Russian-Ukrainian conflict, it has not made a substantial breakthrough, and has not stabilized above 3380. The bulls are not determined, which also shows that the technical suppression in the 3290-3295 area above is still strong. If gold does not break through in one fell swoop, gold is likely to usher in a wave of retracement in the short term.
Due to the fundamental impact of tariff issues and geopolitical conflicts, for short-term trading, we should not have too high expectations for the extent of the retracement for the time being, but it is expected to retrace to the 3365-3355 area. In terms of short-term trading, I still hold a short position executed near 3375, and I hope that gold can fall back and hit TP as expected.
Trading strategy:
Consider shorting gold in the 3375-3385 area, TP: 3365-3355
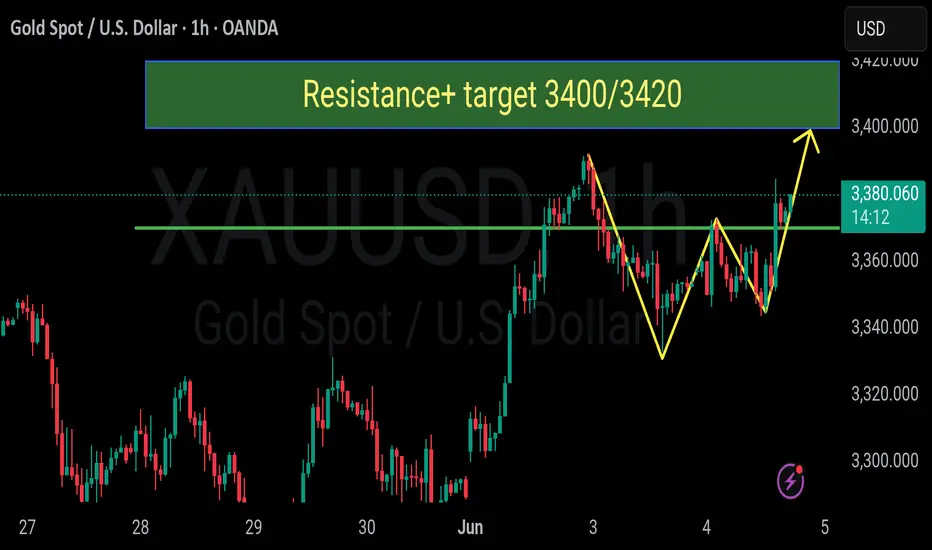
GOLD Intraday Update for 5 June 25as you can see that we already captured nice move since yesterday from 3345 to 3383
for market trading range is 3350-80 if market successfully breaks 3390 then it will move towards 3400 or even 3420
below 3350 it will move towards 3335 level
Disclaimer: Forex is Risky

Gold price fluctuates before NFP data, be careful📰 Impact of news:
1. European Central Bank deposit facility rate in the eurozone as of June 5
2. Initial jobless claims data
3. Non-farm payroll data
4. Worsening geopolitical situation
📈 Market analysis:
Since the release of ADP data last night, gold prices have been rising all the way, reaching a high of around 3382, which is in line with the expected resistance of 3385-3395 we saw yesterday. Currently, the bulls are stable above 3330, and the gold price is still in a bullish trend on the daily chart. Although the current market is in a state of consolidation, there is a possibility of a surge and fall in the short term. Only after a negative line correction occurs, it may continue to be bullish. In short-term trading, pay attention to 3385-3395 on the top and the opportunity to retreat to 3365-3355 on the bottom. Pay attention to data such as initial jobless claims and tomorrow's non-agricultural data.
🏅 Trading strategies:
BUY 3365-3355-3345
TP 3370-3380-3400
If you agree with this view, or have a better idea, please leave a message in the comment area. I look forward to hearing different voices.
TVC:GOLD FXOPEN:XAUUSD FOREXCOM:XAUUSD FX:XAUUSD OANDA:XAUUSD

XAU/USD) Breakout strong bullish trend Read The captionSMC Trading point update
Technical analysis chart of gold (XAUUSD) on the 4-hour timeframe. Here’s a breakdown of the key ideas presented in the chart:
---
Key Support/Resistance Zone
A yellow rectangular zone marks a significant support/resistance level.
This level was previously a resistance and has now been flipped into support ("new support level").
---
Trend Analysis
Uptrend line (lower diagonal line): Shows support and higher lows forming a bullish structure.
Downtrend lines (upper diagonals): Show past resistance levels being tested.
Strong downtrend line has now been broken, which is bullish.
---
Target Points
Three bullish targets are marked:
1. $3,436.70
2. $3,500.93
3. $3,647.33
These targets seem to be based on:
Breakout above the resistance zone.
Measured move projections from previous impulsive rallies.
---
Technical Indicators
200 EMA (Exponential Moving Average): Currently at $3,261.87, acting as dynamic support.
RSI (Relative Strength Index):
Current RSI is 54.80, indicating neutral momentum.
Previously touched overbought zone (~69), indicating strong recent bullish momentum.
---
Arrows
Green arrows mark strong bullish bounce points.
Red arrow marks a rejection from the downtrend line (previous resistance).
Mr SMC Trading point
---
Conclusion (Idea Summary)
Price has broken out of consolidation and downtrend resistance.
If the price holds above the yellow support zone and 200 EMA, a bullish continuation is likely.
Targets: $3,436 → $3,501 → $3,647.
Confirmation of breakout and momentum depends on volume and RSI behavior in coming candles.
---
pelas support boost 🚀 analysis follow)

Gold points to 3400, madness before data release.Market analysis:
Gold fell slightly to around 3361 in early trading on Wednesday. After falling to around 3346, it quickly rose to around 3372, then was blocked and fluctuated and fell. It fell to 3344 in the European session and then rebounded. It rose strongly to 3384 in the US session and fluctuated above 3370 in the late trading.
The daily line of gold showed a trend of alternating yin and yang. But the overall trend was upward. The 5-day moving average and the 10-day moving average formed a golden cross and extended upward, which provided moving average support for the gold price, allowing gold to maintain a strong and volatile trend. At present, the 5-day moving average is around 3352, and the 10-day moving average is around 3335. The first thing to pay attention to is the resistance of Tuesday's high of 3392. If the gold price can break through this resistance level, it is expected to continue the bullish trend.
In terms of points, first pay attention to the support near MA5/MAA10 below, and focus on the support of MA20 moving average. The downward exploration on Tuesday and Wednesday both defended the MA20 moving average position. Above this, it is treated as a strong shock. Secondly, pay attention to the support near 3335, which is the low point on Tuesday and the key to the short-term structure. Secondly, pay attention to the support near 3335, which is the low point on Tuesday and the key to the short-term structure. First pay attention to the resistance near 3395 above, and then pay attention to the resistance near 3415 and 3430, which are the previous high points.
Operation strategy:
Short near 3395, stop loss 3410, profit range 3380-3360
Long near 3360, stop loss 3350, profit range 3375-3380-3390-3400.

XAU/USD) Technical analysis Read The captionSMC trading point update
Technical analysis of Gold (XAUUSD) on the 1-hour timeframe. Here's a breakdown of the key ideas in the analysis:
---
Chart Elements:
Support Level (Yellow Zone at ~3,340–3,350):
This area has been highlighted as a key support zone where price has bounced previously.
Price is currently hovering just above this level.
Downtrend Line:
A descending trendline is drawn, indicating a short-term bearish trend.
A breakout above this line could trigger bullish momentum.
Two Scenarios Outlined:
Bullish Scenario:
If price breaks the downtrend and holds above support, it may rally towards the upper target point at 3,419.68.
Bearish Scenario:
If price breaks below the support, the next target point is marked lower around 3,300.62, a previous consolidation area and close to the 200 EMA (blue line).
200 EMA (~3,324.72):
Acts as dynamic support. If price moves below it, bearish sentiment may increase.
RSI (Relative Strength Index):
RSI is neutral (~50.54), not showing overbought or oversold signals, leaving room for movement in either direction.
---
Key Takeaways:
Neutral-Biased Setup: The price is consolidating between a clear support level and downtrend resistance.
Confirmation Needed: A breakout from either direction is necessary to confirm the next move.
Bullish Breakout: May lead to a retest of highs at 3,419.68.
Bearish Breakdown: Could push the price toward 3,300.62, aligned with past support and the 200 EMA.
Mr SMC Trading point
---
Trading Ideas (based on this analysis):
Long Entry: On breakout above the downtrend line + confirmation above 3,360.
Short Entry: On breakdown below 3,340 with strong volume.
Stop-Loss: Just outside the consolidation zone depending on trade direction.
Risk Management: Be cautious around economic news (calendar icons shown suggest upcoming events).
Please support boost this analysis )

Trading Strategy After ADP Nonfarm NewsPay attention to the trading range in the US session when ADP news is released. 3365 and 3343 are sideways ranges.
We can wait for a breakout trading strategy of this price range.
H1 closes above 3350, we will have a trading strategy towards 3365 and wait for the reaction in the next range. If it breaks, DCA will go up to 3390.
If it closes below 3351, wait for it to close below 3343 and retest to SELL to 3325

Gold's Bullish Comeback Inverted Head & Shoulders Pattern📊 Chart Analysis
This is a 1-hour chart of XAU/USD (Gold Spot vs. USD) showing a classic Inverted Head and Shoulders pattern — a bullish reversal formation.
🔍 Pattern Breakdown:
Left Shoulder: Formed in early May.
Head: Deep dip mid-May.
Right Shoulder: Developed in late May.
Neckline Breakout: Price has broken above the neckline with strong bullish momentum.
📈 Key Levels:
🔵 Bullish Confirmation: 3,278.395 (breakout level, neckline)
🔼 First Target: 3,410.372 🔴
🎯 Final Target: 3,495.774 🚀
📉 EMA 70 (3,316.651) is acting as dynamic support, aligning with the bullish scenario.
🧠 Interpretation:
As long as price stays above the bullish zone (3,278), the bias remains strongly bullish.
Traders might consider entering on pullbacks or breakouts with stops below the right shoulder or neckline.
📌 Summary:
✨ Bullish Reversal Unfolding
💹 Breakout confirmed
🎯 Targeting higher highs

Gold Approaches Historical Highs Once AgainOver the last three trading sessions, gold has gained just over 3%, and is once again approaching the $3,400 zone, where historical highs are currently holding. For now, the bullish bias behind the precious metal has remained intact, as market uncertainty continues to rise steadily due to developments related to the trade war and the ongoing conflict in Ukraine.
Risk aversion has started to increase following recent comments from Donald Trump regarding a potential new escalation with China if negotiations fail to reach an agreement. Additionally, the proposed peace deal for the Ukraine conflict appears to be more delayed than expected, which has caused CNN’s Fear and Greed Index to shift from the “greed” zone into “neutral,” reflecting a decline in short-term investor confidence.
It is important to note that in this type of scenario, gold stands out due to its safe-haven status, and these types of events have acted as important catalysts to sustain the current buying momentum over the past few sessions.
Uptrend Remains Intact
Since the first days of January this year, gold has maintained a steady uptrend. So far, bearish corrections have been insufficient to break the formation seen in recent weeks. At present, the price is once again testing the resistance area marked by historical highs, and if it manages to break through this level, it could signal a stabilization of the upward trend in the sessions ahead.
RSI
The RSI line continues to rise above the 50 level, indicating bullish momentum in the short term. If the line continues to climb, buying pressure could become more significant in the near term.
TRIX
Although the TRIX line remains above the neutral 0 level, its current downward slope suggests that buying momentum has entered a period of consolidation. Unless the line recovers, it will continue to reflect that the strength of the exponential moving averages is entering a short-term neutral phase.
Key Levels to Watch:
$3,400: Resistance located at recent historical highs. A breakout above this level could activate a stronger bullish bias and reinforce the ongoing trend.
$3,300: A nearby support level aligned with the midpoint of a potential short-term horizontal channel. It may act as a barrier to further downside corrections.
$3,200: A critical support level aligned with the ascending trendline. Selling activity below this level could put the current uptrend at risk.
Written by Julian Pineda, CFA – Market Analyst

XAUUSD BULLISH SETUP. GOLD GOES 'PREPARING FOR SUMMER'Gold spot prices have experienced significant volatility and notable technical developments over the past several months. Since the start of 2025, gold surged by over 25%, reaching an all-time high of $3,500 per troy ounce in April before retracing to hover near $3,300 by late May.
This rally was fueled by persistent geopolitical tensions, particularly in the Middle East, and a weaker US dollar, which made gold more attractive to international buyers.
Technically, gold entered a parabolic upswing earlier in the year, becoming extremely overbought before breaking below its parabolic trend, signaling a potential top and the start of a corrective phase.
The Relative Strength Index (RSI) has recently dropped below 52, its lowest since February, reflecting weakening bullish momentum. The Average Directional Index (ADX) near 15 also indicates a lack of strong trend direction.
Key support levels are identified at $3,196 (55-day SMA), $3,120 (May low), and $3,031 (100-day SMA), while resistance sits at $3,350.
We are looking forward to further Gold accumulation, ahead of scorching hot summer months.
--
Best wishes,
@PandorraResearch Team 😎

XAU/USD H1 CHART OUTLOOKGold is Now moving in the range of 3375/3380 and it is making strong bullish scenario which indicates us to put BUY trades.
1st Target ::: 3400
2nd Target ::: 3410
Final target : 3420
Stop loss just below 3365
XAU/USD(20250604) Today's AnalysisMarket news:
Fed Logan: We should focus on achieving the 2% inflation target, rather than trying to make up for past inflation shortfalls; Bostic: We still think there may be a rate cut this year.
Technical analysis:
Today's buying and selling boundaries:
3359
Support and resistance levels
3417
3395
3381
3337
3322
3301
Trading strategy:
If the price breaks through 3359, consider buying, the first target price is 3381
If the price breaks through 3337, consider selling, the first target price is 3322

Gold should beware of unexpected employment data explosion!Market New s
On Wednesday (June 4) in the Asian market, spot gold fluctuated slightly and is currently trading around $3,346 per ounce. The international gold price fell 0.83% on Tuesday, after hitting a high of $3,392 since May 8. The price decline was mainly suppressed by the rebound of the US dollar exchange rate. At the same time, the tense international trade situation, the weakness of the US labor market and the cautious attitude of the Federal Reserve have cast a fog of uncertainty over the gold market.However, the market remains vigilant about the global situation. The continued expansion of the US fiscal deficit, the escalation of trade tensions between Asian powers and the United States, and the failure of the second round of peace talks between Ukraine and Russia have led to market risk aversion still supporting London gold prices. The Fed's wait-and-see attitude and cautious assessment of inflation expectations have further increased market uncertainty. Pay close attention to Friday's non-farm payrolls data and the Fed's policy guidance to determine the next wave of gold price movements. In addition, this trading day pays attention to the US ADP employment data in May and the US ISM non-manufacturing PMI data in May, as well as news related to the international trade situation. News related to the geopolitical situation also needs to be paid attention to.
Technical Review
Gold rose strongly overnight because Ukraine directly blew up 41 Russian fighter jets. Today, the expected rhythm was completed and the bottom rebounded. In the four-hour chart, the hourly chart price still maintains the upper track of the Bollinger Band channel, and the daily chart MA10-day moving average 3326 and the 5-day moving average 3340 are running above. In the wide range of market fluctuations, short-term participation is the main. Intraday callbacks are still mainly low-price buying. In terms of the moving average system, the short-term moving average diverges upward, providing certain support for the price, but the deviation rate from the long-term moving average has a trend of shrinking, so beware of price corrections. At the 4-hour level, the 5-day moving average crosses the 10-day moving average to run. If the hourly price can effectively break through the upper edge of the recent fluctuation range of 3400, it is expected to usher in a wave of rising prices in the short term; on the contrary, if it falls below the lower edge of 3300, it may further explore.
Today’s analysis
Gold rebounded in the Asian session and then rushed up directly, and the center of gravity of the rebound low point is also constantly moving up. At present, from the one-hour market, the short-term gold price has stabilized above the top and bottom conversion position of 3340, and it also remains above the upward trend line. Buying is strong. For the future trend, we still have a buying mindset!
Gold price rebounded to the lowest level of 3346 in the Asian session, and the buying energy is relatively strong, but I still suggest that you don’t chase orders. There is no good thing in the Asian session. Chasing the rise is easy to be trapped at a high point. We only need to pay attention to two points in the Asian session, which are the key position of 3330 and the short-term support level of 3346. If there is a rebound to 3350 during the session, start ambush buying!
Operation ideas:
Short-term gold 3350-3360 long, stop loss 3330, target 3370-3400;
Short-term gold 3370-3380 short, stop loss 3350, target 3340-3320;
Key points:
First support level: 3338, second support level: 3326, third support level: 3303
First resistance level: 3370, second resistance level: 3386, third resistance level: 3396

Gold Market Analysis and Trading Strategy### Key Technical Levels & Patterns
1. Resistance Zones:
- $3,365–$3,392: Critical resistance levels. Breaking $3,365 with high volume could signal a bullish breakout, targeting $3,392 and beyond.
- $3,387–$3,357: A broader resistance zone identified by inverse head and shoulders and descending broadening wedge patterns. A break here may confirm an impulsive wave (per Elliott Wave theory).
2. Support Levels:
- $3,328–$3,342: Key support areas. A failure to hold these could trigger a short-term correction.
- $3,304.749: A strong support zone (green zone) that could act as a bearish target if the price breaks below it.
3. Demand Zones:
- $3,356.50: A defined demand zone with confirmed bullish reactions (e.g., wick rejections). Entry suggested just above this level with a stop-loss below $3,344.50.
### Fundamental Drivers
1. Geopolitical Tensions:
- Ukraine-Russia conflict: Escalating tensions are fueling safe-haven demand for gold.
- Middle East instability: Recent escalations are adding pressure on gold as investors seek refuge.
2. U.S.-China Trade Tensions:
- Trump’s threat to double tariffs on steel/aluminum has heightened market uncertainty, pushing investors toward gold.
3. U.S. Dollar Weakness:
- A weaker dollar (e.g., USD index near monthly lows) supports gold prices, as gold is priced in USD.
4. Federal Reserve Policy:
- Market expectations of a September rate cut and potential December cuts are bullish for gold. Powell’s speech could trigger volatility.
### Trading Strategies
1. Bullish Breakout Setup:
- Entry: Above $3,365–$3,372 with tight stop-loss (e.g., $3,360).
- Targets: $3,392 (short-term) and $3,400–$3,450 (mid-term).
- Risk Management: Strict stop-loss below $3,325 to protect against false breakouts.
2. Scalping Opportunities:
- Key Scalp Zones: $3,332–$3,352 (intraday pullbacks).
- Strategy: Buy on dips near $3,328–$3,342 if the price stabilizes.
### Key Watchpoints
- $3,365: A critical level for confirming bullish momentum.
- $3,325: A psychological support level that could act as a short trigger if broken.
- Fed Chair Powell’s Speech: Potential for emotional moves or reversals.
- Volume Confirmation: High volume on breakout levels (e.g., $3,365) is essential for validity.
### Risk Management & Recommendations
1. Stop-Loss Discipline:
- Always place stops below key support levels (e.g., $3,325) to limit losses.
- Avoid holding positions without a clear plan.
2. Position Sizing:
- Use smaller positions in volatile environments to manage risk.
3. Monitor Volatility:
- Gold may experience sharp swings due to geopolitical and macroeconomic factors. Stay alert.
4. Follow Trends:
- Short-term: Focus on $3,325–$3,392 range.
- Mid-term: Watch for a breakout above $3,400, targeting $3,450–$3,480.
### Conclusion
Gold is in a bullish phase, driven by geopolitical risks, weak USD, and Fed policy expectations. Key levels like $3,365 and $3,392 are critical for confirming momentum. Traders should focus on breakout strategies, scalping in pullbacks, and strict risk management. However, always do your own research and consult a financial advisor before making trades.
Final Note: The market is volatile, and news events (e.g., Powell’s speech) could cause rapid reversals. Stay informed and flexible! 🚀

Gold Pullback Entry Opportunity Gold resumed its rally, sparked by recent tarrif news. Price is pulling back at the moment and has entered an sweet spot where we can confidently take our first low risk Buy.
BUYING HERE BECAUSE
1. We're entering into a low volume area, which is also in line with an FVG on the 1hr chart
2. When a new uptrend starts, i like to buy first 2 instances price pullback to bounce from my trend cloud indicator We didn't get a perfect bounce as it has broken below it, but i'am still buying regardless due to my first reason above about the low volume gap.
PROFIT TARGET
Setting my profit target to my trusted Exofade peak. As long as the uptrend continues, Exofade peaks will ALWAYS get taken out. That why i love this indicator, and its free. It's my gift to y'all :) . Just search for it in trading view indicators.

GOLD - at major supporting area. holding??#GOLD,.... market just reached at his today most expensive area that is around 3345-46 to 3350-51
keep close that region because that will be our today most important support and holding of that area means another bounce expected .
good luck
trade wisely

BULLS VS BEARS WILL GOLD MATCH ATH?Glossary:
Ged = Bearish scenario
Green = Bullish scenario
POI = Point of interest
ATH = All time high
LQ = Liquidity zone
Gold since the beginning has been moving in a range and break fashion you'll see this across the board, always. A 4hr range is in the process of being formed ideally what wed like to see is for the high to be matched first. That simply would give more confidence for the bears to get in and short the market however now we sit with the though of where will it go first?
preferred bias
Buys to sell, ideally and the most logical outcome is the highs do get matched forming a strong liquidity zone that can be targeted at a future date, as price begins to fall new points of interest can then be formed (since there isn't a lot to target above right now), this will allow the market to have areas it can market when we see the bullish side of this range play out when ever that may be.
Structure
Current structure allows you to get in trades, previous structure allows you to get out of trades use it to your advantage, think. where does the money want to move next where will the banks get the best bang for their buck and most importantly where can we cause traders to LOSE, a trade you win is a trade someone else lost. so long you stick with where the big guys want to go you'll be on the right side
Bullish bias (green)
Key points get broken, imbalance fill, ATH matched (this is where short orders get stacked, future sweep target.
Bearish bias (red)
Area 1 , this is the first key low im looking to break if we see a candle close below continue to area 2, there are traders who WILL get stopped out at zone 1
Area 2 , this is our next key point in structure there will still be traders with open positions here also, again if we see a candle close below this zone continue to monitor for Area 3
Area 3, this may be a final target, however there's still POI's sat below if price shows strong signs of bearish momentum target Areas 4 and below can be open for discussion
Conclusion
personally i would like to see POI's built on the buy side as of right now before we move down simply because the market NEEDS somewhere to move from and to without that it would be erratic.
If you found this helpful be sure to boost this idea, give a like and a follow, consistent charts will be posted on a weekly basis and let me know what you think down in the comment section too :)

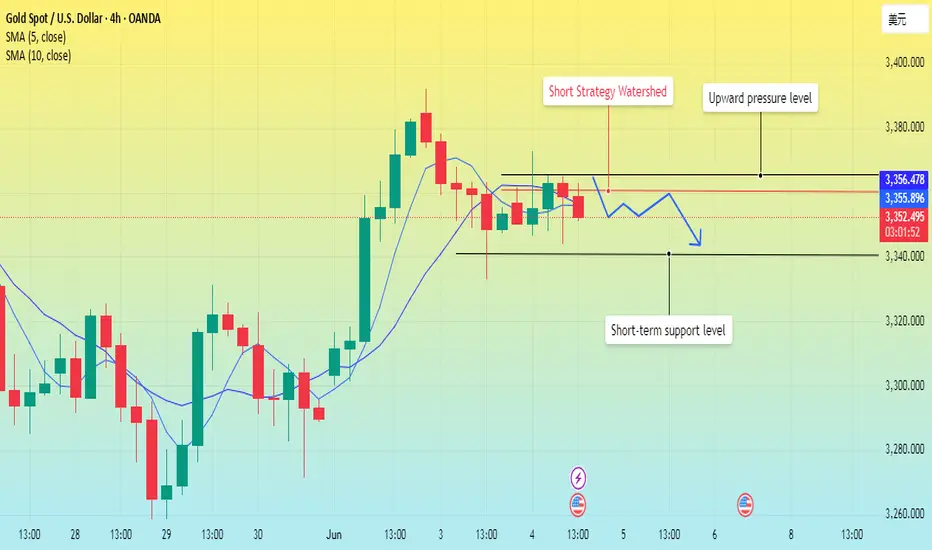
Gold fluctuates. It is expected to retreat.Gold continued its strong performance on Monday in the early trading yesterday and reached a high of around 3391 before starting to fall all the way. It was weak and downward in the European trading. The US trading quickly fell back to around 3335 and then rose again. However, it touched the 3372 line again in the morning and continued to fall, forming a large range of fluctuations.
Affected by the ADP data, although the positive impact is large, it is very likely to be just an illusion given to the market, not to achieve a strong effect. The key pressure position above is maintained at around 3360, which may play the role of a watershed between long and short positions, and the strong pressure above will also be maintained at 3365; the support position below is around 3340. Once this position is broken, the room for decline may be expanded in the later period.
Although the MA5-day and 10-day moving averages have the intention of forming a golden cross, they have not completely released the energy of the bulls, making the market more unpredictable for the bears. In the correction of the bulls' strong upward movement, there was no further effort. Perhaps this is one of the signs of bull exhaustion. The current channel position formed from 3391 also gives the bulls enough pressure. Only by breaking through this position again can a strong upward trend be achieved.
Operation strategy:
Short near 3360, stop loss 3370, profit range 3345-3330.