Analysis of the latest gold price trends!Market news:
In the early Asian session on Wednesday (June 11), spot gold fluctuated in a narrow range and is currently trading at $3,330 per ounce. London gold prices rose and fell on Tuesday as the conflict between Russia and Ukraine continued and the World Bank also lowered its global economic growth forecast. Traders are closely watching the Sino-US trade negotiations, the results of which may ease trade tensions and boost the global economy, thereby reducing the demand for safe-haven assets, while the continued rise in US stocks has also suppressed the safe-haven buying demand for international gold.In the past few days, gold has fallen from its recent highs, mainly because the market has optimistic expectations for negotiations between China and the United States and Britain and Russia. If the United States and China reach a trade agreement, it will weaken the attractiveness of gold as a safe-haven asset. Gold is a hedge investment tool and usually rises during periods of geopolitical and economic uncertainty. The market is currently focusing on the upcoming US CPI data for May. Expected data show that inflation may rise slightly to 2.5%, with core CPI around 2.9%. If the data exceeds expectations, it may be bearish for gold in the short term; if inflation slows down, it will strengthen the market's expectations for the Fed to cut interest rates this year, which is bullish for gold prices.
Technical review:
Technical daily chart continues to close with alternating yin and yang cycles, the moving average is glued together, and the RSI indicator runs on the middle axis. The moving average of the four-hour chart is glued together, the price is adjusted near the middle track of the Bollinger Band, and the RSI indicator is flat. Gold rose above 3349 yesterday and fell back to 3320 in the early morning. After a sharp drop to 3315 in the Asian session, it needs to break the low point of 20 in the early morning and then quickly rise to 3331. Pay attention to the 3320 position in the Asian session. If 3320 stabilizes and moves upward, continue to look at the test of 3340/50 during the day. Otherwise, if it loses again or adjusts around 20 during the day, it will be regarded as a weak sell. Pay attention to 3306/3293 below. Gold technical aspects continue to be arranged with a shock idea. Under the premise that there is no news to stimulate the selling, gold continues to maintain low-price buying as the main technical aspect, and high-price selling as the auxiliary.
Today's analysis:
From the daily level, gold is in a high-level shock consolidation since the peak of 3500. The current highs of 3500, 3435, and 3403 are gradually moving down, and the lows of 3120, 3245, and 3293 are gradually rising. The shock range is gradually narrowing. The short-term market may continue to maintain shocks. If it breaks, it needs to wait for the direction of the breakthrough to be stimulated by major news!
So today's lock range is 3293-3360. It is recommended to sell at high prices and buy at low prices to treat shocks, mainly short-term or ultra-short-term, and do not chase ups and downs before the range is effectively broken.
Operation ideas:
Buy short-term gold at 3310-3330, stop loss at 3292, target at 3340-3360;
Sell short-term gold at 3350-3363, stop loss at 3362, target at 3300-3310;
Key points:
First support level: 3320, second support level: 3306, third support level: 3292
First resistance level: 3346, second resistance level: 3358, third resistance level: 3376
Goldprediction
GOLD ROUTE MAP UPDATEHey Everyone,
Another solid day on the charts, with our analysis unfolding exactly as anticipated.
As mentioned yesterday, after the cross and lock above 3318, we identified a gap at 3352 that remained unfilled, acting as a magnet for price action. Since then, price has been consolidating in a tight range between 3318 and 3352.
Today, we saw a perfect move up, completing the target at 3352. From here, we’ll be watching for a confirmed cross and lock above 3352 for a continuation. If price fails to lock above, we could see rejections leading back into the lower Goldturns, where we’ll look for support and bounce.
We will keep the above in mind when taking buys from dips. Our updated levels and weighted levels will allow us to track the movement down and then catch bounces up.
We will continue to buy dips using our support levels taking 20 to 40 pips. As stated before each of our level structures give 20 to 40 pip bounces, which is enough for a nice entry and exit. If you back test the levels we shared every week for the past 24 months, you can see how effectively they were used to trade with or against short/mid term swings and trends.
The swing range give bigger bounces then our weighted levels that's the difference between weighted levels and swing ranges.
BULLISH TARGET
3318 - DONE
EMA5 CROSS AND LOCK ABOVE 3318 WILL OPEN THE FOLLOWING BULLISH TARGETS
3352 - DONE
EMA5 CROSS AND LOCK ABOVE 3352 WILL OPEN THE FOLLOWING BULLISH TARGET
3388
EMA5 CROSS AND LOCK ABOVE 3388 WILL OPEN THE FOLLOWING BULLISH TARGET
3428
EMA5 CROSS AND LOCK ABOVE 3428 WILL OPEN THE FOLLOWING BULLISH TARGET
3478
BEARISH TARGETS
3281
EMA5 CROSS AND LOCK BELOW 3281 WILL OPEN THE FOLLOWING BEARISH TARGET
3254
EMA5 CROSS AND LOCK BELOW 3254 WILL OPEN THE FOLLOWING BEARISH TARGET
3210
EMA5 CROSS AND LOCK BELOW 3210 WILL OPEN THE SWING RANGE
3179
3146
As always, we will keep you all updated with regular updates throughout the week and how we manage the active ideas and setups. Thank you all for your likes, comments and follows, we really appreciate it!
Mr Gold
GoldViewFX

Clear Short opportuniy on Gold According to CCI Under Zero and -100
According to Breakout of Uptrendline
According to Divergence
To double Top ....etc
Gold fluctuates widely, strategy remains unchanged
📌Gold news
The US and Chinese delegations will continue talks in London for the second consecutive day. President Trump expressed optimism, saying the talks "should go well". US officials said the talks could lead to Washington lifting certain technology export restrictions in exchange for Beijing relaxing controls on rare earth exports - a material that is critical to industries such as energy, defense and advanced technology. The results of these negotiations may provide a new direction for precious metals
📊Comment analysis
The European session continued to retrace and gave a low of 3293, then slowly strengthened. The current high reached 3349, so today's strategy does not need to be changed for the time being. If the current market is given to 3335-3345 again, short orders can still be entered. The current trend is still weak, and the US market is likely to follow the old path of a second decline, so the current idea of shorting on the pullback remains unchanged for the time being!
💰Strategy package
Gold: Short on rebound 3335-3345, stop loss 3350, target 3300-3280!
⭐️ Note: Labaron hopes that traders can properly manage their funds
- Choose the lot size that matches your funds
-

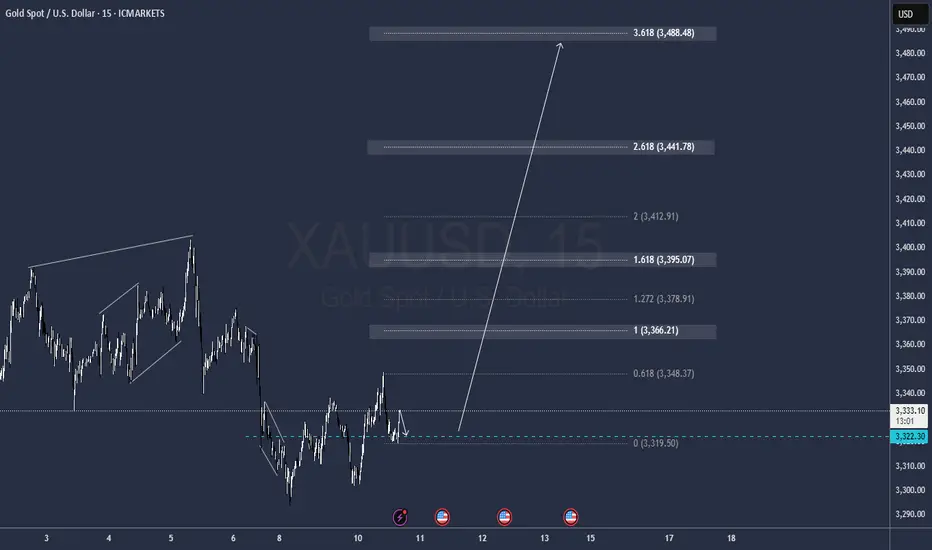
Gold/XAUUSD Move 9th June 2025🔍 XAUUSD Analysis – June 10, 2025
Market Structure:
Market remains in a bearish sequence, with lower highs and lower lows intact on the HTF.
The current bullish leg is corrective, retracing into a well-defined supply zone at 3333–3338.
This zone previously triggered strong selling pressure, marking institutional activity.
Key Supply Zone:
3333–3338: Strong supply zone aligning with previous bearish OB and unmitigated FVG.
Expecting a liquidity grab above intra-day highs, followed by rejection from this zone.
Invalidation Level:
If price closes above 3340 with strength (especially on M15/H1), the bearish bias is invalidated, and we may shift toward the upper supply zone around 3375–3380.
Target Zone:
3295–3305: Strong demand area from which the last impulsive move originated.
Also a logical draw for liquidity resting below prior lows.
💼 Trade Idea:
Type: Sell Limit
Entry Zone: 3333–3338
Stop Loss: Above 3344 (structure break buffer)
Take Profit 1: 3310
Take Profit 2: 3300
Risk-to-Reward: ~1:2+
🧠 Execution Plan:
Wait for price to enter the 3333–3338 supply zone.
Look for LTF confirmations: bearish engulfing, BOS, or CHoCH (M1/M5).
Enter short on confirmation with SL above zone and scale out at each TP level.
The US CPI data is coming soon
💡Message Strategy
During the New York trading session on Tuesday (June 10), spot gold staged a "high diving" trend, with the price of gold falling sharply by about US$30 from its high.
Regarding the Sino-US trade negotiations, US Commerce Secretary Lutnick said on Tuesday that the negotiations were progressing "very, very smoothly." He said he hoped the negotiations could be concluded on Tuesday night, but if necessary, they would continue on Wednesday.
📊Technical aspects
Yesterday's gold trend was still in line with my bearish thinking. In the short term, due to today's CPI data, we remained cautious yesterday and the trend was volatile and bearish. Today's heavy CPI data will break the volatility.
Today's idea is still to follow the trend and be bearish. Pay attention to the support near 3340. If it can still rise to 3350-60 during the day, it will be a good opportunity to open a short position.
If the data performance meets our bearish expectations, gold is likely to generate a profit margin of $100. Always pay attention to trading signals.
💰 Strategy Package
Short Position:3340-3355,3355-3365

How to plan for the positive effects of CPI data?📰 Impact of news:
1. CPI data is profitable
2. The US CPI rose slightly in May, and Trump's tariff effect has not yet fully emerged
📈 Market analysis:
The CPI data is bullish. The current gold price has risen to around 3360. We took profits at the 3330 level and exited the market, which once again confirmed the forward-looking nature of our trading vision. From a technical perspective, the RSI indicator in the short-term hourly chart is close to the overbought area. In the short term, pay attention to the upper resistance line of 3360-3365. If it rebounds to the 61.8% position and encounters resistance and pressure, consider shorting at high levels. On the contrary, if it effectively breaks through and stabilizes above, it is expected to touch the 3400 line. In the short term, pay attention to the lower support line of 3340-3330.
🏅 Trading strategies:
SELL 3360-3365
TP 3340-3330
If you agree with this view, or have a better idea, please leave a message in the comment area. I look forward to hearing different voices.
TVC:GOLD FXOPEN:XAUUSD FOREXCOM:XAUUSD FX:XAUUSD OANDA:XAUUSD
XAU/USD Bullish sign?Current scenario seem , next coming a bullish 3rd leg .Im entering a buy position .Holding till 3350$.
Considering 3340$ as a Resistance area if any reversal sign reflected then exiting there.
Pending orders are still existing in 3369$ so lets see. FX:XAUUSD

Gold CPI data forward-looking layout
📊Technical aspects
Gold trend from the perspective of technical analysis
From the daily technical chart, the gold price has experienced complex fluctuations. Although there have been ups and downs recently, it is still in a relatively high range. In terms of moving averages, short-term moving averages such as the 5-day moving average and the 10-day moving average show a certain entanglement trend, indicating that the short volume is relatively strong in the short term and the short trend is obvious.
From the MACD indicator, its double lines are running below the zero axis. Although the bar chart has shrunk, it still remains in the positive area, suggesting that the bullish force has weakened in the near future, but the overall market is still in a bearish market pattern, and the upward momentum is gradually fading. At present, the RSI value is further downward, indicating that the bearish force will gradually increase.
From the Bollinger Bands indicator, the gold price is currently running below the middle track of the Bollinger Bands, and the Bollinger Bands opening shows a slight narrowing sign. If the price falls below the middle track of the Bollinger Bands and continues to decline, the bearish trend may intensify. If the downward trend accelerates, gold still has a profit momentum of about $100
💰 Strategy Package
Short Position:3330-3340

Gold is in a state of shock again, the market is waiting for CPI📰 Impact of news:
1. May CPI data
📈 Market analysis:
Gold is still fluctuating, and the bulls and bears are currently in a stalemate. The market is waiting for the release of today's CPI data. From the 1H chart, the Bollinger Bands are narrowing, and the gold price is above the 3331 middle track. RSI is stuck at 55, and the MACD golden cross green column is narrowing. For short-term trading, pay attention to the resistance of 3340-3350, and the support of 3320-3310 below.
🏅 Trading strategies:
SELL 3340-3350
TP 3320-3310-3300
BUY 3320-3310
TP 3330-3345
If you agree with this view, or have a better idea, please leave a message in the comment area. I look forward to hearing different voices.
OANDA:XAUUSD FX:XAUUSD FOREXCOM:XAUUSD FXOPEN:XAUUSD TVC:GOLD

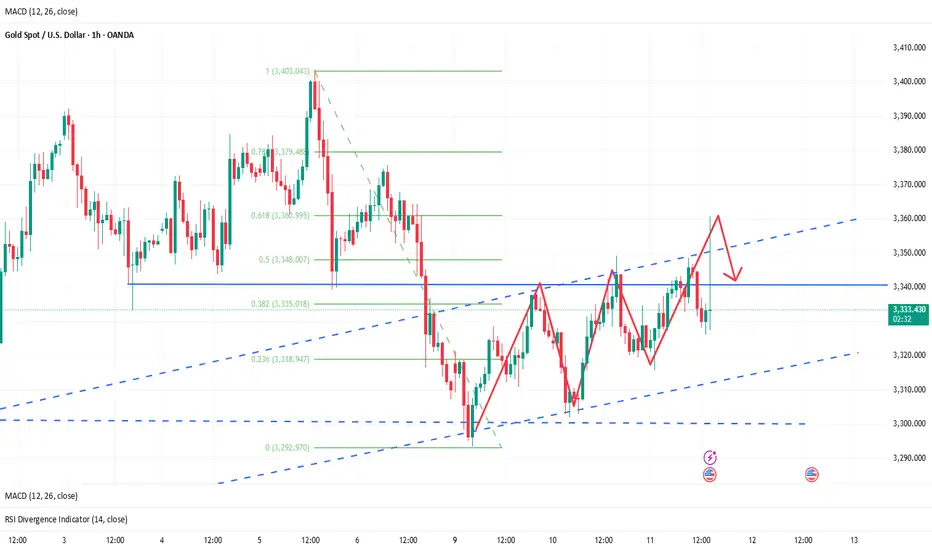
Gold fluctuates, awaiting CPI data.In Asian trading on Wednesday, traders are awaiting the release of the latest U.S. Consumer Price Index (CPI) data for May. Estimates suggest that prices are likely to rise as American households feel the impact of tariffs imposed by the Trump administration. But the easing between the world's two largest economies should have an adverse impact on safe-haven assets such as gold, and the lack of a downward trend in gold prices suggests that investors are waiting for more developments.
In terms of short-term trends, the gold 1-hour chart shows that gold prices remain in an upward channel with a low point. So from the trend, the current momentum for gold to rise will be stronger. The price pullback is giving opportunities to go long.
The change of thinking is actually following the trend. For the current operation, enter the market with the trend, and cover the position when it falls back or break through the profit position to cover the position. In a strong market, during the correction phase, the price is rising, and the amplitude of the correction is often small. The bulls retreated at the opening to accumulate momentum. Above is the pressure level of 3350-3360. Once it breaks through and stabilizes, it will accelerate the upward trend. Just follow the general trend of the market.
Operation strategy:
Go long when the price falls back to 3310-3320, stop loss at 3300, and profit range is 3345-3360.

XAUUSD:Wait for a short near 3345
Yesterday's bears around 3330 and the bulls around 3300 tips have been completed, today's rebound strength is slightly stronger, then the subsequent rebound height is expected to be higher;
Trading Strategy:
SELL@3345
TP:3310-3300
↓↓↓ More detailed strategies and trading will be notified here ↗↗↗
↓↓↓ Keep updated, come to "get" ↗↗↗
“Gold Eyes 4‑Hour Demand at $3,322” 11 June 2025Gold (XAU/USD) has consolidated near $3,332 after an SMC-style structure sweep above $3,338, which likely captured institutional liquidity before a clean CHoCH and pullback toward a key demand zone at $3,322–$3,328. This demand zone held firmly—on a bullish 4‑hour candle—indicating underlying strength.
Key technical confluences:
CHoCH above $3,322 confirms bullish structure.
Price above 200‑SMA and mid-Bollinger Band on 4H.
RSI (~55‑60) and MACD showing resumed bullish momentum.
✅ 4H Entry Strategy Breakdown
Bullish Retest
Wait for price to revisit $3,322–$3,328 with bullish candle formation → enter long.
SL just below $3,312; targets at $3,345 and then $3,355.
Breakout Option
If momentum pushes price above $3,353 resistance, follow the breakout with target zones extending to $3,365–$3,380.
Supply Rejection
Alternatively, watch for reversal patterns near $3,345–$3,353. A confirmed rejection opens a short trade down to $3,322.
Scalp Play
For quicker profits, scalp the bounce from the demand zone with tight stops and targets within the 4‑hour upper range.
Risk note: US CPI and trade headlines may inject volatility. Waiting for candle confirmation is critical to validate setups.

GOLD PAY ATTENTION TO BULISHXAUUSD (Gold) Technical Signal ⚠️ | Price action is forming a classic bull flag pattern, showing consolidation after a strong upward move. The flag is starting to 'blush' — early signs of momentum building for a potential breakout. If price breaks above the upper trendline with volume confirmation, we could see a continuation toward higher resistance levels. Traders, keep a close eye – gold may be preparing for its next leg up. #XAUUSD #GoldSignal #BullFlag #TechnicalAnalysis #ForexSignals #GoldBreakout #PriceAction"

ETH HIT THE LIKE TO MANIFEST THISETH/USD is teasing the breakout zone again... 👀
Are we finally ready for liftoff, or is it another fakeout? 🚀🔄
The chart’s looking spicy, and the energy feels right. 🌌
Hit that like to manifest the pump — we’re in this together. 💎🙏
Let’s speak green candles into existence! 📈✨
#ETH #Ethereum #CryptoVibes #ManifestMoneyMoves #ETHUSD #ToTheMoon"

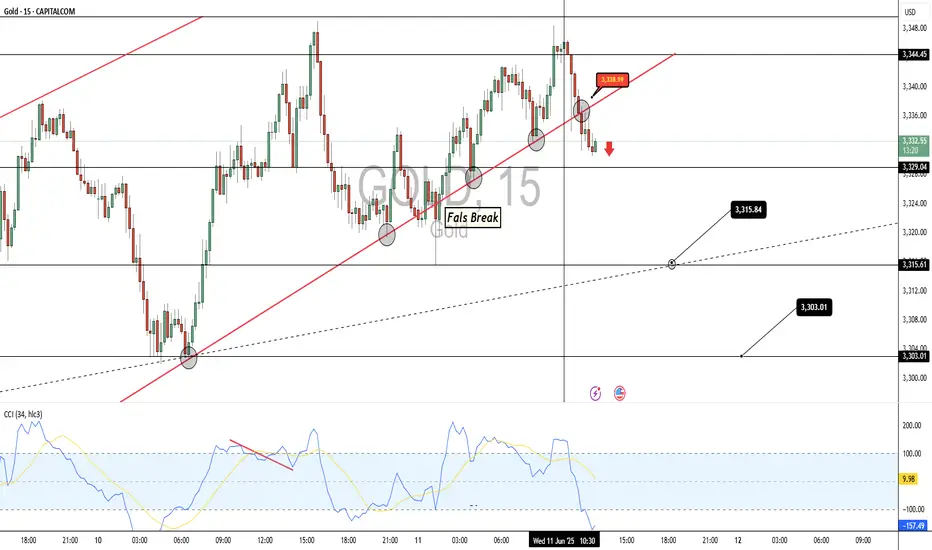
Gold Price Analysis June 11Yesterday's D1 candle was still a balance candle closing below the important breakout zone 3347.
Today's Asian session saw strong buying pressure pushing the price back close to the important resistance zone in shaping the trend. At the end of the Asian session, it failed to break 3342, giving a SELL signal to 3327
The breakout zone 3310 is also very important to wait for price reaction for BUY scalping points. 3295 is an important daily support zone. If there is a price slide from 3295, do not BUY until it touches the support zone 3275.
In the opposite direction of today's Break 3345, wait for 3363-3365 to SELL. The 3345 zone is considered a Breakout zone when broken to trade BUY.

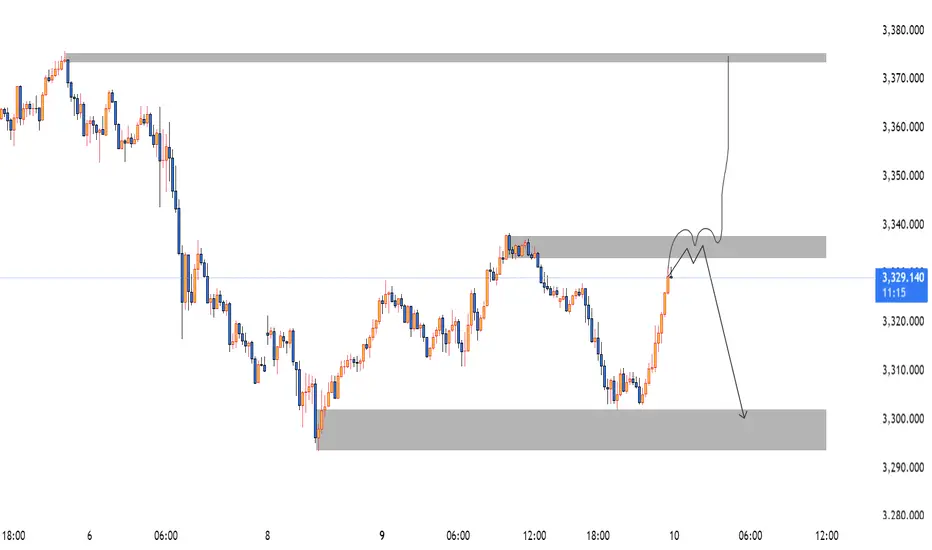
GOLD M30 intraday chart update for 11 June 25Hello Trader, Welcome to the US CPI Day
AS you can see that market is still below 3350 Psychological level with given rewards multi-time from that level
now all eyes on US CPI if market successfully breaks 3350-60 zone today the it will move towards 3370/80 or even 3400 psychological level
below 3350 psychological level market remains bearish for shorter term
Disclaimer: Forex is Risky

Gold continues to fluctuate, CPI data becomes the key
Technically, the daily chart continues to fluctuate sideways, the moving average is glued together, and the RSI indicator runs near the middle axis. The moving average of the four-hour chart is also glued together, the price is adjusted near the middle track of the Bollinger Band, and the RSI indicator also runs near the middle axis. The gold price once broke through the 3349 mark yesterday, and then fell back and closed near 3320.
Focus on the 3320 position during the Asian session. From a technical perspective, the gold price continues to fluctuate in a range. Under the premise of the lack of news stimulating negative impact, from a technical perspective, the gold price continues to maintain low buying.
From the daily level, gold has been fluctuating at a high level since the high of 3500. The current highs of 3500, 3435, and 3403 are gradually moving down, and the lows of 3120, 3245, and 3293 are gradually moving up. The range of fluctuations is gradually narrowing. The short-term market may continue to fluctuate. If it breaks through, it will need to wait for major news stimulation to break through the direction!
💰Strategy Package
Then today's lock-up range is 3293-3350. It is recommended to sell high and buy low. Before the effective breakthrough of the range, short-term or ultra-short-term scalping is the main means.
Key points:
First support level: 3320, second support level: 3306, third support level: 3292
First resistance: 3346, second resistance: 3358, third resistance: 3376
Buy: 3303-3305, stop loss: 3292, target: 3320-3330;
Sell: 3350-3353, stop loss: 3362, target: 3330-3320;
⭐️ Note: Labaron hopes that traders can properly manage their funds
- Choose the number of lots that matches your funds

GOLD PRICE ACTION ANALYSIS – June 11, 2025 GOLD PRICE ACTION ANALYSIS – June 11, 2025 🟡
Technical Breakdown & Bearish Scenario Ahead ⚠️📉
🔍 Overview:
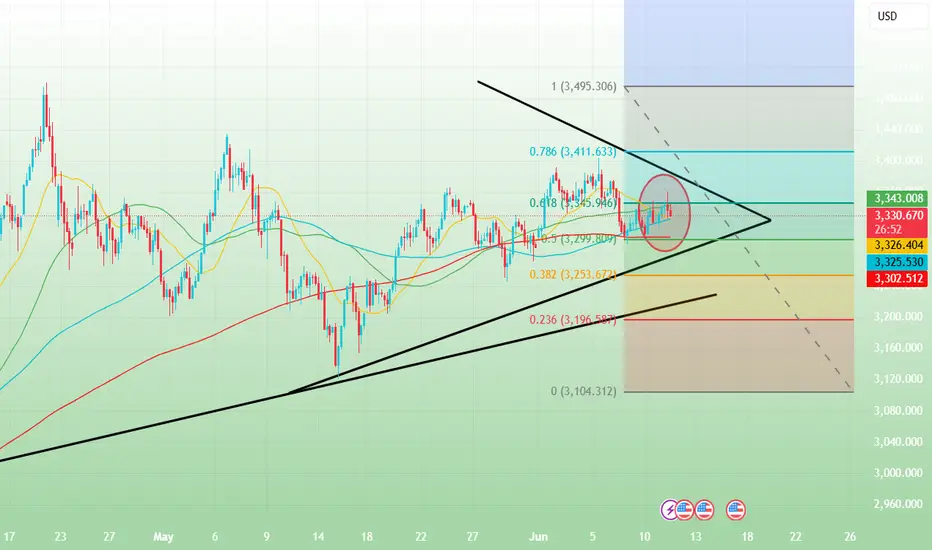
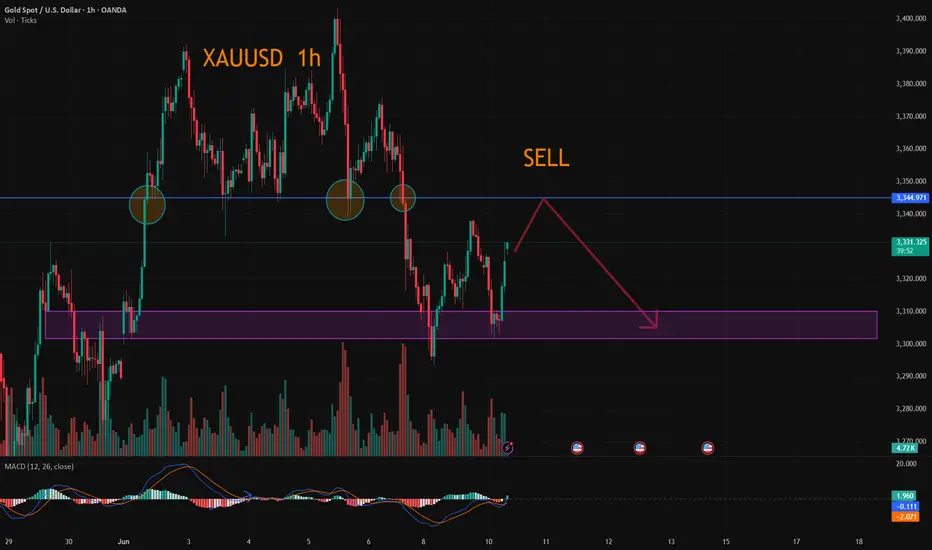
The chart presents a clear range-bound structure with strong horizontal resistance around the $3,400–$3,420 zone and support around the $3,120–$3,160 level. Price is currently trading near the upper range of the consolidation.
📊 Key Technical Levels:
🔴 Resistance Zone: $3,400 – $3,420
➤ Price has been rejected here multiple times (highlighted by red arrows and orange circles), showing strong supply pressure.
🟣 Intermediate Support: $3,260.618
➤ This level acted as a minor support and could be tested again if the current pullback deepens.
🟤 Major Support Zone: $3,120 – $3,160
➤ A key demand area where price previously bounced significantly.
📉 Bearish Setup:
A potential lower high is forming just below the resistance zone.
The projected path suggests a minor pullback to form a bearish retest, followed by a potential breakdown below $3,260.
If the $3,260 support is broken decisively, further downside toward the $3,120–$3,160 support is likely (blue arrow projection).
🔄 Bullish Scenario (Invalidation):
A breakout and strong close above $3,420 could invalidate the bearish structure.
In that case, price might attempt to target higher resistance levels beyond $3,440.
📌 Conclusion:
Gold remains in a range with a bearish bias unless the $3,420 resistance is breached.
🔽 Watch for confirmation below $3,260 for bearish continuation.
✅ For bulls, wait for a strong breakout above resistance with volume.

How is the market situation during the China-US talks?Information summary:
On Tuesday, as the China-US trade negotiations entered the second day, the US dollar index fluctuated around the 99 mark.
The gold price once approached the 3,300 US dollar mark in the Asian market, and then continued to rise, reaching the highest of the 3,350 US dollar mark. After the opening of the US stock market, all the gains during the day were given up, and it has been maintained below 3,350 for consolidation.
From the current known negotiation information, the two sides basically agree on the general direction and principles, but it means that more specific content and details have not yet been fully negotiated, and more dialogue is needed to resolve.
Market analysis:
From the current gold market, as long as the 3,350 mark cannot be strongly broken through next, the price will fall again. The consolidation range will remain at 3,300-3,350. As long as the price fails to break through strongly, there will still be a fifth wave of downward trend.
Therefore, gold is still maintaining short selling operations at high points.
Operation strategy:
Short at 3345-3450, stop loss at 3360, the first target is this week's low of 3300, the second target is 3285, and the third target is 3250.

Analysis of gold prices on June 11
📌Gold news
🎈Economic data and policy expectations
U.S. employment data; initial jobless claims increased for two consecutive weeks, and the market focus shifted to the non-farm payroll report released this week. The data performance will affect the Fed's policy path.
Trump pressures interest rate cuts: Trump recently called on the Fed to cut interest rates by "one percentage point" again, and hinted that he would consider replacing the Fed chairman, exacerbating market expectations for loose monetary policy.
🎈Long-term support factors
Despite short-term fluctuations, global economic and geopolitical uncertainties (such as repeated trade frictions and debt risks) still provide long-term safe-haven demand for gold, especially in the context of the divergence of monetary policies between European and American central banks, the allocation value of gold is highlighted.
📊Technical analysis
Before the European session, the gold price showed a continuous positive trend. I gave a hint in my analysis that I was not in a hurry to guess the top, and followed the trend to rise to around 3340 and wait for the turning point to appear. The opening trend of the European session tended to fluctuate until it rose to around 3348 in the evening and then turned from rising to falling, but the decline was not strong. It rose again at the position of the European session. Now the gold price is trading around 3350. From the market point of view, this wave of rise was supported by the trend line at 3300. Whether it was geopolitical conflicts or various news about Sino-US trade negotiations that stimulated buying to drive gold prices up, the second rise in the US session has exceeded 3340.
The next key suppression level is around 3360, which is 618 from 3403 to 3300, which can be treated as a turning point. The initial support below focuses on the high point of yesterday's Asian session at 3338.
💰Strategy Package
Waiting for gold: short at 3355-3360, stop loss at 3365, target at 3340-3328!
⭐️ Note: Labaron hopes that traders can properly manage their funds
- Choose the number of lots that matches your funds

XAUUSD: Analysis June 11Positive signals in US-China trade negotiations put pressure on gold. However, escalating geopolitical tensions between Iran and Israel and Russia and Ukraine have limited the decline of gold. Today, the market focuses on CPI data released today. If the data is released above expectations, it may force the FED to keep interest rates high for a longer period of time, thereby causing gold prices to decrease. On the contrary, if the data is released below expectations, gold will be supported to increase.
From a technical perspective.
The gold sell signal 3340 - 3342 in the US session last night had a very good profit. Gold declined below 3320 but then increased again and moved steadily above this support zone, indicating that the gold's upward momentum may continue.

Gold rebounds and repairs, is it a shock or a bull market?📰 Impact of news:
1. Geopolitical situation
2. Impact of the US dollar trend on gold
📈 Market analysis:
At the gold hourly level, after the pressure in the Asian session in the morning, it directly fell to the vicinity of 3302. The big Yin effectively lost the lower track of the descending flag consolidation channel. The original 3318 line was the confirmation of the channel counter-pressure point, which happened to be the 61.8% split resistance level at that time. At the same time, it lost the middle track. Therefore, we gave a trading idea of looking at the rebound under pressure and continuing to decline in the European session. As a result, the market directly took a V-shaped wash-up and once pulled up to the vicinity of 3342.
The European session fluctuated strongly and rose. Before and after the US session, it took advantage of the retracement to lure the short position, and there is still the possibility of a second pull-up space. Therefore, in the subsequent retracement support level, pay attention to two positions, one is 3322-3324, and the other is the 61.8% division support level of 3318. If it stabilizes, there is a high probability that there will be a second upward space, pointing to 3348. If the pressure here cannot be overcome, the bottom will continue to oscillate back and forth. At that time, it will fall back to see if a secondary low point can be formed to further stabilize the support. If it goes straight through and stands on it, 3293 may already be the short-term low.
On the whole, I still hold short orders before the effective breakthrough of 3345, but at the same time, as the gold price rebounds and moves upward, the short-term support level is temporarily expected to be 3325-3320.
🏅 Trading strategies:
SELL 3335-3345
TP 3325-3315
BUY 3325-3330
TP 3350-3360
If you agree with this view, or have a better idea, please leave a message in the comment area. I look forward to hearing different voices.
TVC:GOLD FXOPEN:XAUUSD FOREXCOM:XAUUSD FX:XAUUSD OANDA:XAUUSD
