XAUUSD — Rebound or Short-Term Downtrend Continuation?Gold just flushed hard into the support zone, reinforcing 3790 as a temporary top. What should we do now?
📉 Analysis
Price is reacting at resistance; wait for price action here.
Scenario 1: A clean break above opens a recovery toward the next resistance zone around .
Scenario 2: A retest/rejection at leads to another leg down toward , after which the broader uptrend can resume. A liquidity sweep/stop-run into is possible before price turns higher.
Key resistance: ,
Key support:
📊 Trading Plan
Wait for an Easy Trend reversal signal with high volume on 5m when price taps the marked support/resistance zones.
Price is rolling under the trendline; wait for an Easy Trend signal on 5m with high volume to confirm entry.
Example (ENTRY): On 5m timeframe, price broke below the trendline and printed an Easy Trend sell signal with heavy volume, followed by a sharp drop.
Risk management: Stop above the most recent M5 swing high ; move to break-even at 1R (R:R = 1:1).
Goldsell

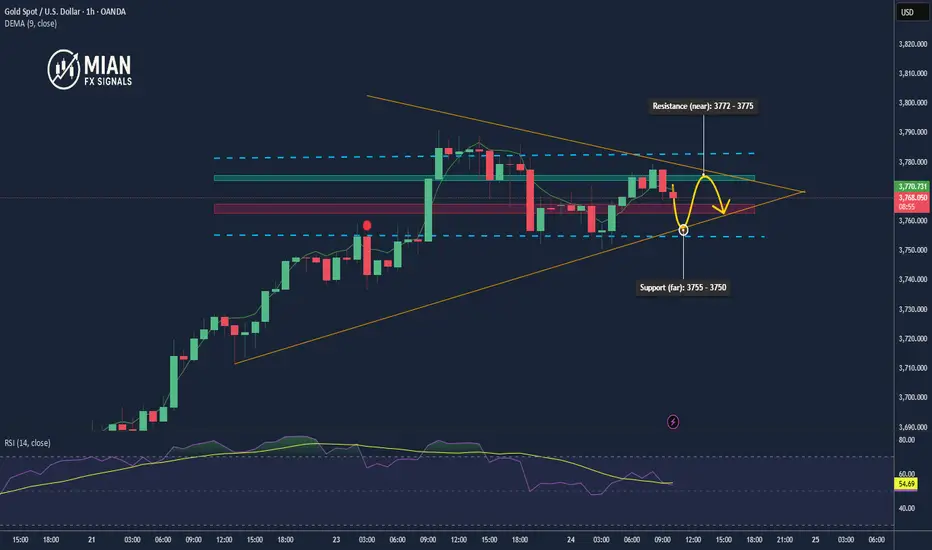
Gold breaks below 3770 – short-term correction signal📌 Market Developments:
Gold failed to hold the 3771–3774 area and dropped below 3770, now trading around 3768. This shows selling pressure has returned as buyers were not strong enough to break the 3778–3780 resistance zone.
📉 Technical Analysis:
🔺 Resistance (near): 3772 – 3775
🔺 Resistance (far): 3778 – 3781
🔻 Support (near): 3765 – 3762
🔻 Support (far): 3755 – 3750
📊 Short-term EMA is flattening as price moves back below 3770.
🕯️ H1 candles show strong selling pressure with long upper wicks and rising volume.
🧐 Outlook:
The main trend remains bullish, but gold is in a short-term correction after failing at 3778–3781. If 3765 breaks, price may continue to decline toward 3755 – 3750 before buyers step in again.
🎯 Trading Strategy:
🔺 BUY XAU/USD : 3755 – 3750
🎯 TP: 40 / 80 / 200 pips
🛑 SL: 3747
🔻 SELL XAU/USD: 3772 – 3775
🎯 TP: 40 / 80 / 200 pips
🛑 SL: 3778
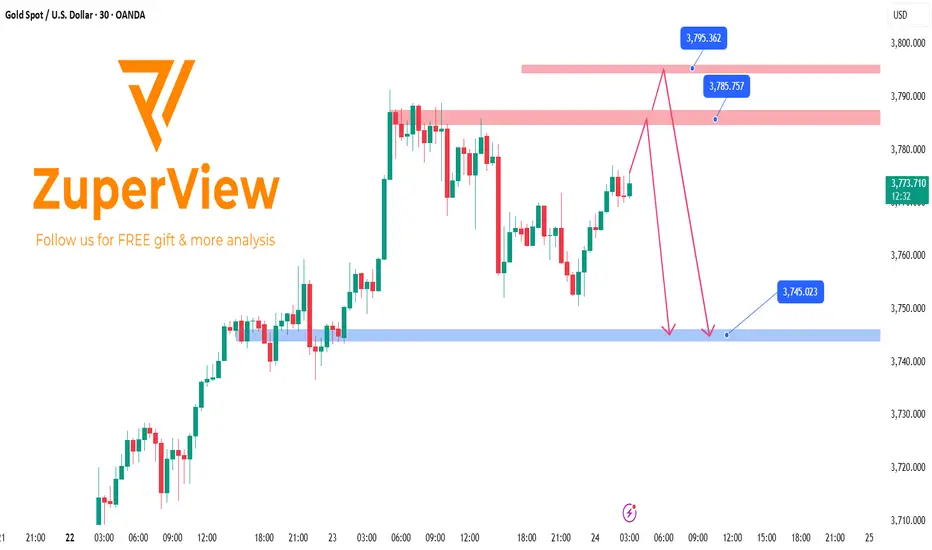
XAUUSD: Could 3790 Be the Top?After the 3740 → 3790 rally, upside momentum has weakened . Therefore, 3790 is likely a temporary top , and a short-term pullback may begin from here. However, we cannot rule out a retest of the top area or even a marginal higher high today before a sharper correction develops.
📉 Analysis
• After the push to 3,790 , price rotated within 3,778–3,788 and then broke the lower bound (3,778) on high volume . This supports the view that a swing high formed at 3,790 . However, price is currently drifting higher on lighter volume , so a retest of the top or even a marginal higher high before the pullback remains possible.
• Resistance zones: 3,784.5–3,787, 3,794–3,796 .
• Key support zones: 3,746–3,744, 3,723–3,718.
📊 Trading Plan
• Wait for reversal signals with heavy volume at the marked support/resistance zones.
• Highest-probability trigger: an 5m engulfing candle with high volume when price taps these levels.
Example: As in ENTRY 1 , if an 5m engulfing candle prints with high volume (as indicated by Superior Volume ) at a marked support/resistance zone, entry on the candle close .
• Entry on the signal and place the stop just above the signal candle (or above the resistance zone ). Move to break-even at +1R .
Gold Potential Reversal Ahead - Gold Sell OpportunityGold is currently trading around 3647 after making a strong bullish move. Price has reached near a weak high zone and is showing signs of exhaustion, which indicates a possible retracement. The immediate resistance at 3659 has created a weak high. If Gold fails to sustain above this level, sellers are likely to step in, pushing price down toward the levels at 3620 – 3604. A confirmed rejection candle around the sell zone will act as the sell trigger, with 3578 as a deeper bearish target if momentum increases.
🔑 Key Levels to Watch:
- Resistance: 3687 – 3712
- Support: 3,628 - 3600
📌 Sell Zone & Sell Trigger:
- Sell Zone: 3670 – 3685 area
- Sell Trigger: A rejection candle or confirmation of failure to break above 3670 – 3685 zone.
Note
Please risk management in trading is a Key so use your money accordingly. If you like the idea then please like and boost. Thank you and Good Luck!

CPI in Focus – Gold’s Sell Setup ActivatedGold is showing signs of weakness after failing to sustain above 3674. Any pullback toward 3635 – 3650 can provide a good sell opportunity, with confirmation below 3617 accelerating downside. Bears will eye 3599 – 3581 as the next key levels, while major support lies at 3540.
Today’s US CPI data will be the key driver — if inflation comes in hotter than expected, it could strengthen the dollar and pressure gold lower. On the other hand, a softer CPI print may support gold with a bounce toward 3635–3650 before fresh selling pressure resumes.
🔑 Key Levels to Watch
- Resistance: 3640 – 3650
- Support: 3618 - 3600
📌 Sell Zone & Sell Trigger:
- Sell Zone: 3640 – 3650 area
- Sell Trigger: If price retests 3635 – 3650 and rejects with bearish candles → short entries valid or Confirmation break below 3617 will add more bearish pressure.
Note
Please risk management in trading is a Key so use your money accordingly. If you like the idea then please like and boost. Thank you and Good Luck!

Gold Rejected at $3,700 – Correction Ahead?Gold (XAUUSD) is currently trading around $3,662 and moving within an upward channel structure, but showing signs of weakness near the resistance zone. Price recently tested the $3,698–$3,700 resistance area and failed to break higher, creating a potential short-term top (marked as a weak high). This rejection signals that sellers are gaining strength. If price fails to sustain above $3,675–$3,698, it increases the probability of a deeper correction toward the lower channel and demand
Overall, Gold remains vulnerable to correction unless bulls reclaim and sustain above $3,700, which would invalidate the bearish setup and reopen the path toward $3,725–$3,750.
🔑 Key Levels to Watch
- Resistance: 3670 – 3690
- Support: 3625 – 3600
📌 Sell Zone & Sell Trigger:
- Sell Zone: 3675 – 3680 area
- Sell Trigger: If Gold retests and rejects the $3,690–$3,700 resistance zone, it becomes a valid sell entry with confirmation of bearish rejection.
Note
Please risk management in trading is a Key so use your money accordingly. If you like the idea then please like and boost. Thank you and Good Luck!

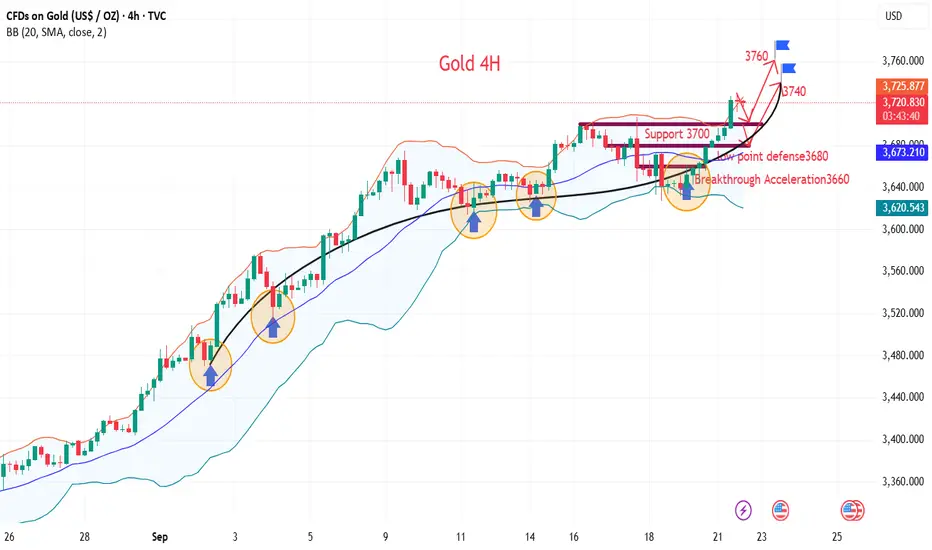
How to accurately arrange long and short positions?Gold is currently standing firmly above the 3750 line, with a maximum impact of 3791, just one step away from the 3800 mark. The overall bullish momentum has not weakened. If gold can continue to stabilize above 3750, it means that the 3800 mark will most likely be tested. The short-term market is still in a strong bullish pattern. We are currently focusing on the 3760-3750 support zone. If this area can effectively stabilize, it will be an ideal entry point for short-term bulls and has a strong reference value. From the 4-hour cycle, the effective support below is maintained in the area around 3760-3750, while the upper pressure is at the 3800 mark, which is the key balance point between a strong breakthrough and a technical pullback. In terms of operating strategy, it is still recommended to maintain the idea of "low-long as the main and high-short as the auxiliary". Specifically, if the price falls back to 3750-3760 without breaking through, you can go long with a light position, and target around 3800 first; if the price touches the 3800 area, you can try to go short with a light position, but you must enter and exit quickly and strictly control the stop loss; in the middle position, you should wait and see, watch more and do less, to avoid repeated consumption of funds by range fluctuations. Overall, the current bullish trend of gold still dominates the market, but as the price gradually approaches the integer mark, market volatility may intensify. Short-term operations must be steady and cautious, control the rhythm, wait for key points to enter the market, and respond flexibly. This is the core idea at the current stage.
Gold Short Trade Opportunity at $3775Looking for a potential short trade in gold? The current price of $3775 presents a promising opportunity for sellers in the gold market.
Reasons to Consider a Short Trade:
Recent market analysis indicates a bearish trend in gold, with key resistance at the $3775 level.
Key indicators suggest that gold may face downward momentum, making this an optimal entry point for a short position.
Economic data and geopolitical tensions may influence gold prices, providing further support for a potential decline.
Strategic Approach:
Consider entering a short position at $3775.
Set a stop-loss above a recent high to manage risk effectively.
Identify key support levels below $3775 to maximize your profit potential.
Always ensure to conduct thorough research and utilize risk management strategies before executing trades. Happy trading!

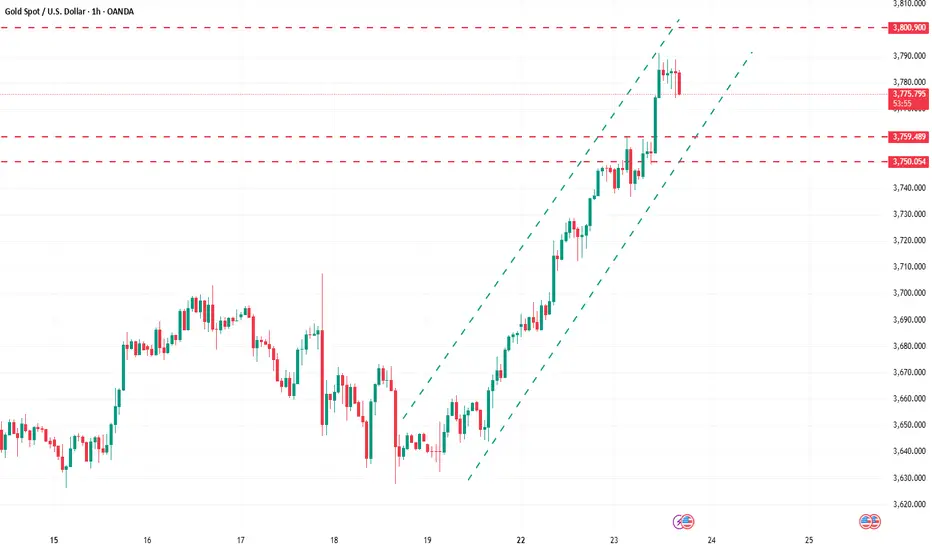
New High at 3791, Then Pullback📌 Market Movements:
Recently, gold prices set a new all-time high at $3791/oz before retreating slightly and are now trading around $3778/oz. The initial surge was driven by strong dip-buying and risk-aversion sentiment, but profit-taking pressure pulled prices back from record highs.
📉 Technical Analysis:
🔺 Resistance: 3791 (new ATH) and 3805
🔻 Support: 3770, followed by 3755
📈 EMA 50 on H1 remains below price, confirming short-term bullish bias
🕯️ H1 candles show long upper wicks near 3790–3791, signaling strong selling pressure at resistance
📊 Declining volume during the pullback suggests the market is waiting for the next breakout confirmation
🧐 Outlook:
The main trend remains bullish, but after touching 3791, gold needs consolidation to absorb selling pressure. Holding above 3770 keeps the door open for another test of 3791, aiming toward 3800–3805. A break below 3770 could push gold toward 3755 before any rebound.
🎯 Trading Strategy (Suggested):
🔺 BUY XAU/USD
• 📌 Entry: 3770–3773
• 🎯 TP: 3785 / 3795 / 3805
• 🛑 SL: 3765

Gold retracement is the best opportunity
News:
Spot gold prices performed strongly during Tuesday's Asian and European trading hours. Early in the session, it fluctuated upward within a $20 range and has now risen rapidly, up 0.59%, to $3,769/oz. Gold prices rose nearly 2% on Monday, reaching a new all-time high. This was primarily driven by growing expectations of further US interest rate cuts and continued safe-haven demand amid political uncertainty.
Beyond these key factors, a number of other key drivers are driving gold prices. This article briefly outlines the relevant factors influencing gold prices. In the short term, investors will focus on the upcoming Federal Reserve speech and Friday's release of key US inflation data, the core PCE price index, to identify new policy signals.
Specifically:
On Tuesday, the gold market maintained its bullish trend, with bulls continuing their slow, volatile bullish rise. The trend was seamless, with few corrections. It was essentially similar to Monday's and a continuation of last week's trend, which was a slow, continuous bullish rise.
Below, let's briefly summarize:
First, maintain a calm mindset. This trend is making history, and everyone is like us, groping their way across the river. No one knows where the top is! Don't go against the tide and chase the top; it will only backfire. Until the trend changes, following the trend is the way to go!
Second, the trading strategy is simple: simply follow the pullback or follow the sideways trend. There are already three pullbacks today at 3740, 2745, and 3755. Following the sideways trend can yield huge profits! But if you don't know how to follow the sideways trend or don't dare to trade it, don't lose heart! Join us and reap the rewards.
Second: 3800 may not be the high point in terms of trend. Although it has risen over 280 points since breaking through 3500, the market's trend suggests 3800 isn't a barrier to entry; it might just be a figment of the imagination! Therefore, we recommend continuing to follow the trend. At the very least, following the trend won't lead to significant errors.
Furthermore, the more gold moves in this direction, the more volatile the global situation becomes. The more capital favors the gold market, the more it signals a crisis of US dollar credibility.
As analyzed this morning, the current surge in gold prices is actually a combination of the Federal Reserve's interest rate cut cycle, the US dollar's credibility crisis, the aftermath of the trade war, the risk of war spillover, and continued gold purchases by global central banks.
So far, these bullish fundamentals have shown no clear signs of a reversal.
In short: don't worry, don't fight too hard, and don't go against the tide. With this kind of trend, you should do as much as you can, especially when you are alone and there is no leader to lead you. Keep a positive attitude and face it with a smile. You are also welcome to join us and make profits together.
Strategy:
Long Position3760-3770,SL:3745,Target:3800-3820

Gold will reach gann number 3729 cant break that number for nowGold will reach Gann number 3729 cant break that number for now. so Sellers can enter around 3729. After fall from 3729 buy the dip and Target for buy will 3988.

Gold (Sep 22–26): Can Bulls Defend $3,700 as ETF Inflows Slow?1. Institutional Forecast Updates
Goldman Sachs (Sep 4, 2025): Targets $3,700/oz for Q4 2025 and $4,000/oz for Q2 2026.
J.P. Morgan (Apr 22, 2025): Projects $3,650/oz for Q4 2025 and sees prices above $4,000/oz by Q2 2026.
References:
www.reuters.com
www.reuters.com
2. Key Drivers & Risks
🟪 Gold ETF flows: Gold-backed ETF inflows surged in 2025, but high prices have caused those inflows to slow.
🟧 Central Bank Statistics: Central bank demand increased in 2025, but they largely held their reserves with little buying or selling.
🟨 Markets are anticipating further Fed rate cuts, which would lower real interest rates and reduce the opportunity cost of holding gold.
🟩 Political and geopolitical tensions have eased recently, with no new developments providing additional support for gold prices.
🟦 The economic environment appears stable (the S&P 500 VIX is currently low), which could shift capital toward higher-risk markets.
⇨ There are no clear signs of a sustained decline in gold prices, but caution is advised around the $3,700/oz level, as institutional inflows are weakening and downside risks are present.
Source: World Gold Council
3. 🏦📊 Technical Analysis
* Trend: assessed using at least three trend indicators, with market structure as the primary guide.
** Weak or Reversal Signals: Assessed based on one of our criteria for trend reversal signals.
*** Support/Resistance: Selected from multiple factors – static (Swing High, Swing Low, etc.), dynamic (EMA, MA, etc.), psychological (Fibonacci, RSI, etc.) – and determined based on the trader’s discretion.
**** Our advice takes into account all factors, including both fundamental and technical analysis. It is not intended as a profit target. We hope it can serve as a reference to help you trade more effectively. This advice is for informational purposes only and we assume no responsibility for any trading results based on it.
How do you think about this idea? Let us know your thoughts below :)

XAU/USD – Technical Analysis H1 (September 23, 2025)Gold is currently trading around 3,745 USD/oz after a strong upward move from the support zone of 3,640 – 3,650 USD/oz. Below are the key levels and trading strategies:
1. Trend and Price Action
Price has broken out of the bearish channel drawn from September 17–19, confirming a strong upward move.
After the breakout, gold has formed a minor pullback but maintains the bullish trend, indicating continued buying pressure.
The H1 chart shows a classic flag breakout pattern, with a sharp upward momentum following the channel breakout.
2. Key Support and Resistance Levels
Support: 3,730 USD and 3,710 USD – these levels coincide with previous lows and the breakout zone.
Near-term Resistance: 3,760 – 3,770 USD, where short-term profit-taking may appear.
Long-term Resistance: 3,790 – 3,800 USD, the previous monthly high; monitor price reactions at this level.
3. Technical Indicators Reference
EMA 20/50 H1: EMA 20 is above EMA 50, confirming the short-term bullish trend.
RSI H1: Around 70 – indicating overbought conditions, but no divergence is visible; the bullish momentum is still strong.
Fibonacci: Applied from the swing low at 3,640 USD to the high at 3,760 USD; 38.2% (≈3,700) and 50% (≈3,700 – 3,710) levels act as strong support during pullbacks.
4. Suggested Trading Strategies
Buy on pullback: Watch for retracements to 3,730 – 3,740 USD. Place stop-loss below 3,720 USD.
Take profit: 3,760 – 3,770 USD for short-term targets; if price breaks 3,770 USD, extend target to 3,790 – 3,800 USD.
Trend continuation: If price dips to 3,710 – 3,720 USD but holds, consider holding long positions following the main trend.
Conclusion:
Gold is in a strong bullish phase, with buying pressure dominating. The safest approach is to buy on retracements while managing risk via stop-losses. Keep monitoring H1 charts for new bullish swings and adjust Fibonacci levels if the price breaks key resistance.

Xauusd sellAfter a raid of the previous week high we can see a true divergence where buyers are exhausted by the virtue of how I trade we are selling Xauusd

Gold price hits new high! In line with expectations!
News:
On Monday (September 22nd), spot gold prices briefly consolidated in early Asian trading before surging $20 at noon, reaching a high of $3,719.72, a new all-time high. Gold prices continued their upward momentum from last Friday's 1.12% gain and are currently trading around $3,720.
Global financial markets are poised for a wave of policy speeches following the end of the Federal Reserve's quiet period. FOMC voting members' frequent statements are a key market focus, and gold prices are expected to strengthen their upward momentum as Fed members explain their reasons for the rate cut vote.
Monday: Speech by St. Louis Fed President Mousallem (a hawkish figure) and New York Fed President Williams (the third-ranking official on the FOMC).
Tuesday: Speech by Cleveland Fed President Hammack, Richmond Fed President Barkin, and Atlanta Fed President Bostic.
Thursday: Follow-up speeches by Federal Reserve officials in the evening, including speeches by San Francisco Fed President Mary Daly, Chicago Fed President Goolsbee, and New York Fed President Williams.
Friday: San Francisco Fed President Mary Daly and Federal Reserve Board Governor Bowman will deliver speeches in succession, and may comment on the PCE data released that day.
Technical aspects:
Gold prices have reached a new all-time high, with a top-bottom reversal at 3700.
Hello, gold has reached a new all-time high near 3720, breaking through the 3700 mark for the third time. Note the top-bottom reversal line at 3700.
You'll notice that gold's current upward trajectory starts with a rise, and its focus remains on this uptrend. The process is full of twists and turns, prompting both doubts about market ups and downs, and a reassurance about market ups and downs.
Today, Monday, the market opened with a continued strong rise, breaking through the new high and accelerating towards 3720.
Continuing this strong upward trend will depend on holding below the resistance level. The early morning low of 3684 and the support level of 3685, identified during the Asian session's pullback, serve as defensive zones. Hold these levels and move upwards. Focus on the 3725-3727 range, followed by the 3740 range.
Specifically:
1. A breakout from a new high in the morning session. Holding the low is key, while breaking the high is crucial. Breaking the low and high suggests acceleration; breaking the low easily leads to a return to a range-bound trend.
2. Five consecutive weekly gains. After breaking through four months of sideways trading, the pattern opens upward, indicating bullish dominance.
3. The daily chart had previously been surging upward around the 10-day moving average, breaking higher. This time, the correction was quite sharp, falling directly below both the 10-day and 5-day moving averages. After repeated adjustments, it re-broke and stabilized above the moving averages last Friday, thus relying on these moving averages to break new highs.
Therefore, the correction can be considered complete, confirming support and continuing the upward push.
The moving average is now located in the 3675-3660 area. Keep this in mind. If it continues to break higher, the next resistance level will be 3775-3780.
4. The four-hour chart has begun to open slightly again. Today's Asian session range is 3700-3632. In the afternoon, the price broke through 3700 and headed for the 3720 area.
Starting from confirming support on the lower band, the market has continued to rise, with rising lows and gradually moving higher highs.
There are two key points: first, holding the low, with rising lows, and second, high volume is key, so the upward sloping opening of the chart indicates the direction.
In summary, for gold today, the first step is a strong breakout, relying on the 3685-3680 area as support, to directly break through 3700 and reach a new high.
As of press time, the price has met expectations, breaking through a new high. Long positions in the 3630 area have successfully surged to 3720, making all profits.
Strategy:
Long Position3700,SL:3680,Target:3740-3760
Gold price does not break, bullish
News:
After the Fed's decision, spot gold prices briefly soared to $3,707.48 per ounce, a record high. However, following Fed Chairman Powell's speech, the dollar rebounded sharply, sending gold prices plummeting to $3,646.00 per ounce. By Wednesday's close, spot gold had fallen 0.8% to $3,659.96 per ounce.
With dovish expectations surrounding the Federal Reserve still intact, any dip in gold could be seen as a good opportunity to buy on the dip, thereby maintaining the uptrend.
The market now looks forward to the U.S. initial jobless claims data for fresh trading momentum. Furthermore, geopolitical headlines and comments from U.S. President Trump could also drive gold prices in the coming sessions.
Technical aspects:
The daily chart shows that gold buyers appear to have another opportunity for a sustained rally, as the 14-day Relative Strength Index (RSI) has finally retreated sharply from extreme overbought territory. The RSI has fallen from 80 to 70.
If bargain hunting emerges and gathers momentum, gold could retest the record high of $3,708 per ounce. A daily close above that level would open the door to the $3,750 per ounce region.
From a 4-hour analysis, effective support remains near 3620, which is currently a key defensive support level. If this level continues to fall, the bullish and bearish biases may shift in the future.
Key resistance from above remains at 3700. Strategically, consider long and short positions within this range. In the middle, be cautious and watchful, follow orders carefully, and patiently wait for key entry points. Specific operational strategies will be monitored closely.
Strategy:
Gold falls back to 3620, 3630 and buys, stop loss at 3610, target 3690-3700, break to 3720
Is there an opportunity before the interest rate decision?Gold has been soaring since the start of this week, reaching new highs, even testing above 3700 points during the session. However, due to the pressure from the round number barrier and the approaching interest rate decision, gold retreated after rising. This provided several opportunities for shorting. The first was to open a short position near 3697 until the take-profit target. The second was near 3695, today's high. With the interest rate decision imminent, all existing positions have been closed at the take-profit target. If it weren't for the interest rate decision, I would have preferred a downward trend in gold.
Since the interest rate decision has a significant impact on gold prices, it's safer to wait until the results are announced before considering any trades. Reducing risk is also the best way to preserve your principal. OANDA:XAUUSD FX:XAUUSD COINBASE:ETHUSD BINANCE:BTCUSDT

FRIDAY GOLD SHORT SETUP Gold Selling At Strong Resistance
Resistance Short Trade Zone
Entry 3662 / 3666
Stoploss 3618
Target 3615
Follow Us For More

Gold struggles within 3630–3675 range, awaiting breakout📊 Market developments
• Yesterday, gold rebounded from 3633 to test the resistance zone at 3675 but failed, then dropped sharply to a low of 3627.
• This morning, gold recovered from that low and is now trading around 3658–3660, showing that short-term buying pressure has re-emerged.
• A stronger USD and slightly higher U.S. bond yields after the Fed meeting continue to weigh on gold, while expectations of further Fed rate cuts in the coming months prevent deeper declines.
🧭 Technical analysis
• Near resistance: 3670–3675 (key short-term barrier, repeatedly rejected).
• Major resistance: 3700 (psychological level; only a breakout would confirm a new bullish leg).
• Near support: 3630 (yesterday’s low).
• Major support: 3600–3610.
• RSI on H1/H4 has rebounded from oversold levels, signaling potential for further recovery, though momentum remains weak.
📌 Outlook
• In the short term, gold is expected to consolidate within the 3630–3675 range.
• A breakout above 3675 could open the way toward 3700.
• Failure to break 3675 would likely send prices back to retest 3630, or even lower toward 3600.
🎯 Trading strategy
• Short-term SELL: around 3670–3675, SL above 3678, TP at 3640–3630.
• Speculative BUY: around 3630–3635, SL below 3627, TP at 3665–3675.
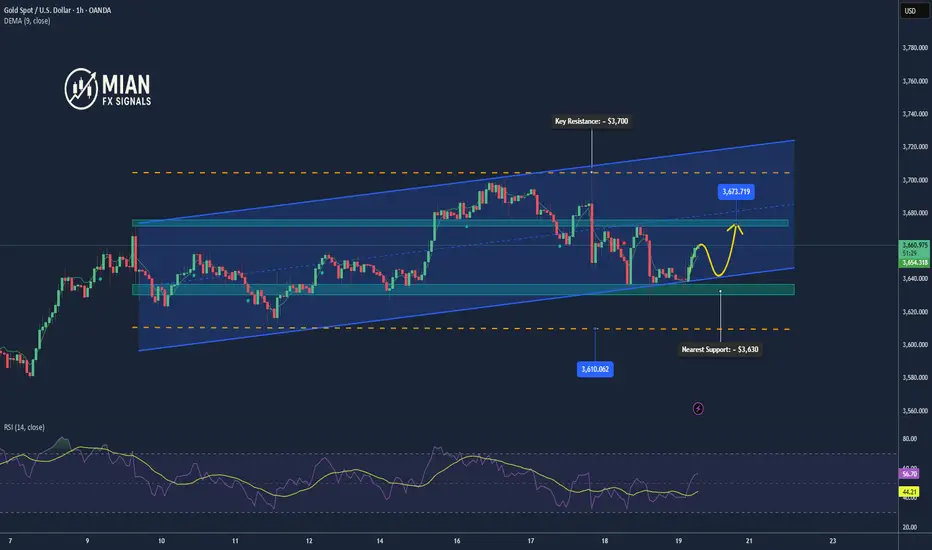
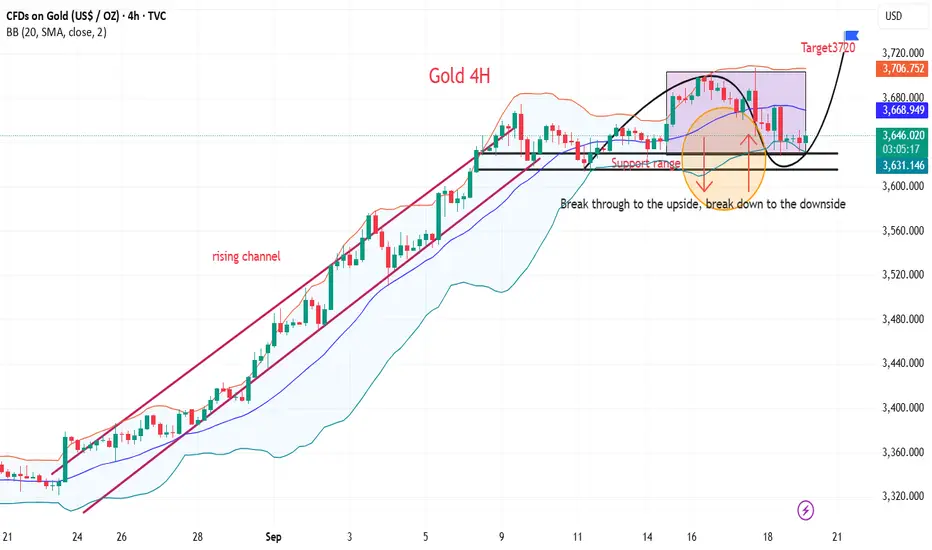
XAUUSD Intraday Analysis – September 19, 2025Gold price on the H1 chart has recently broken out of a descending channel after a short-term correction from the 3,700 zone. The market is now testing a key support level around 3,645 – 3,650, which will play a decisive role in today’s intraday trend.
Technical Outlook
Trend
After rallying strongly above 3,700, gold entered a correction phase inside a falling channel.
The breakout from this channel signals potential bullish momentum if support holds.
Key Levels
Immediate support: 3,645 – 3,650 (retest zone after breakout).
Major support: 3,625.
Resistance zone 1: 3,675 – 3,680.
Resistance zone 2: 3,700 – 3,705 (a break above this area could extend toward 3,720+).
Indicators
EMA: Price is consolidating near short-term EMAs. If support holds, EMAs may flip bullish.
RSI: Recovered from oversold territory and moving upward, supporting a potential bounce.
Fibonacci: 3,645 aligns with the 0.618 Fib retracement, strengthening its role as support.
Trading Strategy
Primary scenario (Long bias):
Watch for price action around 3,645 – 3,650.
If the support holds, consider long entries targeting 3,675 – 3,705.
Stop loss below 3,621.
Risk-to-reward ~ 1:2, suitable for intraday trades.
Alternative scenario (Short if support breaks):
If price breaks below 3,621 with strong volume, bearish pressure may resume.
Downside targets would be 3,600 – 3,588.
Conclusion
Gold is at a critical point today. Holding above 3,645 – 3,650 will favor a bullish continuation toward 3,700+. A breakdown below 3,621, however, would shift the bias back to the downside.
Stay alert and monitor the reaction at these key levels. Save this analysis if you find it useful, and follow along for more daily trading strategies.

XAUUSD Short The MarketGood Projection towards downside, a sell signal from the market dint stop after the rate cuts as the unemployment claims still remain positive.

ANFIBO | XAUUSD - What's the next plan today?Hello guys! It's me, Anfibo.
My previous OANDA:XAUUSD plan with the Sell entry at 3,670 – 3,674 delivered more than 400 pips in profit, confirming that the market reacted exactly as anticipated.
At present, observing the price structure, gold has completed a 5-wave Elliott impulse and is now transitioning into an ABC corrective phase. This is a classic scenario following a strong impulsive leg, where the market needs to rebalance before determining the next trend.
At the same time, the current price zone is also showing signs of forming a Head and Shoulders pattern, adding another layer of reliable technical confluence. This suggests that downside pressure remains in play, at least until the pattern is fully developed.
Key short-term resistance levels to watch are around 3,690 – 3,700 (maybe we will get a sell signal here)
Meanwhile, immediate support levels can be found near 3,630 – 3,620 – 3,615, with a deeper support at 3,590, which will be decisive for the longer-term bullish structure.
The preferred strategy is to wait for price reactions at these resistance confluence zones to look for short-term Sell signals, in line with the ongoing ABC correction.
Here's My Trading Plan
>>> BUY SCALP
Entry: 3,620 – 3,615
SL: 3,610
TP: 3,650 – 3,670
>>> SELL Scalp
Entry: 3,670 – 3,675
SL: 3,680
TP: 3,620 – 3,590
Always set your Stop-Loss on every trade! Wishing everyone successful trading. XOXO

ANFIBO | XAUUSD - What's next?Hello guys! It's me, Anfibo.
My previous OANDA:XAUUSD plan with the Sell entry at 3,670 – 3,674 delivered more than 400 pips in profit, confirming that the market reacted exactly as anticipated.
At present, observing the price structure, gold has completed a 5-wave Elliott impulse and is now transitioning into an ABC corrective phase. This is a classic scenario following a strong impulsive leg, where the market needs to rebalance before determining the next trend.
At the same time, the current price zone is also showing signs of forming a Head and Shoulders pattern, adding another layer of reliable technical confluence. This suggests that downside pressure remains in play, at least until the pattern is fully developed.
Key short-term resistance levels to watch are around 3,690 – 3,700.
Meanwhile, immediate support levels can be found near 3,630 – 3,620 – 3,615, with a deeper support at 3,590, which will be decisive for the longer-term bullish structure.
The preferred strategy is to wait for price reactions at these resistance confluence zones to look for short-term Sell signals, in line with the ongoing ABC correction.
Here's My Trading Plan
>>> BUY SCALP
Entry: 3,620 – 3,615
SL: 3,610
TP: 3,650 – 3,670
>>> SELL Scalp
Entry: 3,670 – 3,675
SL: 3,680
TP: 3,620 – 3,590
Always set your Stop-Loss on every trade! Wishing everyone successful trading. XOXO
