Gold sideways does not mean stagnation
💡Message Strategy
On Monday (August 25), spot gold (XAU/USD) continued its momentum from Friday before the US market opened, consolidating around the high of $3,370.00.
Previously, Federal Reserve Chairman Jerome Powell expressed an openness to "easing policy restrictiveness" at the Jackson Hole annual symposium and indicated a "swift" interest rate cut if downside risks to the labor market emerge. Falling yields and a volatile and weak US dollar provided marginal support for gold.
Potential macroeconomic constraints should not be ignored: If subsequent high-frequency data indicate continued resilience in demand and rising inflation stickiness, the market's forward pricing in the pace of rate cuts may retreat, and a further steepening of the interest rate curve could re-suppress gold prices.
Furthermore, a temporary technical rebound in the US dollar amid global capital "rebalancing" would also constrain dollar-denominated commodities. Therefore, the fundamental drivers for gold are currently bullish, but still require verification.
📊Technical aspects
First, regarding the weekly gold chart: Last week, it held the middle band and closed positive, breaking through the short-term 5-day and 10-day resistance levels. This week's pullback confirms that both support levels exist. Given the market is still trading sideways at its mid-term high, some penetration is inevitable, which is within normal fluctuations. This week, the middle band support moved up to 3320. At this level, we maintain a medium-term bullish outlook, awaiting an upward breakthrough after sideways trading.
Second, regarding the daily gold chart: For the past four months, the market has been oscillating and correcting within a converging triangle. The old converging triangle is no longer sufficient to support its fluctuation range, and has now expanded into a new converging triangle. The lower band support is at 3320, and the upper band resistance is at 3420. The market is generally operating within a 100-meter range, and the pattern will gradually shrink. We continue to await an upward breakthrough in the future.
Last Friday, the market closed with a large positive candlestick pattern, effectively breaking through the short-term 10-day moving average. Therefore, a pullback at the beginning of this week confirming this moving average at 3340 suggests a bullish trend based on dips.
💰Strategy Package
Long Position:3350-3360,SL:3340,Target: 3400
Goldsell

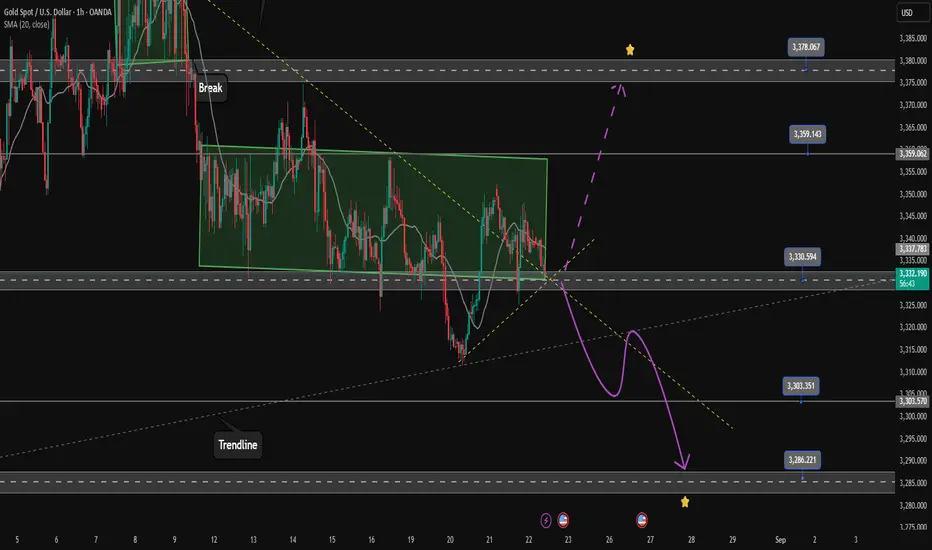
3330 Keys to Today's Strategy✏️The weekend gold trading strategy has not changed much. mainly based on the 2 border zones of the box from 3359 to 3330. The weak upward momentum in recent days makes gold easy to fall on the weekend. The 3330 zone is still a very special zone and wait for clear confirmation from the candle to trade to avoid False break. Be careful not to trade against the trend with the BUY signal when the 3330 zone is broken, the reaction of the buyers is very likely to come to the 3303 zone.
📉 Key Levels
SELL trigger Break and trading bellow 3330
Target 3285
BUY Trigger Confirmation of the candle closing above 3340
Target 3380
Resistance: 3340-3358-3378
Support: 3330-3304-3285
Leave your comments on the idea. I am happy to read your views.
Beware of gold plummeting amid volatility
💡Message Strategy
This week saw no major fundamental shifts, with gold continuing to range-bound ahead of Powell's speech and the release of the September non-farm payrolls report (NFP). The interest rate outlook remains uncertain, and a strong September NFP could quickly reverse market expectations.
Last week, US CPI data broadly met expectations, providing some support. However, subsequent data, including a significant surprise in PPI data, further improvement in initial jobless claims, and an unexpected rise in inflation expectations in the University of Michigan survey, put some pressure on the market. This is also consistent with the signal we gave, gold continues to fluctuate downward.
📊Technical aspects
On the 4-hour chart, a small support area is visible near 3,330. Prices recently dipped below this area but subsequently rebounded above it. Buyers are likely to continue entering this area, keeping risk below support, with a target of 3,430 resistance. Sellers would prefer to see prices break below support again, pushing gold further down to 3,250.
Gold is currently trading in a stair-stepping downward trend, indicating a weakening of its upward momentum. Combined with Powell's upcoming speech, the outlook for gold remains bearish.
💰Strategy Package
Short Position:3345-3350,SL:3380,Target: 3300,3280

A small rebound is not a trend reversal, continue to short#XAUUSD
Gold was stimulated by news yesterday and hit a high of 3352 at one point, but failed to effectively break through and stabilize above it. In the short term, it did not completely reverse the unilateral trend.📊
At present, gold continues to fall and rebounds after testing the effectiveness of the support level of 3330-3320 below. 📈In the short term, pay attention to the 3350 mark above.🌈 Once it breaks through and stabilizes above 3355, it is expected to test the resistance near the previous high of 3370.📉
On the other hand, if gold fails to maintain a firm footing above this level, it will likely remain volatile in the short term.↘️
This is why I didn't immediately follow up with a short position after closing my short position near 3335, 🤔opting instead to wait and see the market. 👀Gold has been fluctuating repeatedly recently. Please be cautious when trading and beware of falling into traps set by market makers.🎁
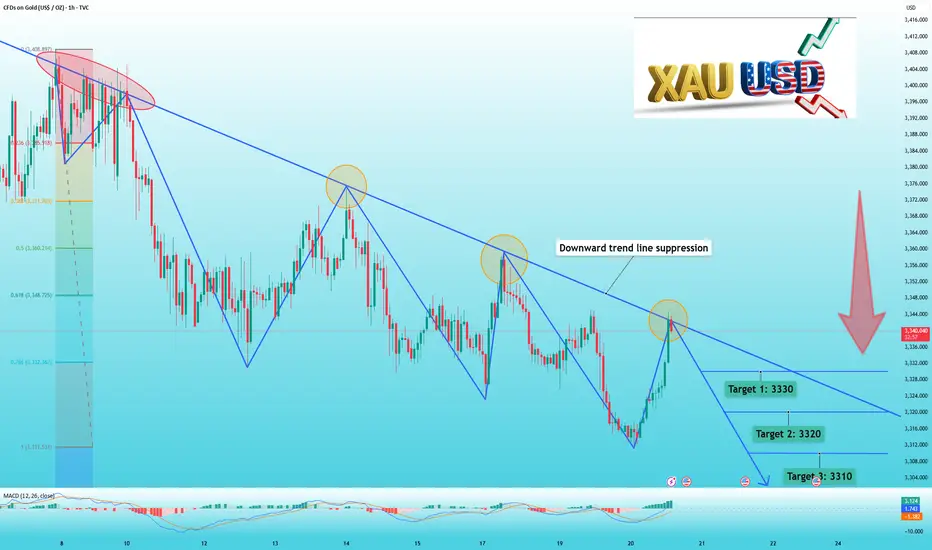
Gold hits resistance, Sell nowShort-term factors impacting the decline in gold prices:
1: The Russia-Ukraine situation has returned to the negotiating table under Trump's leadership.
2: At the Jackson Hole annual meeting, the market is almost unanimous in its belief that Powell will deliver hawkish remarks.
3: Both gold and silver ETFs have seen reductions in holdings.
4: Gold is under obvious technical pressure.
From the 1-hour chart, we can clearly see a downward trend line for gold prices. After repeatedly touching this trend line, gold prices have fallen. Now that it's near this trend line again, I believe it's a good time to sell.
🏆The operation settings are as follows:
📉📉📉Sell around 3345-3350
✅Target 1: 3330
✅Target 2: 3320
✅Target 3: 3310
📣If you have different opinions, please leave a message below to discuss
XAUUSD/SELLAfter the release of the Federal Reserve minutes yesterday, gold prices rose to 3352 but didn't rise further. The minutes mentioned several key points, namely inflation and unemployment. Overall, the unemployment rate is more important than the inflation rate. Meanwhile, the renewed talks between Russia and Ukraine seemed uneventful, and the meeting went smoothly. As a result, gold prices fell again after the Asian market opened.
The current price is 3337, down approximately $15/ounce from 3352, indicating that upward pressure remains. During this pullback, we need to watch whether the decline can be halted around 3330-3335. If not, we need to wait for a lower level, around 3310. Today is Thursday. Focus on the impact of the initial jobless claims data on gold prices.
For trading, you can still refer to the current selling strategy. While waiting for a decline, confirm the presence of support below. Currently, there is no major news to boost gold prices. Remember to manage your trading risk. Set take-profit and stop-loss orders to prevent extreme market fluctuations from adversely affecting your account.

Gold Near Breakout – Watch $3,369 and $3,330Gold remains in a downtrend, forming a Bear Flag pattern within a broader descending channel. Price is capped below key resistance at $3,360–3,369 and is hovering near $3,340. A breakdown below $3,330 could accelerate losses toward $3,300 and $3,280, while a short-term bullish break above $3,369 may trigger a retracement toward $3,380 before sellers likely re-enter. Overall bias stays bearish unless price closes firmly above the upper resistance zone.
🔑 Key Levels to Watch
- Resistance: $3,360 → $3,369 → $3,380
- Support: $3,330 → $3,300 → $3,280
- Breakout Zones: Below $3,330 → Targets $3,300 and $3,280. Above $3,369 → Target $3,380
Note
Please risk management in trading is a Key so use your money accordingly. If you like the idea then please like and boost. Thank you and Good Luck!

XAUUSD: Trade Gold in 15minHello friends, I opened such a trade on gold in 15 minutes and I expect such a trend for it. Be profitable and successful.

XAUUSD/BUYIt seems that bulls have seized a good opportunity. 3345 appears to have stabilized. Long positions can be more firmly established.
Buy at 3345, TP3360, SL3330

XAUUSD/BUYSure enough, gold prices rebounded after retreating to 3338, resulting in a short-term price increase of $8 per ounce.
The gold market is awaiting news to drive a rally. Just now, when it was about to hit 3350, it retreated. I interpret this as a tentative rise, as bulls are currently in control. This test is merely a test to see if bears will launch a counterattack. As expected, the bull-bear game is a tug-of-war. Both bulls and bears are now vying for the crucial 3345 level. This level serves as a short-term reversal point for the month. If bulls seize this level, the market will continue to rise. If bears seize this level, the market will experience short-term downward fluctuations.
In the latter half of the New York market, I believe the market will fluctuate within a range of approximately $10. The Swing Trading Center recommends continuing to buy.

XAUUSD/BUYAfter the New York market opened, the gold price hit 3350 before retreating. This indeed reached the profit target set by the swing trading center. The current price has retreated to 3342, but the decline has not continued. This is because the previous resistance level of 3345 has formed a certain support level after breaking through this level and then retreating. In short, the short-term focus should be on whether the 3340-3345 range stabilizes. If so, gold prices may rise again after the upcoming Federal Reserve news.

Gold Trade the range until it breaks Short Setup Here is a quick video on the current range and what I see going into Friday with the Fed speaking .
I have given some key levels and reaction zones for what could be a volatile reaction in the gold price .
Tools used Fibonacci, Time price opportunity charts , Anchored vwap and bars pattern .
Any questions then please leave in the comments section below the chart


XAU/USD/ Bearish Trend Read The captionSMC Trading point update
Technical analysis of analysis Gold (XAU/USD), 2H timeframe:
Trend Context: Price is moving inside a descending channel, showing continued bearish pressure.
Key Resistance Zone: The yellow highlighted area around $3,340 – $3,347 is acting as a supply zone / resistance, aligned with the 200 EMA, reinforcing bearish bias.
Rejection Signals: Multiple rejections (red arrows) confirm sellers are defending this zone.
Bearish Setup: Price is expected to reject from resistance and continue lower within the channel.
Target Point: The projection suggests a decline towards $3,302, aligning with previous swing levels and channel support.
RSI: Currently mid-level (~51), showing no strong momentum shift yet, but still leaves room for downside pressure.
Mr SMC Trading point
Summary Idea:
Gold is respecting the bearish channel and supply zone. As long as price stays below $3,347, the setup favors a bearish continuation targeting $3,302.
Please support boost 🚀 this analysis)

Selling pressure continues to return to 3300Plan XAU day: August 20, 2025
Related Information:!!!
Gold (XAU/USD) slid to its lowest level in nearly three weeks during the Asian session on Wednesday, with bearish sentiment prevailing as market participants await a decisive break below the 100-day Simple Moving Average (SMA) to confirm prospects for further downside. The US Dollar (USD) extended its steady ascent for a third consecutive session, supported by fading expectations of more aggressive monetary easing by the Federal Reserve (Fed), which remains a primary headwind for the non-yielding precious metal.
In addition, renewed optimism over a potential Russia–Ukraine peace agreement has added to the downward pressure on safe-haven gold. Looking ahead, investors will turn their attention to the release of the FOMC meeting minutes, while Fed Chair Jerome Powell’s upcoming remarks at the Jackson Hole Symposium may provide further clarity on the central bank’s policy trajectory. These developments are poised to play a pivotal role in shaping near-term USD demand and guiding the next directional move for the commodity
personal opinion:!!!
Gold price recovered to break through 3327 to gain liquidity and continue the downtrend
Important price zone to consider : !!!
Resistance zone point: 3330 zone
Sustainable trading to beat the market

XAUUSD: Fake Out Confirms Bearish Pressure, Eyeing 3323 & 3314Hello guys.
We recently saw a fake-out above the descending channel, which trapped early buyers and confirmed that sellers are still in control. Despite the QML formation in the highlighted zone, the bearish pressure remains dominant.
As long as the price trades below the fake-out high, the overall trend continues to point downward. My immediate downside targets are:
3323 (first key level)
3314 (secondary target, potential liquidity grab zone)
If sellers manage to hold momentum, we could see a continuation deeper into the channel.
⚠️ Keep in mind that a clean break above the fake-out level would invalidate this bearish outlook.

XAUUSD 15m – EW Short SetupHi fellow traders,
On the 15m XAUUSD chart, I am applying Elliott Wave principles to identify a short opportunity. The current structure suggests a continuation to the downside after the corrective move.
An additional confluence here is the red-shaded supply zone, which aligns with my projected entry area and strengthens the setup.
I am entering at 3347.26, with a Stop Loss at 3351.87 and a Take Profit at 3322.53, targeting the next support level.
Good luck and trade safe.

XAUUSD Update | Gold Builds Energy Ahead of FOMCGold continues to consolidate within a tight range, with selling pressure becoming more visible. With just over a day left until the FOMC meeting – a key event that could set the tone for the next major trend – the market seems to be loading up for a liquidity sweep.
👉 While price action may look messy and indecisive, for KeyLevel traders, this is the perfect hunting ground. Liquidity zones are being respected with precision, offering clean setups for those who understand MMFLOW structures.
📉 Market Outlook
Primary Bias: Short-term corrective downside.
Possible Play: Liquidity grab into the 331x area before a strong rebound higher.
🔑 Key Trading Levels
Sell Zone: 3340 – 3345 | Tight SL: 4 – 5 pts
🎯 Targets: 3325 → 3317 → stretch 3310
📌 Note: Stay disciplined around these KeyLevels. One sharp BreakOut post-FOMC could trigger the next big directional move.
✨ As always with MMFLOW: KeyLevels = Profits ✅
🔥 Follow MMFLOW TRADING to catch daily setups, smart money footprints, and precision KeyLevels.

Beware of gold selling wave, surprise attack!
💡Message Strategy
Shining signs of progress in Russia-Ukraine peace talks dampened gold demand, leaving bulls in a wait-and-see mood.
Traders pared back bets on a sharp Federal Reserve rate cut in September after Thursday's stronger-than-expected U.S. Producer Price Index (PPI) data. The PPI rose in July at its fastest monthly pace since 2022. Furthermore, preliminary data released by the University of Michigan on Friday showed one-year inflation expectations rising to 4.9% from 4.5%, and five-year inflation expectations rising to 3.9% from 3.4%.
These data suggest strengthening price pressures, supporting the view that the Federal Reserve is adopting a hawkish stance, which in turn is seen as a headwind for non-yielding gold.
On the geopolitical front, Russian President Vladimir Putin agreed to meet with his Ukrainian counterpart Volodymyr Zelensky for a peace summit, raising hopes for an end to the protracted Russia-Ukraine conflict and potentially limiting any significant gains in the safe-haven precious metal.
📊Technical aspects
Gold is currently under pressure on the daily trend, with the short-term moving average maintaining a narrow fluctuation at a low level. The current price is temporarily supported around 3330, but the rebound strength and continuation on the daily line are relatively weak, and a slight break may occur before a continued downward trend.
Technical indicators on the four-hour chart are slightly negative, suggesting that bulls should be cautious in positioning for any meaningful appreciation in the short term. Therefore, any subsequent rise is more likely to face strong resistance near the 200-period simple moving average on the four-hour chart, which is currently located in the $3,345-3,350 area.
💰Strategy Package
Short Position:3345-3350,SL:3380,Target: 3300,3280

Gold Selling Zone from 3340-3341 zone on short-term M15 timeGold Selling Zone from the 3340-3341 zone on the short-term M15 timeframe with the trend confirmations and also the resistance level at the 3341 zone. The idea got more power from the SMA 200.
GOLD SELL 3340-41
TP 3335
TP 3330
TP 3325
SL 3343

XAUUSD Rejection Signals Potential DownsideOANDA:XAUUSD is showing rejection from a clear resistance zone within the upper range of its volatility bands, with price action hinting at a potential move lower. This short setup is supported by visible bearish confluences.
✅ Bearish Confluences:
Fibonacci Resistance: Price turned lower after testing the 38.2% retracement level near $3,372.
Lower High Formation: Recent swing high is below the previous peak, maintaining a short-term bearish structure.
Volatility Band Rejection: Strong rejection from the mid-to-upper band area, signaling weakening bullish momentum.
🎯 Fibonacci-Based Targets:
TP1 – $3,332 (38.2%): First reaction area and initial support.
TP2 – $3,274 (61.8%): Key downside target within the retracement zone.
TP3 – $3,214 (100%): Full measured move to the lower band.
SL: Placed just above $3,390 to protect against a break of the bearish setup.

XAU/USD: Trend Change After Breakout, Bearish ContinuationHello guys!
After a strong bullish run, Gold has shifted momentum with a clear breakout to the downside, confirming a change in trend. The S&P supply zone acted as a strong resistance, rejecting the price back into a descending channel.
Currently, price is respecting the channel structure and has failed to break above minor resistance. The short-term outlook points to a bearish continuation, with a likely move toward the 3,321.89 support.
A clean break below this level could open the way for a deeper push into the 3,314.44 demand zone.
📉 Bearish bias remains intact while trading below the supply zone.
📈 Bullish invalidation would require a breakout above the channel and the S&P zone.

XAU recovers, mostly sideways below 3375⭐️GOLDEN INFORMATION:
Gold (XAU/USD) slipped toward $3,330 in early Asian trading on Monday, pressured by stronger-than-expected U.S. Producer Price Index (PPI) data. Investors now turn their attention to the meeting later today between U.S. President Donald Trump and Ukrainian President Volodymyr Zelenskiy for potential market-moving headlines.
Thursday’s hotter inflation print forced traders to scale back expectations for a September Federal Reserve rate cut, weighing on the yellow metal. The U.S. PPI rose 3.3% year-on-year in July, sharply above June’s 2.4% increase and well beyond the 2.5% forecast, reinforcing headwinds for bullion.
⭐️Personal comments NOVA:
Gold price recovers around 3353, downtrend line. Maintain accumulation below strong resistance zone 3375
⭐️SET UP GOLD PRICE:
🔥SELL GOLD zone: 3374- 3376 SL 3381
TP1: $3365
TP2: $3355
TP3: $3342
🔥BUY GOLD zone: $3312-$3310 SL $3305
TP1: $3322
TP2: $3333
TP3: $3348
⭐️Technical analysis:
Based on technical indicators EMA 34, EMA89 and support resistance areas to set up a reasonable SELL order.
⭐️NOTE:
Note: Nova wishes traders to manage their capital well
- take the number of lots that match your capital
- Takeprofit equal to 4-6% of capital account
- Stoplose equal to 2-3% of capital account
