GOLD SELL PREDICTION DEC 2025After Asian Market session open and hit it's high i'm in for a XAUUSD (GoldUS dollar) short position .
Goldsell

What is the target price for gold after its consolidation?
news:
Gold prices rebounded strongly overnight following the Federal Reserve's third consecutive 25-basis-point interest rate cut. Spot gold closed up 1.2%, reaching a more than one-month high of $4,285.75 per ounce, while silver hit a record high of $64.31 per ounce.
Four Factors Driving Gold Price Surge:
1. Fed Rate Cut Implemented + Increased Expectations of Policy Easing
2. Trump's Policy Controversy Exacerbates Geopolitical and Trade Uncertainty
3. Weak US Economic Data + Pre-Non-Farm Payroll Report Pressure
4. Dual Support from Global Central Banks and Supply and Demand Factors
Technical aspects:
The 4-hour chart shows that after breaking through the key resistance level of $4260, gold prices have formed a strong "breakout-pullback-rise" structure. Currently, the price is holding above the 5-day, 10-day, and 20-day moving averages, which are in a bullish alignment.
The MACD indicator has formed a bullish crossover above the zero line, with the red histogram bars continuing to expand. Trading volume is 30% higher than the previous trading session, indicating strong short-term bullish momentum.
The Bollinger Bands are widening upwards, with the price trading near the upper band. The previous triangle consolidation pattern has been broken, and the first resistance level is at the psychological level of $4300. A break above this level would open up upside potential to $4350.
Strategy Signals:
Buy:4310-4320, stop loss : 4300, target: 4360, 4380

GoldXAUUSD
- Fibonacci Level - 361.80%
- Fair Value Gap
- Completed " 123 " Impulsive Waves
- Break of Structure
- Symmetrical Triangle as an corrective pattern in Long Time Frame

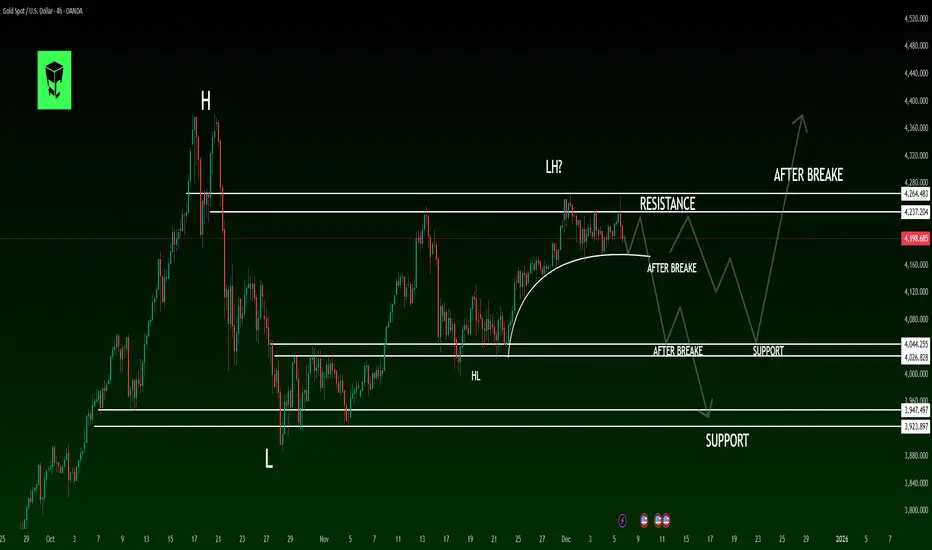
Gold - This is the bullrun top!⚰️Gold ( OANDA:XAUUSD ) is slowly reversing now:
🔎Analysis summary:
Starting back in the end of 2015, Gold established another major bullish cycle. Ever since the rounding bottom breakout, Gold has been rallying higher and higher. But at this exact moment, Gold retests major resistance and is slowly starting to create a reversal.
📝Levels to watch:
$4,000
SwingTraderPhil
SwingTrading.Simplified. | Investing.Simplified. | #LONGTERMVISION

The downward trend in gold prices is likely to continue.
news:
The Federal Reserve cut interest rates by 25 basis points as expected, fully in line with market expectations.
However, internal opinions diverged the most this year, with the statement signaling a "hawkish rate cut," predicting a very slow pace of easing in the future, with only one rate cut expected in the next two years.
Because this statement was not significantly different from previous market expectations, although it presented a hawkish signal, it was not as strong as previously anticipated. Gold prices initially fell after the data release but then rose, breaking through the key level of 4230 immediately after Powell's speech.
This indicates that the market has largely priced in this data release. With the subsequent release of non-farm payroll and CPI data, if the cooling labor market and inflation cannot be controlled, gold and silver may face another round of declines.
Technical aspects:
1. The daily moving averages MA5 and MA10 are converging and flattening, indicating a sideways price movement. The MACD indicator is also converging and flattening, further suggesting a sideways price movement. Currently, daily support is around the parabolic retracement level and the middle Bollinger Band, corresponding to the 4175-4165 range. In the short term, the daily chart is expected to remain within the large range of 4260-4170.
2. On the 4-hour chart, the MACD is currently consolidating near the zero line with decreasing volume, and the candlestick has also fallen back to around 4200, near the middle Bollinger Band. Currently, all 4-hour moving averages are intertwined around the middle Bollinger Band, indicating that the price is oscillating around this level, within the 4190-4130 range.
3. On the hourly chart, the MACD is currently showing a bearish crossover with increasing volume, and the stochastic oscillator is rapidly moving downwards into oversold territory, indicating a weak and sideways price movement. Short-term support is at the MA60, around 4200. A break below this level will likely lead to further downward movement towards the lower Bollinger Band, currently around 4160.
Strategy Signals:
Buy at 4235-40, stop loss : 4250, target: 4210, 4190, 4160

GoldXAUUSD
- Change of Characteristics
- Symmetrical Triangle as an corrective pattern in Short Time Frame
- Consolidation Phase
- Order Block
- Fair Value Gap

Gold Technical Outlook: Gold
📈 Upside Scenario (Bullish)
The current trading level is around the break-even point of 4180. We can note that the current trend suggests trading around this break-even point with a bullish direction aiming to reach the resistance line at 4218.
Confirmation: Breaking the resistance line at 4218 and closing a 1-hour candle above it will fully support the upside trend.
Targets: The movement will be towards reaching the levels of 4245 and 4265.
📉 Downside Scenario (Bearish)
If the price manages to make a correction and breaks the break-even point of 4180 downwards, the trend will become bearish, aiming to reach the support line at 4165.
Continuation: To continue the descent towards the level of 4145, the 4165 support level must be broken.
Summary of Key Levels
Break-even Area: 4180
Upside Targets: 4218, 4245, 4265
Downside Targets/Supports: 4165, 4145

GOLD SHORT 70% PAYOFF HERE long l acitve above alarm activeOANDA:XAUUSD im waiting strrong magnet is much below i could xhort here but , i cant ignore the swwep last it did so waiting for more bearish clue shorting is 70% ,waiting long is more prone if it clear some resistance follow for more updates

Does a fluctuating gold price necessarily mean an upward trend?
news:
On Tuesday (December 9) in early Asian trading, spot gold traded in a narrow range, currently hovering around $4,192 per ounce. On Monday, spot gold prices fell slightly, closing at $4,190 per ounce, down 0.2%, while US gold futures settled down 0.6% at $4,217 per ounce. The market is taking a brief breather ahead of the Federal Reserve policy meeting, with investors holding their breath awaiting the latest statements from Fed Chairman Powell. Meanwhile, geopolitical tensions, dollar volatility, and unexpected events such as the Japanese earthquake are all subtly influencing gold's price movements.
Federal Reserve Chairman Jerome Powell stated that this rate cut is similar to the risk-management-driven rate cut in September. A December rate cut is far from certain, and a lack of economic data could provide a reason to pause rate adjustments. If information is lacking and the situation remains unchanged, there are reasons to slow the pace of rate cuts. There is significant disagreement within the committee regarding how to act in December. A growing number of officials want to postpone the rate cut, believing that at least one cycle should be waited. The government shutdown has cut off sources of economic data, but existing data suggests that the outlook has not changed significantly. Private data is being considered, but it cannot replace official data. Inflation levels remain slightly high, recent inflation expectations have risen, and long-term expectations are solid.
Technical indicators:
Looking at the 1-hour chart, the key resistance level to watch is 4240, with further short-term resistance around 4215-20. On the downside, the key support level is 4165-75. Technically, the current consolidation suggests a tendency to short on pullbacks. We should patiently wait for key entry points. Specific trading strategies will be provided in the channel; please pay close attention.
Strategy Signals:
Buy:4215-4220, stop loss : 4228, target :4190-4180.

Gold Forecast - Trade Zones & Setup Before FOMCGold is still trading weak under the descending trendline and the price continues to reject the 4220–4230 resistance zone. As long as it stays below this area the chart suggests bearish pressure toward 4170 and possibly 4145–4130 where strong liquidity sits.
With the Fed rate decision tomorrow volatility is expected to increase so price may remain choppy within this range until the announcement. A clear bullish shift only comes if gold breaks and holds above 4225 which could reopen the path toward 4250–4260. For now structure remains bearish with lower-high formations and clean downside targets visible.
🔵 Buy Zone
- 4165–4175 → This is the main demand zone.
- Buy Trigger: A strong bullish candle / rejection wick from 4165–4170 confirms buyers stepping in.
- Upside Target: 4200 → 4220 → 4230.
🔴 Sell Zone
- 4220–4230 → Major supply + trendline resistance.
- Sell Trigger: If price retests 4220–4230 and gives rejection or bearish engulfing, downside resumes.
- Downside Target: 4170 → 4145 → 4130.
⚠️ Important Note (Fed Rates Tomorrow):
Before the announcement, gold may stay inside 4200–4170 range, so triggers will be cleaner after the news when volatility expands.
Note
Please risk management in trading is a Key so use your money accordingly. If you like the idea then please like and boost. Thank you and Good Luck!

XAUUSD Gold Volume Profile Resistance Trade Plan’m watching Gold (XAUUSD) right now, and we’re starting to see bearish momentum coming in after that recent consolidation phase. 📉🪙 When I apply the volume profile, price has now broken below the Point of Control (POC) — and that level is a major value area where a lot of trading activity has taken place. Once price slips under the POC, it often begins acting as strong resistance. 🧱
If Gold stays below this POC and we get a clean continuation to the downside, I’ll be looking for a potential sell setup. ✔️ However, if price pushes back above the POC and starts holding above that area, then I’ll completely abandon the bearish idea and wait for a new opportunity. ⚠️
Keep it simple — let price action tell the story.
Not financial advice.

Gold's breach opens up downside potential.
news:
Amidst turbulent global financial markets, the US dollar index experienced a rebound after hitting a low last Friday, US Treasury yields climbed to a more than two-week high, while gold prices rose and then fell back. This week's focus is undoubtedly on the Federal Reserve's interest rate decision.
The market widely expects the Fed to implement a 25 basis point rate cut, which would be the third consecutive easing of monetary policy. However, investors are increasingly divided on the future path of easing.
Combined with the latest US economic data, inflation performance, and dovish statements from several Fed officials, gold prices, while supported, encountered resistance. The surge in US Treasury yields reflects hawkish expectations of a rate cut, while the dollar fluctuated within a range.
Technical indicators:
Gold Hourly Chart: So far this Asian and European session, volatility has been minimal. Overnight, the price rallied and then weakened, approaching the hourly mid-band and the previous resistance level of 4218-19. The strategy is to sell on rallies below this level, given the initial rebound this morning. So far, the price has only tested as low as 4200, with extremely slow and sluggish movement.
During the US session, pay attention to the mid-band. If it provides resistance, the intraday high is unlikely to be broken, and the price will likely continue to decline. Conversely, if it breaks above the mid-band with consecutive positive candles, the intraday high may break higher. In that case, watch the 4225-4233 resistance zone, which is also the 50% and 61% Fibonacci retracement levels. Resistance there will likely continue the downward trend. Support is at 4192-91, which is also the trendline support of 4163-4175. Only when this support is decisively broken will the consolidation at the relatively high 4260-4160 end, and a new trading range will begin, with lower highs and lows, potentially reaching 4100-4200.
Strategy Signals:
Buy : 4228-4238, stop loss : 4249, target: 4207, 4185, 4170

Gold Big Sell-Off Ahead? Gold Showing Clear Bearish SignalsAs expected, Gold delivered a classic early-month liquidity grab, creating a false move before reversing. Price tapped the 4H bearish Order Block and reacted with strong downside aggression, confirming bearish intent.
At this stage, I would like to see a retracement into the 1H bearish OB at the 4254–4224 zone, which sits firmly in premium, along with a fill of the 1H FVG at 4235–4220. Once these areas are mitigated, the path toward the 4100–3900 region opens up.
My first partials/first target would be taken around the 4100 level.

GOLD Technical Analysis: Multi-Layer Structure & Key Scenarios 4H Timeframe Analysis ⏰
Gold has entered a structural corrective phase after a strong bullish trend that formed a Higher High (HH). This correction is visible in momentum, volume, and market structure with a confirmed Lower High (LH) formation. The combination signals a powerful Decision Point that will determine gold's medium-term direction. 🔄
🔶 Market Structure Breakdown
◼️ 1. Main Bullish Wave 🚀
After breaking October resistance, price formed a HH
HH showed buyer strength, but first weakness appeared:
Sharp rejection from top → Declining bullish momentum 📉
◼️ 2. Correction Phase ⬇️
Initial correction formed a Higher Low (HL)
Price failed to break previous high → Valid LH formed
Market entered neutral-to-bearish structure
◼️ 3. Current Status 🎯
Price is trapped between two key zones:
Resistance:4270
Support: 4022
Key Levels:
🔸 Resistance Zone: LH formation area, multiple rejections
Breakout = Correction end + New bullish wave 🟢
🔸 Mid Support: Trend anchor level
Break = First confirmation of bearish structure 🔴
🔸 Major Support:4170
Break = Medium-term correction activation 📉
🔶 Probable Scenarios
🟢 BULLISH SCENARIO (Resistance Break)
Break & close above LH zone
R→S conversion
New bullish wave with volume increase
Targets:4440
🔴 BEARISH SCENARIO (Support Break)
Failure at resistance + Mid support break
Deep correction wave + New LL formation
Targets: 3950
🔶 Market Psychology 🧠
Current price action shows:
Buyer caution ⚠️
Gradual sell orders accumulation at resistance
Limited seller power in corrections
High sensitivity to fundamental news 📰
Typical pre-breakout/breakdown consolidation
📢 Your Thoughts?
Comment below with your analysis! 👇
⚠️ RISK DISCLAIMER:
Trading carries high risk. Always educate yourself and use proper risk management. Not financial advice. 📚
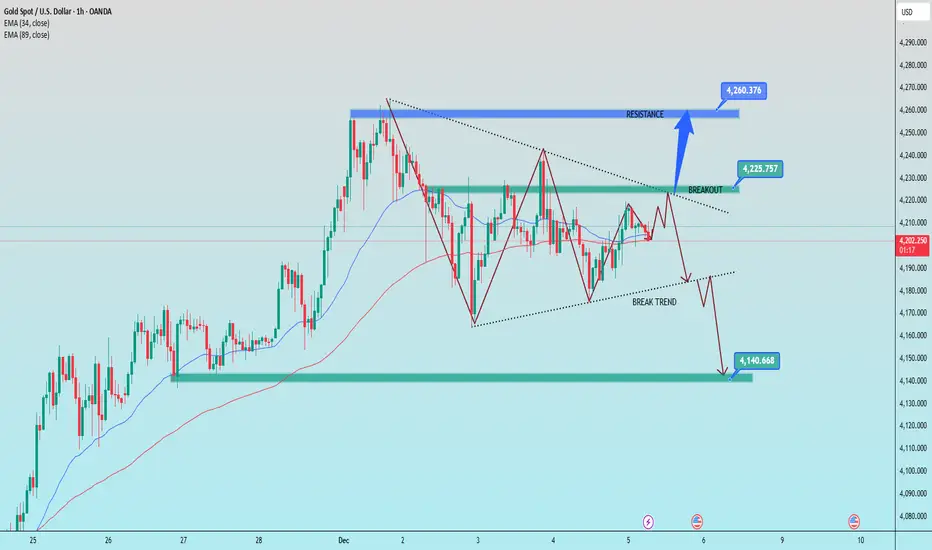
GOLD 1H Analysis – Breakout / Retest Trendline in PlayGOLD 1H Analysis – Breakout / Retest Trendline in Play
Gold is currently testing the upper channel resistance, forming a rising wedge pattern similar to the previous two structures. Each time price formed this pattern, we saw a sharp breakout and a retest, followed by a clear directional move.
Now, price has reached the critical decision area again.
---
🔍 Key Insights
📌 1. Rising Wedge Formation
The market has repeated the same structure three times:
Price climbs inside a tight channel
Tests the top of the wedge
Breaks out → retests → strong move
This repetition increases the probability of another structured move.
---
📉 Bearish Scenario (Higher Probability)
If price fails to break above the wedge and rejects at the red arrow:
Expect a move back to the trendline
Break below the trendline will confirm bearish continuation
Targets: 4210 → 4185 → 4160
This aligns with the orange arrows on your chart.
---
📈 Bullish Scenario (Lower Probability but valid)
If price breaks above the wedge cleanly:
Expect a retest
Upside movement possible
Targets: 4280 → 4300
This reflects the yellow upward arrows drawn on your chart.
---
📌 Summary
Gold is at a decision point.
A breakout from this wedge will define the next move.
👉 Watch for:
A clean rejection at resistance for the sell setup
A clean breakout above the wedge for the buy continuation.

Gold further downside next weekGold price had closed below 5 day moving average for the past 3 days, this would be a sign for further downside. This is also the third time the gold price is unable to break above 4250 area.
There should be further attempts to try to break above, in the mean time, momentary retracement should be on the cards next week.
This retracement might be to gather further strength to break to the upside later.
Trading strategy -> continue to buy on dip, control small lot size.

Gold price developments at the end of the week of December 51️⃣ Trend Line
Descent trend line (above – dashed line)
Price has been touched and rejected several times → becomes strong dynamic resistance.
The 4,225–4,230 price zone is a key area:
→ Valid breakout = opens upward momentum towards 4,260.
→ Failed breakout = price returns down following the previous trend.
Ascending trend line (below – dashed line)
This is dynamic support that maintains the short-term upward structure.
If price breaks through this trend line, a downtrend will activate.
2️⃣ Support Area – Key Resistance
4,225 – 4,230:
Confluence of the descending trend line + the previous supply zone → a designated area for buyers.
4,260 – 4,265:
Strongest resistance. When price touches this area, a downward reaction is likely.
Support
4,190 – 4,195:
The first area to be tested if the trend line is broken.
4,140 – 4,135 (lower green zone):
Very strong support – the main target if the downtrend is confirmed.
📌 Trading Signals
BUY GOLD: 4,140 – 4,138
Stop Loss: 4,130
Take Profit: 100 – 300 – 500 pips
SELL GOLD: 4,260 – 4,262
Stop Loss: 4,270
Take Profit: 100 – 300 – 500 pips
Gold Analysis – Possible Double-Top Before a Deeper Pullback
Gold Outlook – Potential Double-Top and Bearish Correction Ahead
Gold has reached a key resistance zone after a strong bullish leg. Based on current price action and the ascending trendline, two main scenarios stand out:
Scenario 1
Price may revisit the 4350 resistance and, if it fails to break above it, form a potential double-top pattern. This would increase the likelihood of a deeper correction.
Scenario 2
Gold could begin its pullback directly from the current area without printing a new high.
A confirmed break of the ascending trendline would be an early signal of bearish momentum.
In both scenarios, if short-term supports fail, the logical downside target for this correction sits around 3926.
This zone is expected to act as the first meaningful area for buyers to step in.

Are people still blindly chasing the rise in gold prices?
news:
Gold prices remained around $4,200 in early Asian trading on Thursday, as market bets on a potential rate cut by the Federal Reserve at its meeting next week intensified. Lower interest rates reduce the opportunity cost of holding non-interest-bearing assets, providing structural support for gold.
Weak US jobs data pushed the dollar lower, providing additional support for gold prices. The ADP report showed that US private sector employment fell by 32,000 in November, far worse than the revised increase of 47,000 in the previous month and also worse than the market expectation of a 5,000 increase. This was in line with our expectations, and gold remains in a downward trend.
U.S. initial jobless claims will be released on Thursday, while the PCE inflation indicator, which is more closely watched by the Federal Reserve, will be released on Friday. If the inflation data is unexpectedly strong, it could boost the dollar, thereby weakening gold prices in the short term.
Technical aspects:
The 1-hour chart shows that the recent pullback in gold prices has widened, causing the 4-hour RSI to revert from overbought levels. Currently, gold prices are stabilizing above the 20-day moving average support level on the 4-hour chart, further reinforcing the bearish bias on the 1-hour chart. A short-term pullback in gold prices may exacerbate short-term volatility; a cautious short-selling strategy is recommended for the day.
Strategy Signals:
Buy at 4209-4215, stop loss at 4227, target at 4190-4170.

ADP data will determine the $4,200 mark.
news:
In the crucial window leading up to the Federal Reserve's December interest rate meeting, the US November ADP employment data, to be released today, has become the market focus. Its performance will directly influence the short-term direction of gold prices, with bulls and bears fiercely battling around the $4200/ounce level.
ADP Data: The "Final Piece of the Puzzle" Influencing Fed Rate Cut Expectations
As a leading indicator of non-farm payroll data, this month's ADP data is far more important than ever. Due to the US government shutdown, the official employment reports for October and November will be postponed to December 16th, lagging behind the Fed's December 9-10 interest rate meeting. Therefore, today's ADP data will be a core reference for the Fed's policy decisions.
Technical aspects:
Looking at the 1-hour chart, the key resistance level to watch is 4240-50, while the short-term support level is around 4200, with a significant support level at 4175. Technically, the current consolidation suggests a tendency to short on pullbacks. We should patiently wait for key entry points. Specific trading strategies will be provided in the channel; please pay close attention.
Gold prices are still trading above the 5-10 day moving average, and the downtrend has not yet been broken. After the $4,200 level is lost, gold prices may face further declines.
Strategy Signals:
Buy: 4225-4230 Stop Loss: 4240 Target: 4200-4180

Current Gold Analysis M5 04-12-2025🚀 Option 1: Bullish Breakout Setup
GOLD (XAU/USD) is coiling up! 📈 The price action on the chart is forming a clear ascending structure/bull flag right below a key Resistance Zone at .
I’m watching for a decisive breakout and retest of this level to confirm the next leg up. If buyers step in, we could be targeting and beyond!
Setup: Long on confirmed break above . Risk Note: Always trade with a Stop Loss and manage your risk. Never risk more than you can afford to lose.
#XAUUSD #Gold #Forex #TradingSetup #Bullish #TechnicalAnalysis"
📉 Option 2: Bearish Rejection/Reversal Setup
"Is the Gold rally running out of steam? 📉 XAU/USD is showing signs of exhaustion at the upper Resistance Level around on the chart.
We've seen a clear rejection (bearish engulfing/pin bar) suggesting sellers are stepping in. I’m looking for a move back down to test the major Support Zone near .
Setup: Short on confirmed rejection below . Risk Note: This is a counter-trend move—exercise extreme caution and maintain tight risk management.
#XAUUSD #GoldTrading #Bearish #MarketAnalysis #GoldPrice #ForexSignals"

GoldXAUUSD
- Completed " 12345 " Impulsive Waves
- Symmetrical Triangle as an corrective pattern in Short Time Frame
- Break of Structure
- Bearish Channel as Long Time Frame
- Consolidation Phase

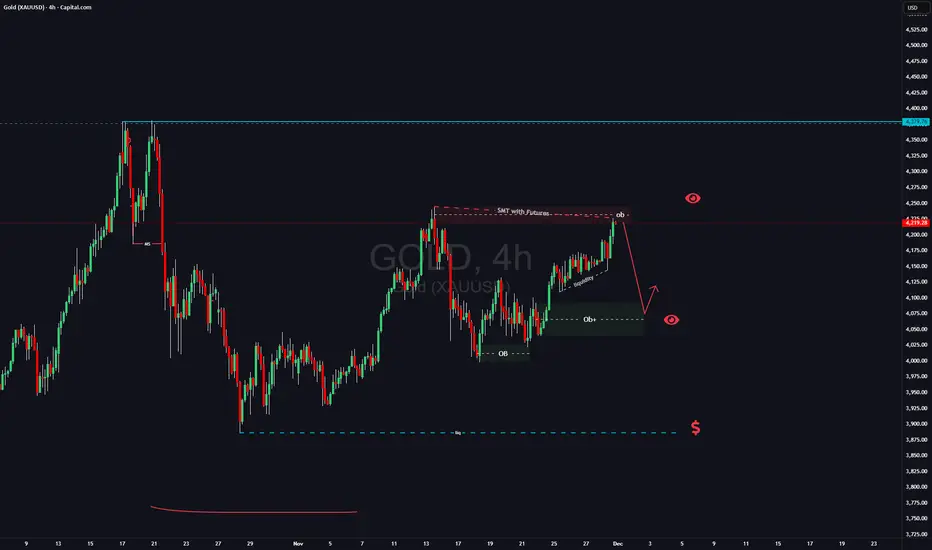
GOLD SETUP: The Liquidity Grab That Could Change Your Month!There is intresting situation on Gold right now:
1) There is SMT with futures(on futures price went higher than previous high from November 13th
2) Have a lot of liqudiity down below which usually means that this liqudiity will be taken
3) strong uptrend on LTF
taking in consideration these factors and that it will be beginign of the month on Monday i will be looking for manipulation at market opening. If i see trend shift on LTF i will be looking for short position till 4110 area (4h OB) , if this wont happen i simply gonna skiip trading GOLD this week.
When price action is not clean and when its hard to see clear picture better to avoid such trade and just watch.
Like and follow if you like my analysis