Gold continuation patternHere's exactly my idea, confirm it before you enter a trade! daily and 3H timeframe gaps. recommended to hit that gap only before it retraces back to 3600-3700 or above zone again.
Wait for that entry buy zone again. Or if you want to short this idea. look on 3H swept.
Chart is on daily. we might see 4180-4200, that's my short zone!
If you're having a good thoughts comment yours. this is a free community. Been dealing this moves. It's my base fibonacci level 1.61 above/retrace! before the price continues higher.
Follow for more. Watch only my zones entry buy/sell , Long/short! choose wisely.
To invest in my idea direct/private me here! with 70-30 split profit!
Goldsell

Gold at a Turning Point — The Final Breath of Wave (ii)?Following our previous Gold analyses, where we perfectly anticipated the major drop, it now appears that the corrective wave (ii) is nearing completion.
Although a small push higher could still occur, the current price zone is extremely risky for long positions, and it’s time to start looking for sell setups instead. 📉
Based on the Elliott Wave structure and Fibonacci projections, once this correction ends, the market is likely to enter wave (iii) to the downside — typically the strongest and most aggressive part of the entire sequence.
At this stage, patience and disciplined risk management are key, as the main bearish trend may soon reclaim full control of the market. ⚔️
-----------------------------------------------------------------------------------------------
🚀 Who am I?
I'm Mahdi, a prop firm trader with 7+ years of experience in technical analysis, mainly focusing on Smart Money Concepts and Elliott Wave theory.
I specialize in delivering high-quality trading signals, market insights, and educational content tailored for serious traders and investors.
📊 My Tools: SMC, Elliott Wave, Fibonacci, Liquidity Grabs, Order Blocks
💼 Prop Challenge Passed: Yes | Funded Account: In Progress
🔗 Follow for consistent updates and trading insights.

New update of gold Gold sell now it's drop very soon and big drop target 4150🎯 so ready to make entry level 4182 target 4150

Gold consolidates between $4100–$4115, awaiting breakout📊Market Overview
Gold (XAU/USD) is currently fluctuating around $4104 after a mild pullback from the $4112 zone.
The bullish momentum has paused as traders await fresh U.S. data, while the USD shows a short-term technical rebound.
Asian session liquidity remains thin — this is mainly an accumulation phase ahead of the European and U.S. sessions.
📉 Technical Analysis
• Resistance: $4118 – $4125 – $4140
• Support: $4100 – $4090 – $4078
• EMA50 (H1): Price is retesting dynamic support around $4100.
• RSI: 52 → Neutral, no clear selling pressure.
• Candlestick Structure: H1 candles are tightening, indicating a potential breakout setup.
📌 Outlook
Gold is consolidating in a narrow range.
If the price holds above $4100, the bullish trend could extend toward $4125–$4140.
However, a strong rejection at $4120–$4125 could trigger a short-term reversal.
________________________________________
💡 Trading Strategy
🔺 BUY XAU/USD : $4100 – $4097
🎯 TP: 40 / 80 / 200 pips
🛑 SL: $4093
🔻 SELL XAU/USD : $4122 – $4125
🎯 TP: 40 / 80 / 200 pips
🛑 SL: $4128

Xauusd 11.12We had a huge move yesterday! Let’s see if we can keep it up today! We can see the correction starting — but how far will it go? Maybe back to 4000? We’ll see, but that’s what we’re watching today! If the entry doesn’t trigger, leave it — don’t chase the trade! And once you hit 50% profit, close half immediately! Let’s go, have a great day!

Gold price rise meets expectations, is $4200 still far away?
News:
Spot gold continued its upward momentum in Asian trading on Tuesday (November 11), rising for the third consecutive day after breaking through the $4,100 mark in the previous trading session. It once rose to around $4,148.91 per ounce, a new high since October 23, and the fourth day of gains in the past five trading days.
Key Driver: Weak US Economic Data Ignites Interest Rate Cut Expectations
The root of the problem lies in a series of weak US economic data released last week. This data acted like a hammer blow, shattering market illusions of a robust economy.
Secondly, the US consumer confidence index released last Friday showed a sharp decline in early November due to household concerns about an economic recession. These two data points combined to reinforce market expectations of a dovish stance from the Federal Reserve.
Technical aspects:
From a technical perspective, gold prices briefly rose above the 50% Fibonacci retracement level of 4134, the level following the recent sharp correction from the October all-time high. Combined with the positive oscillator on the daily chart, this confirms the short-term bullish outlook for gold. A further break above the 4155-4160 USD area would confirm the bullish bias and push gold to retest the 4100 USD level. This level is close to the 61.8% Fibonacci retracement level (4192), and a decisive break above this level would pave the way for further gains.
From an hourly chart perspective, the two most crucial support levels for gold are around 4120-25 and the 4000 level.
4120-25 coincides with the hourly chart's 20-period moving average (MA20), and 4115 is also near today's opening price. Therefore, as long as gold stabilizes above these levels, it's likely to maintain a consolidation and upward trend today.
Trading strategy:
Buy:4125-4120, SL: 4115, TP: 4160-4180

Gold Technical Outlook:
Price has stabilized above the 4105 level, indicating a potential bullish continuation toward the resistance zone at 4160.
A break and confirmation above 4160 on the 1-hour or 4-hour candle would strengthen the bullish sentiment and open the way for further upside targets at 4188 and 4220.
However, if the price drops and breaks below 4105, this would invalidate the bullish scenario and shift the outlook toward a downward move targeting the 4075 support level.

Gold near 4,150 resistance — sell reaction, buy the dip at 4,095📊 Market Overview:
Gold (XAU/USD) is trading near $4,130/oz, pausing its recent rally at $4,135–$4,150 resistance.
Traders are waiting for the U.S. CPI data and Fed speeches, while the weaker USD supports short-term bullish sentiment.
🧭 Technical Analysis:
• Resistance: $4,135 – $4,150 / $4,180 – $4,200
• Support: $4,095 – $4,080 / $4,050 – $4,020
• EMA50 (H1): Rising around $4,110, maintaining bullish bias.
• H1 candles show long lower wicks near $4,100 — buyers still defending.
• RSI (H1) near 60, suggesting room for a pullback before continuation.
💬 Outlook:
Gold is consolidating between $4,095–$4,150, signaling indecision.
Best approach: Sell the resistance reaction and Buy the dip at support, waiting for confirmation candles.
A confirmed close above $4,150 opens the path to $4,180–$4,200, while rejection may trigger a short-term pullback.
________________________________________
🎯 Trading Strategy:
🔻 SELL XAU/USD
Entry: $4,145 – $4,148
🎯 TP: 40 / 80 / 200 pips
🛑 SL: $4,151
🔺 BUY XAU/USD
Entry: $4,095 – $4,098
🎯 TP: 40 / 80 / 200 pips
🛑 SL: $4,092

The bullish trend in gold has begun to continue.
News:
Gold prices broke through resistance again in early US trading on Monday (November 10), resulting in a volatile rebound in the market. Spot gold opened at its lowest point of the day and then rose steadily throughout the day, currently trading around $4090, up 1.91%.
With the government shutdown nearing its end, the Federal Reserve may be poised to shift its policy. "The Fed currently lacks comprehensive data support... but it is already sensing weakness in the labor market." In the absence of reliable data anchoring, policy decisions will face significant challenges.
Technical aspects:
The combination of technical and fundamental factors has strengthened the short-term upward momentum for gold, with support around 4050 and the Bollinger Band middle line at 4030 acting as lower support. Resistance is located at 4120.00.
If the yield tests the upper Bollinger Band at 4.146%, gold may face opportunity cost pressure and retrace to the middle line; however, the MACD golden cross indicates solid lower support. If the price holds above the short-term support at 4050, it may further test 4120.00.
Trading strategy:
Buy:4050-4045, SL: 4040, TP: 4080-4120

Gold - The bullrun is over today!💰Gold ( TVC:GOLD ) creates a massive top:
🔎Analysis summary:
Starting all the way back in 2015, Gold created a major rounding bottom pattern. After the breakout, Gold started its major bullrun, rallying about +300% over the past couple of years. But after this rally, Gold is now showing clear signs of a serious top formation.
📝Levels to watch:
$4,000
SwingTraderPhil
SwingTrading.Simplified. | Investing.Simplified. | #LONGTERMVISION

GOLD | Daily Analysis #5 - 10 November 2025Hello and Welcome back to DP,
Technical Analysis:
🟩 Demand Zones (Support Areas)
$4,025 – $4,060
This is the primary demand zone
Formed after a strong bullish impulse that broke previous structure highs.
Multiple bullish candles emerged from this zone with increasing volume — clear institutional buying footprint.
Acts as immediate support if price retraces.
A sustained hold above $4,060 keeps short-term buyers in control.
🟥 Supply Zones (Resistance Areas)
$4,108 – $4,148
Prior distribution area before the sharp drop in late October.
Sellers previously defended this level twice (confirmed by the red arrows).
Expect profit-taking or short setups on the first retest — this is major resistance in the short term.
First rejection likely near $4,120; a 2H close above $4,150 would invalidate the bearish pressure here.
$4,366 – $4,370 (black line above)
Upper-level supply and major swing high from October.
Would become the next upside target if price breaks and holds above $4,150.
SO, After forming a higher low near $3,760, price shifted bullish, breaking successive minor structure highs. Current move is an impulsive leg approaching the first strong supply zone ($4,108–$4,148).
The market is bullish in the short term, but approaching key overhead supply.
Disclaimer:
This content is for informational purposes only and does not constitute financial or investment advice. © DIBAPRISM
Amir D.Kohn

XAUUSDHello Traders! 👋
What are your thoughts on Gold?
The $3,900 level continues to act as a key support zone for gold, preventing further downside pressure for now.
Currently, the price is consolidating between the highlighted support and resistance levels, showing range-bound behavior in the short term.
We expect gold to form a short-term upward correction toward the resistance zone, followed by a bearish rejection from that level.
If price fails to hold above $3,900 zone and breaks below the support, a deeper decline toward lower levels could follow.
As long as the $3,900 support holds, gold is likely to remain in a sideways structure, but a confirmed breakdown would signal the start of a new bearish leg.
Don’t forget to like and share your thoughts in the comments! ❤️

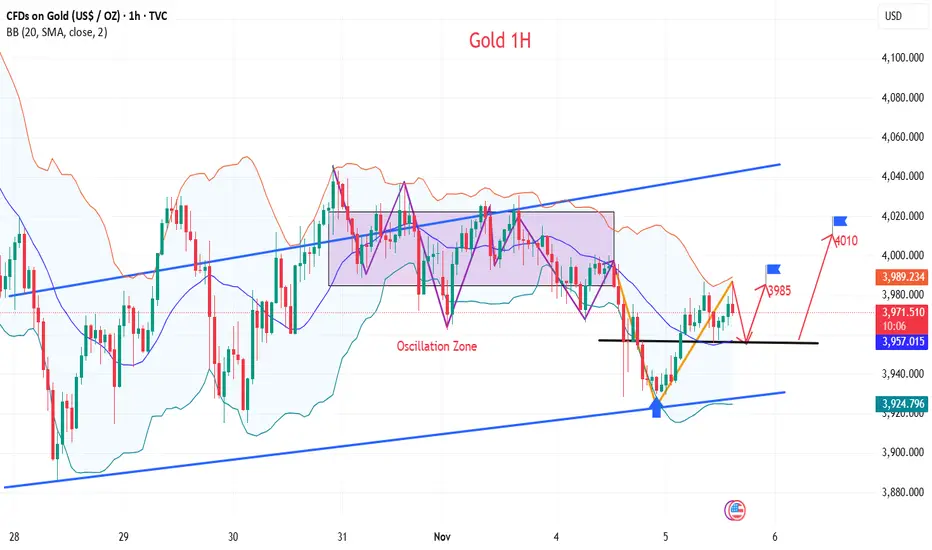
Gold is trading in a range; opening trading strategy
News:
Gold (XAU/USD) traded in a narrow range around $4,000 this week, lacking a clear direction. Geopolitical risks have temporarily taken a backseat, while the US government shutdown delayed the release of key economic data, creating an "information vacuum" in the market. Against this backdrop, investors are turning to speeches by Federal Reserve officials, the dollar's performance, and fluctuations in the US stock market for clues about the next move.
Gold prices have entered a consolidation phase after a deep correction.
Technical aspects:
From the 1-hour chart, the current short-term resistance level to watch is 4030-25, with the key level at 4000 being a crucial support/resistance level. Short-term support is around 3980, with the previous low at 3965 being a key level to watch. The recommended strategy is to buy on dips, and to avoid chasing the market in the middle range, patiently waiting for key entry points.
Specific trading strategies will be provided in the channel; please pay attention.
Trading strategy:
1:Buy:4010-4005, SL: 4015, TP: 3990-3985
2:Buy:3985-3980,SL:3975,TP:4005-4015-4035

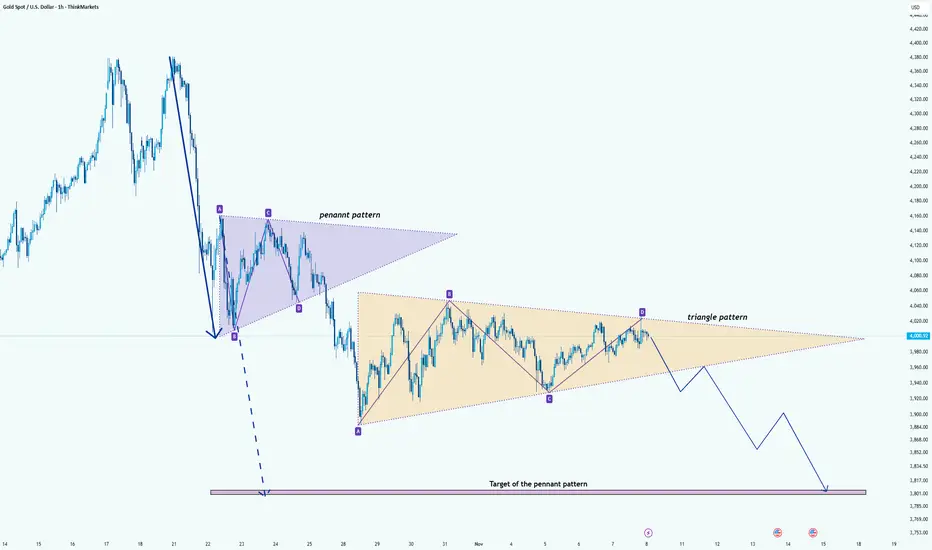
Gold (XAUUSD): Triangle Compression After Pennant BreakHi!
After the strong, impulsive drop, Gold formed a bearish pennant, which has already broken to the downside. The measured move target of that pennant remains unfilled, and the price continues to consolidate below the breakdown point.
Currently, the market structure is developing inside a symmetrical triangle, showing compression and reduced volatility. This type of structure often acts as a continuation pattern when it forms after an impulsive leg, especially when positioned below the previous pennant.
The projection highlights the expectation of a downside breakout from the triangle, with a gradual sell-off into the next liquidity pocket. The ultimate target aligns with the remaining pennant target zone, which also coincides with a prior demand level.
As long as the price remains inside this tightening structure and below point D, the bearish continuation scenario stays valid.
Target: $3811
Disclaimer: As part of ThinkMarkets’ Influencer Program, I am sponsored to share and publish their charts in my analysis.
Golden Anchor: The Multi-Domain Resilience of BullionThe price of gold recently surged past $4,045 per ounce, cementing its role as a strategic global asset. This upward trend, pushing the year-to-date gain above 50%, is not merely speculative. It reflects deeply rooted structural forces across multiple global domains, from macroeconomics to high-tech demand. Investors are proactively using gold as a vital hedge against accelerating global uncertainty and fiat currency debasement.
Geopolitics & geostrategy: The De-Dollarization Hedge
Persistent geopolitical tensions drive sustained demand for gold's safe-haven status. Heightened conflict risks and unpredictable US tariff policies create global market volatility. In this fragmented landscape, gold acts as a politically neutral reserve asset, mitigating counterparty risk. Central banks globally are strategically accumulating gold to diversify away from the US dollar, accelerating the de-dollarization trend. This shift enhances national economic sovereignty, fueling gold's ascent.
Macroeconomics: Fiscal Dominance and Rate Cuts
Weakening US economic indicators directly reinforce gold’s appeal. A dip in the University of Michigan’s Consumer Sentiment Index signals broad economic unease. This fragility increases market bets on an earlier and more aggressive Federal Reserve rate-cutting cycle. Lower interest rates reduce the opportunity cost of holding non-yielding gold, boosting its price. Furthermore, the fiscal dominance prevalent in developed economies promotes gold as a critical hedge against the debasement of G7 fiat currencies.
Central Bank & Investment Demand Dynamics
Central bank purchases provide a formidable structural floor for gold prices. Despite the recent price correction, global central banks remain net buyers. They added 220 tonnes in Q3 2025 alone, representing a strategic, long-term commitment to gold. Poland, Kazakhstan, and Azerbaijan are notable accumulators. Retail and institutional investors are also turning to gold ETFs and physical bullion, viewing gold as essential financial insurance during systemic shocks.
Technology, Science, and High-Tech Demand
Technological advancements, particularly the boom in Artificial Intelligence, subtly support gold demand. While gold's main drivers remain macroeconomic, the high-tech sector consumes gold in electronic components and specialized circuits. Industrial demand remains resilient, offsetting a decline in jewelry consumption due to high prices. The massive, energy-intensive growth of AI and data centers indirectly creates a strategic need for high-value, reliable assets like gold to back infrastructure growth and hedge associated capital risks.
Technical Outlook and Consolidation Phase
Gold exhibits high long-term conviction but faces short-term consolidation after its historic rally. The price peaked at over $4,380 per ounce in mid-October before profit-taking began. Analysts expect the price to remain range-bound in the near term, with a maximum pullback risk around the strong $3,500/oz support level. Key technical resistance levels above the current peak are seen at $4,420/oz and $4,500/oz. Investors should utilize short-term dips as strategic long-term accumulation opportunities.

The bulls are back, and going long remains the main theme.#XAUUSD OANDA:XAUUSD TVC:GOLD
Although the beginning of the week didn't offer a pullback entry opportunity, gold rallied immediately after the open, breaking through 4030 as expected and continuing its upward trend, officially signaling the return of the bulls to the market.
From the hourly chart, gold broke through the resistance of the upward channel at 4055 and continued to fluctuate upwards, indicating that the bullish momentum remains strong in the short term. However, attention should be paid to the resistance at 4080-4100 from the weekly MA5 moving average and the daily middle line, and be wary of a possible pullback after a surge. Therefore, in the short term, avoid blindly chasing the rally, patiently waiting for a pullback to buy remains our main trading strategy. The first support level to watch is the 4055-4045 level, a previous resistance turning point, followed by the important support at 4030-4020.
Therefore, if gold prices fall back after encountering resistance during the European session, we can consider going long on gold in batches based on the strength of the pullback.

continue to accumulate - trading below 4000✍️ NOVA hello everyone, Let's comment on gold price next week from 11/10/2025 - 11/14/2025
⭐️GOLDEN INFORMATION:
Gold (XAU/USD) climbs 0.64% during Friday’s North American session, trading near $4,002 after rebounding from a daily low of $3,974. The ongoing US government shutdown and rising risk aversion keep equities under pressure, boosting demand for the safe-haven metal.
Gains in bullion are further supported by growing expectations of a December Fed rate cut. Meanwhile, the University of Michigan’s preliminary Consumer Sentiment Index for November dropped to its lowest level since June 2022, reflecting mounting concerns over the shutdown’s potential impact on the US economy.
⭐️Personal comments NOVA:
The market continues to be in a wait-and-see mode, accumulating as the US government remains shut down, and economic data from the US is delayed.
🔥 Technically:
Based on the resistance and support areas of the gold price according to the H4 frame, NOVA identifies the important key areas as follows:
Resistance: $4022, $4084
Support: $3961, $3917, $3885
🔥 NOTE:
Note: Nova wishes traders to manage their capital well
- take the number of lots that match your capital
- Takeprofit equal to 4-6% of capital account
- Stoplose equal to 2-3% of capital account
- The winner is the one who sticks with the market the longest
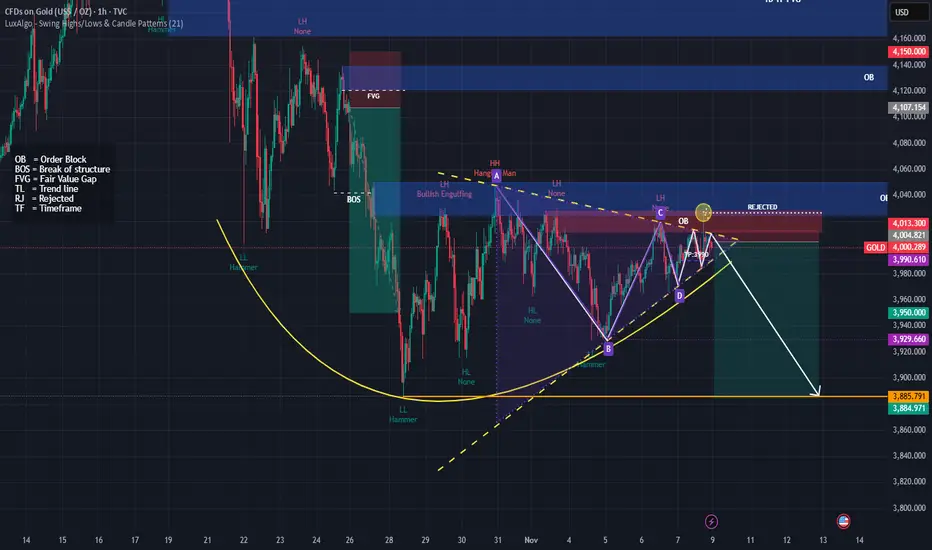
Rejected at (OB) $4013–$4020, next days 10th-14th target $3,885🧭 Overall Structure
The chart shows a potential bearish setup.
I have drawn a descending pattern (A-B-C-D) with rejection from an Order Block (OB) around $4,013–$4,020.
The white arrow projects a downward move toward 3,885.
🔍 Key Technical Elements
1. Order Blocks (OB)
Upper OB (~4,150–4,120): Higher timeframe supply zone; strong resistance if price rallies.
Current OB (~4,013–4,040): Recently rejected here — price reacted and failed to make a new higher high → confirms seller pressure.
2. Break of Structure (BOS)
A previous BOS occurred to the downside, suggesting bearish momentum took control after a temporary bullish leg.
3. Trend Lines (Yellow Dashed)
The upper TL connects lower highs → consistent downtrend.
The lower TL (support) was recently tested and might break soon — signaling bearish continuation.
4. Pattern
A–B–C–D harmonic-like pattern completed near the order block, often signaling a sell opportunity when it aligns with rejection zones.
Price formed a lower high (LH) at point C and another at D → confirms trend weakness.
5. Candlestick Rejection
“Rejected” and “Hammer” labels near point D and OB zone show failed bullish attempts → adds confluence for short.
🎯 Bearish Targets
TP1: 3,950 (nearest support)
TP2: 3,930 (previous low)
TP3 (Major): 3,885 (strong historical support zone)
⚠️ Invalidation
If price closes above 4,040–4,060 (OB zone), bearish setup invalidates.
That would mean liquidity grab and possible push toward 4,100–4,150 OB.
🧩 Summary
Bias Entry Zone Confirmation Targets Invalidation
Bearish 4,010–4,020 OB zone Rejection + lower high 3,950 → 3,930 → 3,885 Close above 4,060
Gold consolidates near 4000 as market awaits breakout1️⃣ Market Overview:
Gold (XAU/USD) climbed to $4008 earlier but was quickly sold off back to $3990, showing a strong tug-of-war between buyers and sellers.
Currently trading around $3998–$4002, the market remains in a tight consolidation phase ahead of potential volatility in the U.S. session.
The USD remains steady, while U.S. bond yields stay elevated — both limiting gold’s short-term upside momentum.
2️⃣ Technical Analysis:
• Resistance: $4008 – $4015 – $4025
• Support: $3990 – $3985 – $3972
• EMA50 (H1): around $3996 → acting as short-term dynamic support.
• RSI (H1): neutral near 50 → market still awaiting a decisive signal.
• Multiple spinning top candles on H1 indicate accumulation and indecision.
3️⃣ Outlook:
Gold continues to move sideways between $3990–$4010, showing price compression before a breakout.
If H1 closes above $4015, the bullish momentum could extend toward $4025–$4040.
However, a drop below $3988 could trigger another correction toward $3975.
4️⃣ Trading Strategy:
🔻 SELL XAU/USD
Entry: $4008 – $4012
🎯 TP: 40 / 80 / 200 pips
🛑 SL: $4016
🔺 BUY XAU/USD
Entry: $3975 – $3977
🎯 TP: 40 / 80 / 200 pips
🛑 SL: $3971

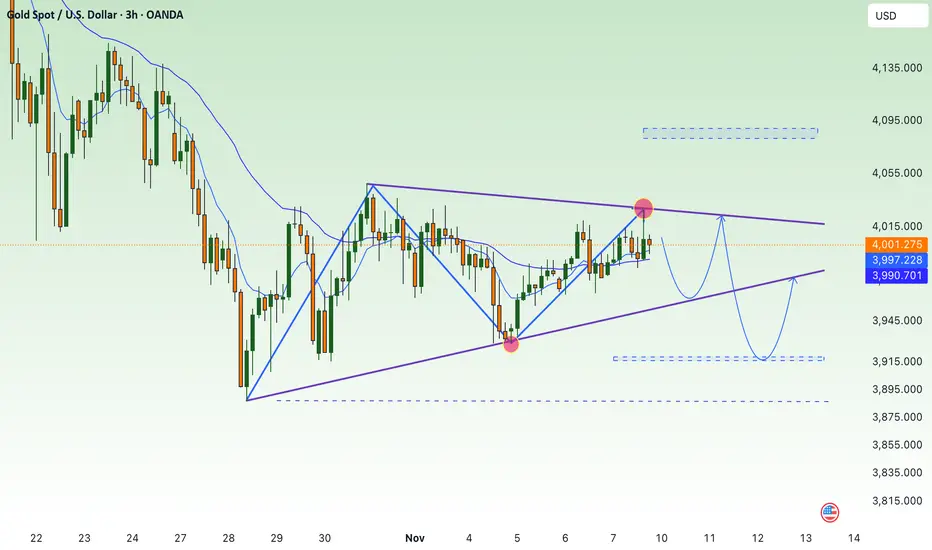
TRIANGLE FORMATIONSo given the low volatile week!
where will the gold break to from this triangle?
do comment!
im betting on buying on the lower side of triangle

Latest gold price trend analysis today!Market News:
On Friday (November 7th) in early Asian trading, spot gold traded sideways, currently hovering around $3990 per ounce. Yesterday, spot gold prices experienced extremely volatile fluctuations, with a daily range of $55. Weak US employment data initially spurred a surge in London gold prices, but international gold prices failed to hold onto their significant gains, partly due to profit-taking by investors, ultimately closing essentially flat.
The protracted US government shutdown, the legal battle over the legality of tariffs, the stark contrast in the labor market, and the growing expectation of a Fed rate cut all provided structural support for gold, but could not withstand the immediate impact of the US stock market crash. This led traders to seek safe haven in cash, instantly shattering gold's luster.
With the shutdown potentially taking a turn for the better and the Supreme Court's tariff ruling settling, gold's safe-haven narrative may be revived. If the Fed cuts rates as expected in December, gold could end the year with a strong rally. Traders should remain vigilant, closely monitoring the developments in private economic data, speeches by Federal Reserve officials, news regarding the US government shutdown, and international geopolitical developments.
Technical Analysis:
Gold has been trading within a range for eight consecutive trading days. The daily chart shows the 10-day and 7-day moving averages flattening, and the RSI indicator adjusting towards the midline. On the 4-hour chart, the Bollinger Bands are narrowing, with the price consolidating around the middle band. Currently, short-term moving averages are turning downwards, and the MACD indicator is showing a death cross signal, but it's getting closer to the zero line, so a continued consolidation is possible. The large-cycle consolidation range on the daily chart is locked at 4050-3900. Without breaking out of this range, a trend is unlikely to form. Currently, a break above 4050 is not considered strong, and a break below 3900 is not considered extremely weak; both buying and selling lack sustained momentum. We have consistently emphasized that gold is currently in a consolidation phase. Don't assume a major surge or reversal is imminent just because there's a rebound. It's still in a consolidation phase, and the overall center of gravity is still shifting downwards! The main trading strategy is to sell high and buy low!
Gold Intraday Trading Strategy:
Buy gold at 3960-3965, stop loss at 3950, target 4010-4030;
Sell gold at 4035-4040, stop loss at 4050, target 3980-3960;
Key Levels:
First Support: 3963, Second Support: 3952, Third Support: 3936
First Resistance: 3996, Second Resistance: 4010, Third Resistance: 4028

XAU/USD – Selling Opportunity Near Resistance ZoneGold is currently approaching a strong resistance level after an extended bullish move.

Beware of a reversal during gold price fluctuations.
News:
On Tuesday (November 4), spot gold fell 1.7% to close at $3,931.78 per ounce, while December U.S. gold futures also declined 1.3%, settling at $3,960.50. Increased internal divisions among Federal Reserve officials and a cooling of market expectations for a December rate cut helped the dollar index break through the 100 mark, reaching a more than three-month high, significantly pressuring gold prices.
However, concerns about a U.S. stock market bubble and the longest government shutdown in history continue to provide safe-haven support for gold prices. In the short term, gold bears have a slight advantage, and gold prices face the risk of further correction. However, if Wednesday's ADP private sector employment data is disappointing, gold prices could see a dramatic reversal.
Specifically:
Gold maintains a long-term bullish tone, with prices continuing their upward trend today, holding above key moving averages. The daily chart shows that the long-term bullish outlook remains solid as gold prices hold above the key technical level of the 100-day exponential moving average (3675.95).
However, in the short term, given that the 14-day Relative Strength Index (RSI) is hovering near the midline, a further consolidation phase cannot be ruled out, reflecting that gold is currently in a neutral momentum phase.
On the upside, the first resistance level to watch is the psychological level of $4000. If upward momentum continues, spot gold is expected to retest the October 31 high of $4045. A further break above this level would target the October 23 high of $4155.
On the downside, initial support for gold is located at the lower Bollinger Band at $3850. The emergence of more bearish candlestick patterns could indicate continued downward pressure, potentially dragging prices to the next support level – the September 25 low of $3720. The bullish outlook for gold remains unchanged.
Trading strategy:
Buy:3955-3950, SL: 3945, TP: 3985-4010-4030