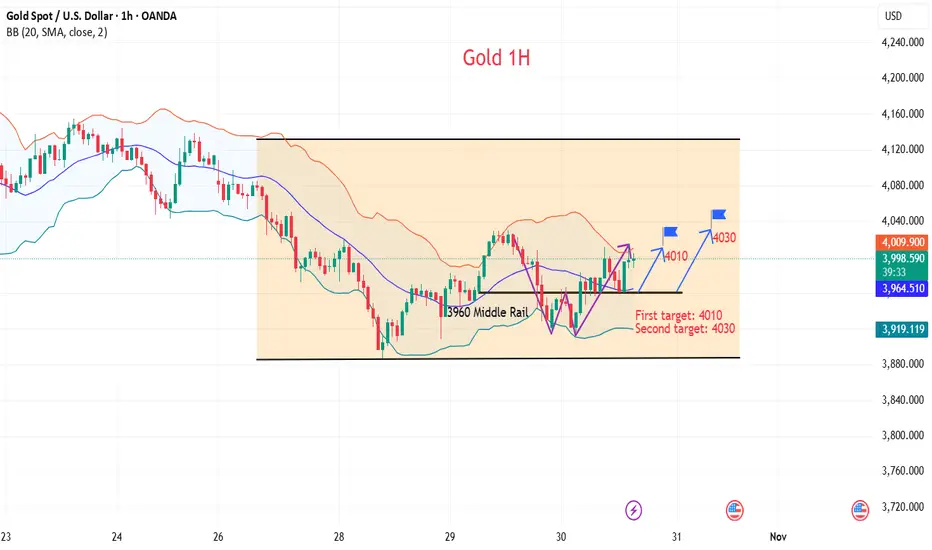
Gold bulls are strong; is 4100 still far away?
News:
Gold rallied after testing the 3915 area again, breaking through resistance levels at 3975-80 and 4030 throughout the day, closing with a large bullish candlestick and forming a bullish engulfing pattern.
This morning, it rose to around 4046 before falling back and breaking below the key support/resistance level of 4005-10.
Technology manifestation:
From the 1-hour chart, the current short-term resistance level to watch is 4035-4030, with a key resistance level at 4060-4055. If this area is broken, the gold price may reach 4100. The short-term support level to watch is 3960. The recommended strategy is to buy on dips, and to observe more and trade less in the middle, avoiding chasing the market and patiently waiting for key entry points.
I will provide specific operational strategies in the channel, so please pay attention.
Trading strategy:
Buy:3989-3986, SL: 3975, TP: 4010-4020-4030
Goldsell

Gold has not fallen below the $4,000 mark, so what's next?
News:
The Federal Reserve cut interest rates by 25 basis points as expected on Wednesday. However, to the market's surprise, Powell released an extremely hawkish signal, stating that a December rate cut is "far from a certainty," which directly caused a market crash. US stocks fell from their highs, the dollar rose, and gold and silver markets plummeted. The Fed also postponed the pause in its balance sheet reduction program until December.
This has temporarily tightened market expectations for a December rate cut, meaning that the expectation of a rate cut has temporarily failed to materialize. However, there is still more than a month until mid-December, and with fluctuations in data, expectations are likely to rise again.
Specifically:
Gold hourly chart: Today's price action was relatively volatile, with poor continuity and high deceptiveness. For example, the large bearish candle at 11:00 AM led many to believe a breakdown and weakness, following the overnight decline. However, a small W-shaped rally broke through the morning's opening price level.
Trading strategy:
Buy:3965-3960, SL: 3950, TP: 3980-4010-4030
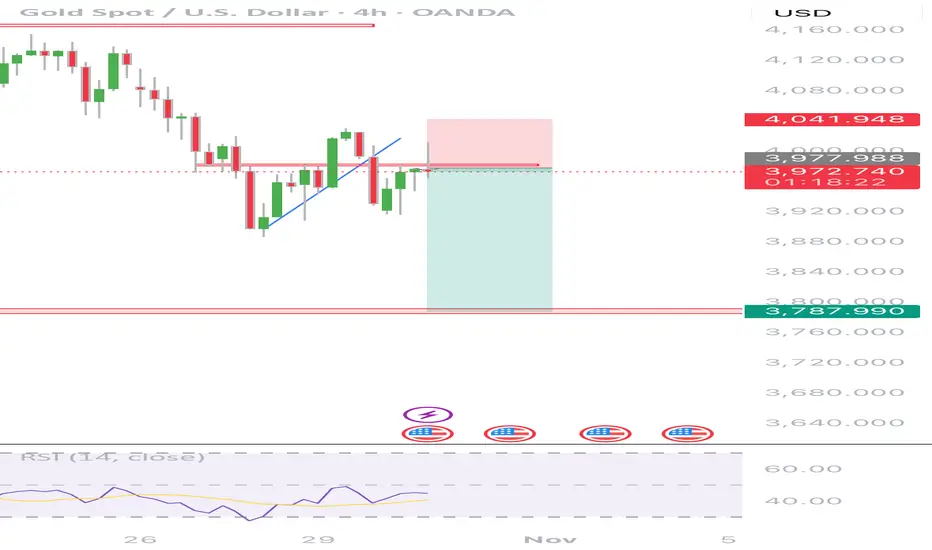
Gold Under Pressure as USD Recovers📊 Market Overview:
Gold (XAU/USD) trades near $4006/oz, extending its pullback as the U.S. dollar strengthens and Treasury yields rebound.
Traders are cautious ahead of upcoming U.S. PMI and PCE data, which could shape expectations for the Fed’s next rate move.
📉 Technical Analysis:
• Key resistance: $4030 – $4050
• Nearest support: $3990 – $3975
• EMA09 (H1): Price remains below EMA09, confirming short-term bearish bias
• Candle/volume/momentum: Consecutive bearish candles with long upper wicks indicate strong selling pressure; RSI near 40 shows more downside potential.
📌 Outlook:
Gold may extend its short-term decline if USD strength persists and yields stay elevated.
However, $3990 – $3975 remains a potential rebound zone if a bullish rejection candle appears.
💡 Trade Setup:
🔻 SELL XAU/USD at: $4047 – $4050
🎯 TP: 40 / 80 / 200 pips
❌ SL: $4053
🔺 BUY XAU/USD at: $3975 – $3977
🎯 TP: 40 / 80 / 200 pips
❌ SL: $3972

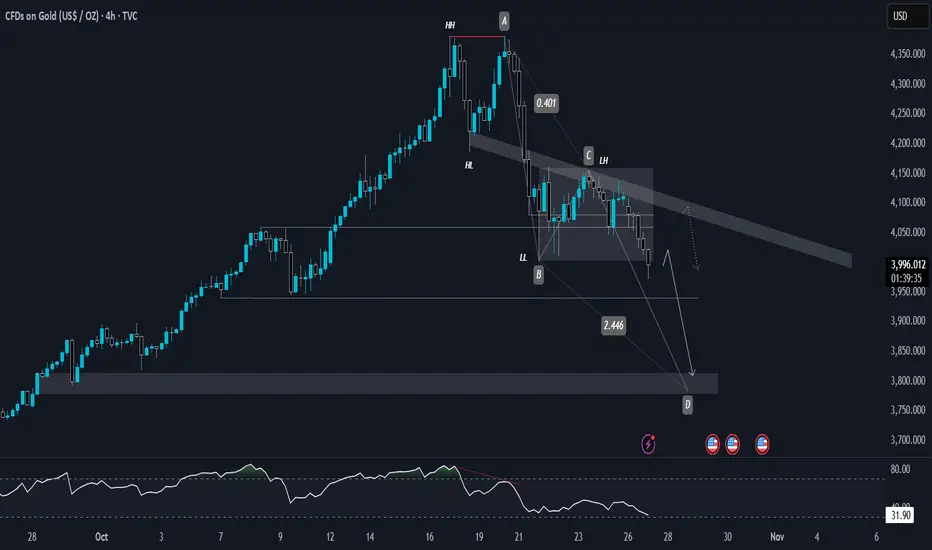
XAU/USD: Bearish Decline to 3827?OANDA:XAUUSD is exhibiting bearish momentum on the 1-hour chart , with price respecting a downward trendline and pulling back toward the EMA 50 (1H) as dynamic resistance, creating a prime short opportunity near the highlighted entry zone amid ongoing consolidation. This setup suggests continuation of the downtrend if sellers push through toward lower supports. 🎯
Entry zone between 3979-4020 for a sell position. Target at 3827 near the support and take profit zone, yielding a risk-reward ratio greater than 1:2.5 . Set a stop loss on a close above 4035 to manage risk. 🌟 Await confirmation with a bearish close below the entry and rising volume, tapping into gold's sensitivity to USD strength.
Fundamentally , this week features the FOMC meeting on October 29, where the Fed's rate decision could bolster the dollar if hawkish tones prevail. Additionally, outcomes from the ongoing Trump-Xi trade talks—kicking off this week in Asia—could spark major market volatility, potentially pressuring gold if a US-China deal materializes. 💡
📝 Trade Plan:
🎯 Entry Zone: 3979 – 4020 (short setup near resistance)
❌ Stop Loss: Close above 4035
✅ Target: 3827 (support / take-profit zone)
💎 Risk-to-Reward: Greater than 1:2.5, offering an excellent downside opportunity for disciplined traders.
What's your view on this gold drop? Comment below! 👇

Gold Buy at 4080 and sell at 4240Now gold in consolidation mode and trying to book profits and make the retail traders into the trap so for now we need to be patience and buy at 4080 and close at 4240, after the fed interest cut gold will come down so sell at 4240 and wait for long selling till 3966. This method is Wd Gann inspiration i made and am still learning, this one sharing for study purpose so trade with your own analysis.

Continue to accumulate along the 4058 trend line⭐️GOLDEN INFORMATION:
Gold (XAU/USD) faces renewed selling pressure after an early Asian uptick toward $4,046, pausing this week’s rebound from its lowest level since October 6. The US Dollar (USD) holds near a three-month high following the Federal Reserve’s hawkish stance, weighing on the non-yielding metal.
Additionally, optimism over easing US–China trade tensions dampens safe-haven demand. Still, lingering worries about the prolonged US government shutdown could limit USD strength and offer some support to gold prices.
⭐️Personal comments NOVA:
market accumulation time, sideways around 4000. ended october with volatility
⭐️SET UP GOLD PRICE:
🔥SELL GOLD zone: 4058 - 4060 SL 4065
TP1: $4050
TP2: $4040
TP3: $4020
🔥BUY GOLD zone: 3887 - 3885 SL 3880
TP1: $3900
TP2: $3910
TP3: $3925
⭐️Technical analysis:
Based on technical indicators EMA 34, EMA89 and support resistance areas to set up a reasonable sell order.
⭐️NOTE:
Note: Nova wishes traders to manage their capital well
- take the number of lots that match your capital
- Takeprofit equal to 4-6% of capital account
- Stoplose equal to 2-3% of capital account

Gold Price Analysis – Will Bears Drag XAUUSD Below 3900?Gold continues to trade within a clear downward structure facing consistent resistance near the 4040–4060 zone while maintaining pressure below key descending trendlines. Price recently confirmed another Change of Character (ChoCH) near the 3972 level suggesting bearish continuation. The projection shows potential short-term pullbacks toward 3980–4000 followed by a deeper drop toward targets at 3901 and 3857.
Unless bulls reclaim the 4063–4128 resistance the overall bias remains bearish with expectations of further downside toward the $3,816–$3,850 support range.
Regarding the Fed meeting tomorrow markets widely expect a 25 bps rate cut which is already priced in. The real impact will come from the Fed speech if the Fed hints at further easing (a dovish stance) gold may bounce higher as the dollar weakens. But if the Fed sounds cautious or signals a pause gold could drop sharply as yields and dollar strength return. Overall trend remains bearish traders should stay alert to post Fed volatility as it could temporarily disrupt or confirm the next major move.
🔴 Sell Zone:
The main sell zone is between 4150-4200 which aligns with the upper resistance range and the top boundary of the descending channel. This area has repeatedly acted as a rejection point where sellers step in aggressively. If price retraces into this zone and forms bearish confirmation candles it becomes a strong region to look for short entries.
⚡ Sell Trigger Area:
The sell trigger area lies around 4000 which is a key psychological and structural level. A confirmed break and candle close below 4000 would likely trigger renewed bearish momentum opening the way toward 3901-3857 as next downside targets. This break would confirm continuation of the bearish wave and strengthen the short bias.
Note
Please risk management in trading is a Key so use your money accordingly. If you like the idea then please like and boost. Thank you and Good Luck!

Gold 4-Hour Timeframe Analysis(Nuclear testing Resumed)Gold appears to be setting up for another potential short opportunity. Despite yesterday’s rate-cut announcement, price action showed limited bullish momentum, even after Chair Powell signaled the likelihood of an additional cut in December. This lack of upside response suggests continued bearish sentiment.
Additionally, geopolitical risk remains elevated. Reports indicate former President Trump may push to resume nuclear testing, in response to President Putin’s recent strategic posturing and threats involving advanced weapons systems. While such developments typically support safe-haven assets, gold has yet to reflect meaningful bullish follow-through following these headlines.
Overall, current structural behavior on the 4-hour chart continues to favor bearish movement unless a significant shift in fundamentals or market sentiment emerges
Gold - Sell around 3960, target 3920-3880Gold Market Analysis:
The long-awaited interest rate cut has finally happened. The Federal Reserve cut interest rates by 0.25 basis points again, in line with market expectations. The market reaction was significant; gold did not surge as expected, but instead plunged. This is typical of the market – it's always right. Today's strategy remains to sell, looking for opportunities to sell on small rebounds. The daily moving averages are starting to diverge downwards. Yesterday's rebound failed to break the daily moving averages, hovering around them before falling further. Moving average resistance has always been a last resort for buyers. The weekly top has already appeared. Our future strategy will be to sell at higher prices, targeting a bearish outlook. Today, I predict a break below 3885. If this level is broken, it will open up new downside potential.
There are two minor resistance levels in the Asian session: one around 3948, and the other a minor high around 3966. If 3966 is broken, it may re-enter a period of consolidation, and a bottom may appear on the hourly chart. For today's Asian session, we expect a weak consolidation. The current position is the first strong support level encountered after the sharp drop in gold prices. Large fluctuations at this level are normal technical corrections and not a bottoming signal.
Resistance: 3966, Strong resistance: 3989; Support: 3900, Strong support: 3885; 3966 is the key level for market strength/weakness.
Fundamental Analysis:
The Federal Reserve cut interest rates by 25 basis points as expected. The Fed lowered the benchmark interest rate by 25 basis points to 3.75%-4.00%, marking the second consecutive rate cut at its meeting, in line with market expectations...
Trading Recommendation:
Gold - Sell around 3960, target 3920-3880.

Strategic positioning ahead of the Fed decision
News:
The Federal Reserve's interest rate decision is poised to trigger significant market volatility today.
Gold prices remain bearish after three consecutive days of declines. The Fed will announce its monetary policy decision on Wednesday.
This week's expectations for the Fed meeting focus on two points: a 25 basis point rate cut, and, given the growing disagreement among policymakers regarding the future path of interest rates, Powell is unlikely to provide any clear guidance.
Powell hinted earlier this month that the FOMC will continue to focus on threats to the labor market. Last week's weaker-than-expected inflation report may temporarily dampen hawkish rhetoric within the Fed regarding inflation.
Due to the US government shutdown, Fed officials have been unable to obtain complete data on the labor market since early September.
Specifically:
Gold prices have fallen below $4,000/oz. In the coming weeks, gold prices may fall further towards the $3,850-$3,800/oz range. Unless a strong rebound occurs, the short-term outlook remains bearish.
Looking at the 4-hour chart, gold prices previously fell along a descending slope from a high of $4,155, reaching a low of $3,886 before forming a V-shaped rebound. During this rebound, Fibonacci retracement levels formed a clear "stepped resistance-support" pattern.
If inflation subsequently rises, or the labor market tightens again, causing the market to downgrade the consensus from "two rate cuts this year" to "one," the dollar and long-term interest rates will rise, and gold will return to below the upper edge of the descending channel. The consolidation phase, where time is used to create space, will be prolonged, and the $4,050-$4,090 range will evolve into a "strong resistance box," with multiple attempts to break through it failing to hold.
Trading strategy:
Buy: 4025-4035, SL: 4050, TP: 3920-3880-3820
If the price of gold does not retrace to the target level before the speech, then a short position can be established at the current price.

#XAUUSD: Two Entries, Three Targets, Swing Sell! Gold dropped to 3883 region, the lowest point in the last two months. Since then, it has started rebounding. Currently, the price is approaching a very important key level, which could lead to a smooth reversal. However, market conditions will be extremely volatile, making it difficult to predict any move. This is because we have the NFP coming up. Due to this volatility, both of these entry points are equally possible.
Once either entry is confirmed, you should place a target based on your risk management and trade planning. Remember, this is not a confirmation, and the price could go in the opposite direction. Please do your own analysis before making any financial decisions.
We are here to help. If you have any questions related to this analysis or any trading matter, please drop a comment. We will do our best to help you out. If you want to support us, please like and comment on the idea.
Team Setupsfx_

Focus on the Federal Reserve, short once in 4020.#XAUUSD OANDA:XAUUSD TVC:GOLD
Last night, I gave everyone a trading strategy to short at 3975-3990. It can be said that there were several opportunities after the Asian session opened. As long as you followed the strategy and executed the short order, I believe you will definitely have a rich return if you seize any of the opportunities.
However, please note that trading is never done blindly. Price trends change over time, so please combine strategies with flexible responses. For example, since the current gold price has broken through the trendline resistance, short-term traders should be more cautious.
With the trend resistance broken, the short-term bulls have strengthened further. The first resistance level to watch is 4000-4005. As a psychological barrier for previous defense, gold prices will definitely test this resistance level first if they want to rise further. If this level is broken, gold will continue its upward trend and further test yesterday's rebound high of 4020. This is also the key level that bears need to defend today. Therefore, I believe we should not rush into trading in the short term. We can patiently observe the market performance. When the gold price rebounds to the 4010-4020 resistance range and encounters resistance, we can consider shorting gold appropriately.

Gold - Sell near 3981, target 3940-3900Gold Market Analysis:
Yesterday, gold rebounded sharply after hitting a low of around 3886 on the daily chart. Selling pressure had broken through 4000 and 3900, indicating a short-term sell signal. However, the late-day rally resulted in a very long lower shadow on the daily chart. I predict gold will consolidate and fluctuate today. No market can fall indefinitely; after a significant drop, consolidation and correction are necessary. Today, we'll focus on the potential profit from any subsequent decline. During the Asian session, we'll maintain a sell-on-high strategy. The weekly chart's top signal is confirmed, making a new high unlikely in the short term. There are two possibilities: either a correction begins, with the price falling back to its previous high, or a large-scale consolidation and sharp price swings at higher levels. Based on yesterday's performance, a large-scale consolidation at higher levels is more likely. In such a market, timing is crucial. The high point of the Asian session rebound, 3981, is the hourly high and the first resistance point in the Asian session. Even stronger is 4019, which was the previous bottom of the pattern and has now transformed into a new strong resistance level. If future buying can hold above this level, it could trigger a new major rebound. The 5-day moving average on the daily chart is also approaching this level, making further corrections more likely.
Support is 3941 and 3900, while resistance is 3981 and 4019. 3981 is the dividing line between strength and weakness.
Fundamental Analysis:
The previous smooth Sino-US trade negotiations were positive for the US dollar, leading to a sharp drop in gold as safe-haven sentiment eased. Another major data point this week is the Federal Reserve's monetary policy announcement.
Trading Recommendation:
Gold - Sell near 3981, target 3940-3900.

Gold Consolidates Weakly Around $3925 – Sellers Still in Control📊 1. Market Overview
Gold prices rebounded slightly from the $3900 level, reaching $3931 before losing momentum. The market is now moving sideways around $3925 in a weak consolidation phase. The U.S. dollar remains firm as Treasury yields stay elevated, while traders await the upcoming PCE inflation data, limiting gold’s recovery potential.
🔍 2. Technical Analysis
• Main Trend: Bearish, with weak corrective rebounds.
• Immediate Resistance: $3930 – $3935
• Higher Resistance: $3948 – $3960
• Near-term Support: $3900 – $3890
• EMA50 & EMA200 (H1): EMA50 remains below EMA200, confirming the ongoing bearish bias.
• Candlestick Pattern: Small lower-tail candles around 3925 indicate mild buying but no clear reversal signal.
• RSI (H1): 45 – neutral, suggesting potential range-bound movement before breaking above 3930 or below 3900.
💡 3. Outlook
Gold is currently in a short-term accumulation phase after a steep drop, but the broader trend remains bearish. A rejection from the $3930–$3935 resistance zone could trigger another decline toward $3900 or even $3880. Conversely, a decisive breakout above $3935 with strong volume may extend the rebound toward $3960.
🎯 4. Trading Strategy
🔻 SELL XAU/USD: $3928 – $3932
🎯 TP: 40 / 80 / 200 pips
🛑 SL: $3938

Analysis of the latest gold price trends today!Market News:
On Wednesday (October 29th) in early Asian trading, gold rose slightly, currently trading above $3960. Yesterday, gold experienced significant volatility, with London gold prices plunging to a three-week low of $3886. News of progress in US-China trade negotiations weakened gold's safe-haven appeal. However, the latest news on the Middle East situation rekindled some safe-haven buying, stimulating a surge in international gold prices from their lows, ultimately closing with a significant reduction in intraday losses. Gold's safe-haven appeal has been impacted by expectations of a de-escalation in the US-China trade war, leading to continued capital flows into riskier assets such as US stocks. Meanwhile, escalating geopolitical tensions in the Middle East suggest that if hostilities in the Middle East erupt again, gold prices could recover some of the losses from the past two weeks. In the short term, gold prices may continue to be under pressure, and the $3886 low may not be the bottom. However, in the medium to long term, if the Fed's interest rate cut cycle deepens or geopolitical events reignite, gold still has the potential to regain its upward momentum. Short-term attention should be paid to the resistance level near $4000. Today's market focus will shift to the Federal Reserve's interest rate decision and Chairman Powell's press conference.
Technical Analysis:
Gold has completed its phase of adjustment after bottoming out and rebounding. The daily chart shows a long lower shadow, finding support at the 3886/3900 level. The RSI indicator has also found some support at the midline. Technically, the market is biased towards buying, with a strategy of selling high and buying low. Secondly, today's fundamental news, including the Fed's interest rate decision and Powell's speech, will have a significant impact on the gold and silver markets and requires close attention. Looking at the hourly chart, gold prices rebounded after a series of declines, stopping at $3886, but have not yet broken through the resistance at the 4000-4005 level, a previous support/resistance level. The current market is still dominated by sellers! The current hourly moving average resistance is around 3985, and a break above this level could lead to a test of the 4004 level. Unless gold experiences a sharp V-shaped reversal, the selling pressure is unlikely to end easily. There is no such thing as a market that only falls; rallies are necessary to enter the market!
Gold intraday trading strategy:
Short-term gold buy at 3915-3920, stop loss at 3905, target at 3980-4000;
Short-term gold sell at 4005-4010, stop loss at 4020, target at 3950-3920;
Key points:
First support level: 3925, second support level: 3900, third support level: 3883
First resistance level: 3985, second resistance level: 4004, third resistance level: 4033

Gold prices still face the risk of falling further
News:
Gold prices weakened again in U.S. trading on Monday (October 27), extending last week's decline. With the thaw in U.S.-China trade relations, investor demand for gold as a safe-haven asset has declined. Market focus has now shifted to the Federal Reserve's interest rate decision, which is expected to be a rate cut later this week.
Spot gold prices fell below $4,000 an ounce on Monday, hitting a three-week low of $3,885 an ounce at one point, as improved market sentiment weakened demand for the safe-haven metal.
Specifically:
Gold daily level: Yesterday closed with a big negative, losing the middle track support. Originally expected to close with a cross or a small positive or negative today, to rebound and confirm the middle track resistance and then rise and fall, to prepare for a wave of pull-ups after tomorrow's interest rate cut, it is also easy to cause a false fall after the middle track breaks, tempting investors to follow the trend and continue to bearish at low levels; but in fact, today continued to fall.
At present, the price of gold has fallen below the previous terraced support band in the 4-hour trend. The K-line continues to be under pressure and the short-term moving average maintains a good volatile downward trend. In the short term, we will pay attention to whether there will be a second downward trend after the rebound and repair.
Today's focus is on the 4000-20 area to suppress the decline, and breaking through 3970-75 to look below 3900. The target has been achieved. After the short-term plunge in gold, and with the Federal Reserve's interest rate decision approaching, the bulls and bears will play a tug-of-war.
Trading strategy:
Buy: 3990-3985, SL: 4050, TP: 3930-3910

GOLD H1 OUTLOOKH1 Gold Looking Bearish Structure
Selling First Zone Of FVG
Sllibg Second Zone Of CISD
Target Old Low / Sell Side Liquidity
Stay Tuned Boost The Post And Follow Us

Gold at a Critical Crossroad: Bounce or Breakdown Ahead?Hi!
The gold price is currently trading around $4,042, sitting just above a critical support area near $3,953.80. This gray zone is a key decision point for the next major move.
Trend Structure:
The broader trend remains bullish, moving within a well-defined ascending channel.
Double Top Formation:
A short-term double top has formed near recent highs, triggering a corrective move down into the channel’s midline and the gray support area.
Critical Support Zone ($3,953.80):
This level aligns with previous structure support and the channel’s bottom, making it a high-probability reaction zone.
________________
Scenario 1: Bullish Reaction (Primary Scenario)
If gold holds above the gray critical area and bounces within the ascending channel, we could see a renewed bullish wave.
Confirmation: A strong bullish reaction or higher low around $3,953–$3,980.
Target: The green target zone around $4,619.57, corresponding to the upper channel boundary and a potential measured move from the recent correction.
Scenario 2: Bearish Breakdown
If the gray area fails to hold, it could signal deeper downside momentum.
Trigger: A clean break and 4H close below $3,953.80.
Target: The pink support zone near $3,656.01, which aligns with prior accumulation and the lower channel boundary.
________________
Disclaimer: As part of ThinkMarkets’ Influencer Program, I am sponsored to share and publish their charts in my analysis.

Gold - Sell near 4019, target 3980-3970Gold Market Analysis:
Yesterday, we sold gold at 4066, 4037, 4049, and 4050, maintaining a bearish outlook. Yesterday's blog analysis and chart clearly demonstrated this bearish outlook. Gold's selling price dipped to as low as 3970, surprisingly breaking through 4000 with ease. In fact, from a broader perspective, 4000 is a major support level and a round number. I predict there will be further trading around 4000. Today's strategy remains bearish, so continue selling on rallies. Yesterday's decline was too large, and today's decline is expected to correct. Gold has been volatile recently, so we should try to follow the trend and chase orders. If you follow orders, the probability of losses is higher. A small rebound can result in 30-50 pips, making it difficult to take technical positions. We must also stick to our direction and not change it easily. Today's Asian session tested resistance at 4019. If this level holds, selling is still acceptable. The current pattern suggests a stronger resistance level at 4049, which has transformed from a previous strong support level into a new resistance level. Yesterday's daily chart closed negative, and after breaking 4000, selling today suggests continued downward momentum. Furthermore, if 4049 unexpectedly breaks, it will be necessary to observe whether there is a new rally.
Resistance levels are 4019 and 4049, support is 3970, and 4019 is the dividing line between strength and weakness.
Fundamental Analysis:
The decline in gold prices is attributed to the fading of news, which has led to a decline in risk aversion. We will continue to monitor the Federal Reserve's new monetary policy.
Trading Recommendation:
Gold - Sell near 4019, target 3980-3970.

Analysis of the latest gold price trends today!Market News:
In early Asian trading on Tuesday (October 28th), London gold prices continued to fall, currently trading around 3980. Progress in Sino-US trade talks, coupled with strong global stock market performance and rising US Treasury yields, have weakened gold's safe-haven appeal. International gold prices plummeted on Monday, falling below 4000, reaching a low of 3971. From last week's high of 4381, gold has fallen by nearly $400! As tensions between the world's two largest economies ease, investors are more inclined to sell gold and shift to riskier assets such as stocks and technology stocks, putting pressure on gold prices. This week, global financial markets are focused on the Federal Reserve's interest rate decision, to be announced on Wednesday. If the Fed reiterates its path of gradual rate cuts at its meeting and fails to signal an end to quantitative tightening, international gold prices may struggle to rebound quickly. The current pullback in gold prices may present an opportunity to invest at a low level, but caution is advised. Closely monitor the Fed's interest rate decision and post-meeting statement, as well as the outcome of Thursday's Sino-US meeting. In addition, tech earnings reports and consumer confidence data will also provide further market guidance. Investors should consider these factors comprehensively and develop flexible investment strategies.
Technical Analysis:
Gold fell below the 4000 mark and closed with a negative daily close. Technically, the daily chart structure remains biased towards selling. Yesterday, it pulled back below the middle Bollinger Band level of 4000 to 3971. The RSI indicator reached the mid-line 50 and adjusted its value. The 10/7-day moving average formed a death crossover at the high of 4175 and opened downward. On the short-term four-hour chart, after the formation of a double top structure at 4380, gold has entered a mid-term structural correction. The price is trading within the lower middle Bollinger Band, the RSI indicator is trading below the mid-line, and the moving average system is opening downward. Gold still has room to fall. I personally believe that the upward trend will not break in the short term. Gold has broken below the 4000 mark and is about to test the 3900 level. After breaking through the neckline of the double top on the four-hour chart, it has been fluctuating weakly below the neckline. Selling momentum still exists. Gold once broke through the 4004 level, which has now become resistance. Gold's resistance below 4004 presents an opportunity to buy on rallies. Gold is under pressure and struggling to break through, so continue to sell on rebounds!
Gold Intraday Trading Strategy:
Short-term buy gold at 3910-3915, stop loss at 3900, target at 3980-4000;
Short-term sell gold at 4005-4010, stop loss at 4020, target at 3950-3920;
Key Points:
First Support Level: 3962, Second Support Level: 3920, Third Support Level: 3886
First Resistance Level: 4010, Second Resistance Level: 4045, Third Resistance Level: 4078

GOLD 4H | Harmonic AB=CD Bearish Reversal in PlayGold recently formed a clear double top at the all-time high (ATH), accompanied by a bearish divergence on higher timeframes — signaling exhaustion of bullish momentum. That divergence has played out perfectly, aligning with the current bearish market structure.
The price has now broken below the key accumulation range between 4000 and 4149, confirming a shift in sentiment. With the trend consistently printing lower lows (LL) and lower highs (LH), the overall market bias remains bearish.
🔹 Technical Breakdown
We currently have a bearish AB=CD pattern completing near the 3800 zone, which aligns with the Fibonacci golden ratio (0.618) on the D leg.
Although AB=CD is traditionally a bullish harmonic pattern, here it’s being used within a downtrend context to identify a potential reversal or continuation zone — depending on market reaction at D.
Key Zone to Watch:
🟡 3800 – 3840 → Major potential reaction zone (Fib confluence + AB=CD completion).
If sellers hold this level, we could see further downside momentum.
🔹 Daily Chart View
On the daily timeframe, bullish momentum looks weak — every recovery candle is smaller, and volume favors sellers. With the AB=CD pattern confirmation and price failing to reclaim the 40050 zone, the bias stays bearish.
🔹 Weekly Chart Insight
Historically, gold tends to retrace after 9 consecutive straight bullish weekly candles.
From 1990 to 2025, each 9-week rally phase has been followed by a notable correction ranging from 6% to 14%, showing that extended rallies often precede profit-taking phases.
This current rally phase mirrors that same behavior patterns — making a corrective move toward 3800–3700 highly probability.
🧭 Final BIAS
The technical confluence between the bearish structure, double top + divergence, and AB=CD D-leg near golden ratio and 9 week rally gives a high-probability bearish setup.
If 3940 fails to hold, next potential downside target lies near 3900-3775, aligned with long-term structure support.
Gold falls below 4,000, is a bearish trend starting?
News:
Signs of easing trade tensions between the United States and China boosted investor appetite for riskier assets, as evidenced by optimism in global stock markets, which became a key factor weakening demand for safe-haven precious metals.
This week is a super week, with several major central banks, including the Federal Reserve, set to announce their interest rate decisions. The Federal Reserve, in particular, is expected to cut rates by another 25 basis points early Thursday morning.
The market currently anticipates further Fed rate cuts this week and in December. As long as this expectation remains unchanged, it will continue to support markets like stocks, gold, and silver, while putting pressure on the US dollar. Conversely, if expectations are not met, the market will reverse course.
Specifically:
Judging from the 4-hour market trend, the current focus is on the short-term suppression line of 4055-4045. Gold is under pressure and difficult to break through. The 4000 mark has been broken, and a short-term bearish pattern has been opened. The operation is mainly based on rebound shorting. For the middle position, watch more and do less, be cautious in chasing orders, and wait patiently for key points to enter the market. I will provide detailed operation strategies in the channel, so please pay attention to them in time.
Trading strategy:
Buy: 4025-4035, SL: 4050, TP: 3965-3945

GOLD aka XAUUSD is heading to the downside!!Last week XAUUSD (Gold) had a very bearish week! It ended its bullish streak of years and declined to the downside. It only recently broke a very strong support zone (the green trendline) and struggled to break above the resistance zone (red trendline). It should drop all the way down further all the way to the 3833 level.
