Beyond the Chart – GOLD Market Technical AnalysisOANDA:XAUUSD Short Setup
Price swept liquidity above recent highs and rejected with a Volume Climax (VC). Market structure shows a Break of Structure (BOS) to the downside, aligning with the bearish trend.
Targeting the imbalance (FVG) below at 3376.78 as price seeks efficiency. Volume profile confirms sellers taking control after the fakeout. 🔑
Goldshort

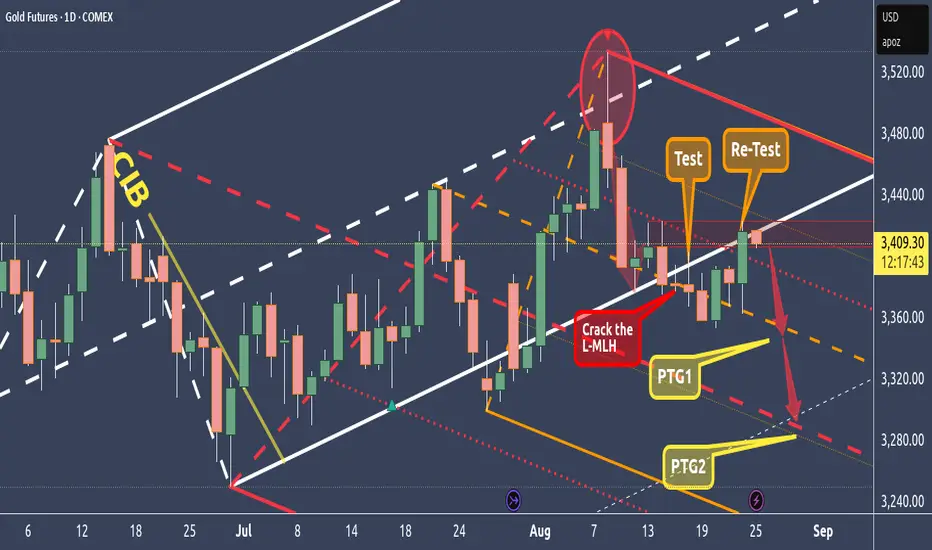
GC - Gold Re-Testing The L-MLH - Short AheadFirst we crack the L-MLH.
Then we got a test and now the re-test.
On a close outside the fork it's a present to short wit stops above somewhere the wicks high.
Profit at the orange Centerline (PTG1) and at the Red Centerline. All in all a wonderful trade with a decent risk/reward.
And if the train leaves without us, NO FOMO please §8-)
Smart Money Playbook: Where Will Gold Hunt Liquidity Next?Gold SMC Daily Plan – 26/08
Market Context (SMC perspective):
Price is consolidating near 3375 after an impulsive bullish move. There’s uncollected liquidity above 3385–3400, an FVG around 3354, and a deep buy zone at 3323–3327. Structure remains bullish unless 3327 is broken.
________________________________________
Key SMC Zones
• Liquidity Pool: 3385–3400 (potential sweep before reversal)
• FVG: 3354 region – watch for reaction
• Buy Zone: 3323–3327 (SL 3320)
• BOS/ChoCH: Upside confirmed above 3354; bearish shift if 3327 breaks
________________________________________
Trading Scenarios (SMC Logic)
1) BUY SCALP – Quick Liquidity Grab
• Entry: 3350–3352 (FVG support)
• SL: 3343
• TP: 3355 → 3360 → 3375 → 3385 → 3400+
Reason: Mitigation of FVG + bullish BOS continuation.
________________________________________
2) BUY ZONE – Swing Setup
• Entry: 3339–3336 (deep OB)
• SL: 3334
• TP: 3340 → 3350 → 3360 → 3365 → 3370 → 3380 → 3390 → 3400+
Reason: Possible liquidity sweep below 3340 before upside continuation.
________________________________________
3) SELL SCALP – Quick Reversal
• Entry: 3380–3383 (above intra-day liquidity)
• SL: 3385
• TP: 3378 → 3374 → 3370 → 3365 → 3360 → 3350
Reason: Sweep of local highs → BOS to downside.
________________________________________
4) SELL ZONE – High-Risk Liquidity Sweep
• Entry: 3400–3402
• SL: 3406
• TP: 3395 → 3390 → 3385 → 3380 → 3370 → 3360
Reason: Hunt major liquidity above 3400, then reversal.
________________________________________
SMC Flow for Today:
• Look for buy confirmations around FVG 3354 or deep buy zone 3327.
• If price sweeps 3385–3400 first, watch for sell setups with BOS confirmation.
• Structure bias flips bearish only if price closes below 3327.

Gold SMC Playbook 25/08 – Liquidity Hunt at 3400 & 3325Market Context (SMC perspective)
Price is consolidating around 3367 after a strong impulsive push up and is currently reacting near minor resistance.
Clear ChoCH & BOS patterns confirm bullish intent on H1; however, liquidity pools remain below 3343 & 3325 (buy-side liquidity).
Imbalance zones identified: 3343–3341 and deeper 3325–3323 OB zone.
Key Levels
Resistance (Supply): 3372 – 3382 – 3389
Support (Demand): 3350 – 3342 – 3325
SMC Bias: Mixed – Play Both Long & Short Setups Around Liquidity
🔴 SELL Scenario (Short-term Liquidity Grab)
Entry: 3400 – 3403 (above local liquidity sweep)
Stop Loss: 3408
Targets:
TP1: 3390 (partial)
TP2: 3380
TP3: 3370
TP4: 3360 (open 3350 liquidity zone)
Rationale: Anticipate a sweep above 3400 into supply, then mitigation and sell-off.
🟢 BUY Scenario (Bullish Continuation from Demand OB)
Entry 1 (Scalp Buy): 3343 – 3341 (reactive zone) SL 3337
Entry 2 (Main OB): 3325 – 3323 (strong OB) SL 3319
Targets:
TP1: 3330
TP2: 3340
TP3: 3350
TP4: 3370 (open 3390 liquidity)
Rationale: Price may retrace to fill imbalance below 3340 and mitigate OB at 3325 before next bullish impulse.
Execution Plan (SMC flow):
Wait for liquidity sweep at highs or lows (above 3400 or below 3325) with confirmation.
Look for ChoCH & BOS on LTF (M5–M15) around OB for entry confirmation.
Trail SL to protect profits after TP1 hit; partial out and hold runner toward final liquidity target.

Gold Near Breakout – Watch $3,369 and $3,330Gold remains in a downtrend, forming a Bear Flag pattern within a broader descending channel. Price is capped below key resistance at $3,360–3,369 and is hovering near $3,340. A breakdown below $3,330 could accelerate losses toward $3,300 and $3,280, while a short-term bullish break above $3,369 may trigger a retracement toward $3,380 before sellers likely re-enter. Overall bias stays bearish unless price closes firmly above the upper resistance zone.
🔑 Key Levels to Watch
- Resistance: $3,360 → $3,369 → $3,380
- Support: $3,330 → $3,300 → $3,280
- Breakout Zones: Below $3,330 → Targets $3,300 and $3,280. Above $3,369 → Target $3,380
Note
Please risk management in trading is a Key so use your money accordingly. If you like the idea then please like and boost. Thank you and Good Luck!

Gold XAUUSD Intraday Setup 20.08.2025Gold trading in bearish channel with price at 3324 after support at 3312.
Resistance zones: 3329-3331, 3340-3343.
Low volatility indicates consolidation.
Potential for a retest of 3312 if bearish momentum resumes.
Watch for a break above 3341 as it could signal a trend reversal.
Trading Idea:1
Entry: 3329-3331
Stop Loss: 3338
Take Profit: 3312
Condition: Bearish candlestick at resistance.
Trading Idea:2
Entry: 3341-3343
Stop Loss: 3350
Take Profit: 3325
Condition: Bearish candlestick at resistance.
Notes.
Confirm with volume increase on sell-off. Watch for false breakouts above 3340-3341.

Gold 4h | BearishGold has been trading within a bearish parallel channel on the 4H timeframe, respecting both upper and lower trendlines with clear momentum to the downside. Price structure continues to form lower highs (LH) and lower lows (LL), confirming the prevailing bearish trend.
🔎 Key Observations:
Bearish Market Structure – The sequence of lower highs and lower lows indicates sellers are firmly in control. Each rally attempt has been capped below previous highs, showing strong supply pressure.
Parallel Channel – Price action is respecting the channel boundaries. Recent rejections from the upper trendline reinforce the bearish outlook.
Psychological Level – 3300 – The 3300 zone stands out as a major psychological level and a potential magnet for price. It also aligns with historical demand, making it a critical support to watch.
Momentum – Current candles show strong bearish bodies with weak rejections, highlighting continued downside pressure.
📉 Bearish Outlook:
If sellers maintain control, Gold is likely to extend the move down towards the 3300 demand zone. A clean break below this level could open the door for deeper corrections.
📊 Possible Scenarios:
Base Case (Bearish Continuation): Price respects the channel and continues lower toward 3300.
Alternative Scenario (Temporary Pullback): A minor retracement to retest 3345–3355 resistance before continuing lower.
⚠️ Risk Management:
Watch for bullish reversal signals around 3300, as this level may attract strong buyers.
A breakout above 3370 would weaken the bearish bias and suggest short-term strength.
✅ Summary:
Gold remains bearish on the 4H chart, with sellers driving momentum toward the 3300 psychological level. Unless bulls step in aggressively, the downside remains the path of least resistance.

Gold Rises to 3339 – Awaiting Pullback to 3317📊 Market Overview
After dipping to 3326, gold rebounded sharply and reached 3339 in the latest session. The upside momentum came from safe-haven demand as the USD temporarily weakened. However, ahead of the Jackson Hole symposium, the market remains cautious with no clear trend established.
📉 Technical Analysis
• Key Resistance: 3338–3341 (fresh intraday top)
• Nearest Support: 3326–3328, deeper support at 3317 (major level)
• EMA: Price is trading above EMA9 on the H1 timeframe, indicating short-term bullish momentum still intact
• Candles & Momentum: Continuous bullish candles from 3326 → 3339, but limited volume suggests a potential pullback ahead
📌 Outlook
In the short term, gold is likely to face selling pressure near 3338–3341. A break below 3326 could open the way toward the key 3317 support zone for a retest of buyers’ strength.
💡 Suggested Trading Strategy
🔻 SELL XAU/USD at: 3338–3341
🎯 TP: 40/80/200 pips
🛑 SL: 3344
🔺 BUY XAU/USD at: 3317 - 3314
🎯 TP: 3332 / 3340
🛑 SL: 3311

XAUUSDHello Traders! 👋
What are your thoughts on GOLD?
Gold failed to break through the key resistance zone near the recent highs and got rejected. Additionally, the ascending trendline has been broken, with price now trading below it.
While the long-term outlook remains bullish, the short-term bias has shifted to bearish, and we expect further downside toward the next support levels.
Don’t forget to like and share your thoughts in the comments! ❤️

$3,331 Support Under Siege — Is Gold About to Crash?Price has been trending lower since the left side of the chart, shifting from a distribution top into a sequence of lower highs and lower lows. After the failed rally into the mid-chart, sellers re-asserted control and the market is now compressing under a local supply shelf. The last several candles hover around ~3,338 with shallow bounces and repeated rejections—typical of a market leaning heavy into support rather than springing from it.
The key battleground is the 3,331 zone (two green dotted prints around 3,331.17 / 3,329.85). It has acted as a base multiple times, but every touch is coming from lower highs, which increases the odds of a breakdown. Beneath that, a clean air pocket runs to 3,301.28–3,301.77 (next green level), and if momentum extends, the measured downside points toward 3,268.12 at the bottom of your map. On the topside, supply stacks up tightly: intraday cap at 3,355.98–3,360.00, then higher resistance shelves at 3,374.81, 3,390.60, and 3,409.43 (all marked with red dotted lines). The clustering of red “S” markers around the 3,355–3,375 area reinforces that zone as distribution/sell interest.
Market structure confirms the bearish bias: each rally attempt is getting sold earlier (progressively lower swing highs near ~3,360 → ~3,350), while the base at 3,331 is getting probed more often. That’s classic compression into support. The small-bodied candles near current price show lack of aggressive buying; wicks on the upside into ~3,345–3,355 keep getting faded. The green “B” markers that appeared on recent dips have not driven a higher high, which weakens their signal and suggests they’re catching falling knives inside a down-structure.
A quick invalidation map helps frame risk: any 1H close back above 3,360 would neutralize the immediate short idea and expose a squeeze toward 3,374.8, and only then would 3,390.6 → 3,409.4 come back into play. Until that reclaim, the path of least resistance remains down, with liquidity likely resting below 3,329–3,331.
Trade Setup (bearish)
• Option A — Breakdown Play: Sell the decisive break and 1H close below 3,331, or short a retest of 3,331–3,334 from underneath. Stop: above 3,356–3,360 supply. Targets: 3,301 first, stretch to 3,268 if momentum persists.
• Option B — Fade the Rally: If price bounces into 3,352–3,360 supply, look for rejection wicks to short. Stop: above 3,374.8 (next resistance shelf). Targets: 3,331 initial, then 3,301; leave a runner toward 3,268.
Risk notes: avoid chasing the very first tick below 3,331—gold often does a quick sweep before the real move. If a sweep below 3,331 snaps back inside the range and closes above the level, step aside; that’s a trap. Once the first target is hit, consider taking partial profits and trail the stop above the most recent 1H lower high to stay aligned with the down-trend. Economic calendar icons on the chart suggest upcoming USD events—expect spikes; keep sizing modest until after prints.

Another opportunity to sell gold Market is now ranging in a bearish pennant/ flag and price is expected to breakout and continue selling after making the classic 5 touch in these kinds of patterns

Gold Breaks $3,352 Support – Further Downside Risk📊 Market Overview:
• Spot gold is now trading at $3,352–3,356/oz, sliding sharply on profit-taking and uncertainty over potential U.S. import tariffs on gold.
• Weak buying interest at support pushed the price below the 200-hour MA, opening the door for deeper declines.
📉 Technical Analysis:
• Key resistance: $3,360–$3,365
• Nearest support: $3,345; next at $3,330
• EMA 09: Price remains below EMA09 → short-term trend is bearish
• Momentum: RSI below 45, sellers maintain control
📌 Outlook:
• Gold may continue to decline toward $3,345 or $3,330 if the H1 candle closes below $3,350.
• Only a break back above $3,365 with strong volume could trigger a short-term reversal.
💡 Suggested Trading Strategy:
SELL XAU/USD: $3,362–3,365
🎯 TP: 40/80/200 pips
❌ SL: $3,368
BUY XAU/USD: $3,345–$3,348 (only if clear bullish reversal candlestick forms)
🎯 TP: 40/80/200 pips
❌ SL: $3,342

Gold Technical Analysis - Bearish Bias Below $3,384Gold is currently trading near $3,373 within an ascending channel but showing signs of weakness. A rejection near the $3,384–$3,390 resistance zone could trigger a downside move toward key supports at $3,350, $3,338, and $3,326. If price breaks below the channel midline, bearish momentum may strengthen. However, a bounce from support could push gold back toward the upper range. Keep an eye on breakout zones for the next move.
🔑 Key Levels to Watch
- Resistance: $3,384 → $3,390: Strong resistance zone
- Support: $3,350 → $3,338 → $3,326
- Breakout Zones: Below $3,338: Opens room to $3,310 and below. Above $3,390: May lead to fresh highs toward $3,410+
🧭 Trend Outlook
- Short-Term: Bearish bias within the ascending channel, especially if price breaks below mid-channel.
- Medium-Term: Neutral to bullish as long as the lower channel trendline holds.
- Momentum: Losing bullish momentum; potential for downside correction.
Price is at a decision point within the ascending channel. A clean break below the mid-channel and $3,365 area can accelerate downside correction. Stay alert to key support zones and any reversal signals.
Note
Please risk management in trading is a Key so use your money accordingly. If you like the idea then please like and boost. Thank you and Good Luck!

XAUUSD Gold Intraday Analysis 11.08.2025Price has recently broken below the ascending trendline and is currently trading beneath a key supply zone between 3375–3380. After the trendline break, the market has shown a strong bearish impulse followed by consolidation, suggesting potential continuation to the downside.
If price retraces back into the 3375–3380 area and shows clear signs of rejection (such as bearish engulfing, rejection wicks, or lower time frame structure shift), I will be looking for short entries with a target towards the next demand zone around 3345.
Trade Setup:
Sell Limit: 3375–3380 (upon rejection confirmations)
Stop Loss: Above 3385
Take Profit: 3365/3355/3345
This setup provides a favorable risk-to-reward opportunity, aligning with the current bearish structure after the break of trendline support.
Always follow proper risk management and wait for confirmation before entering.

Gold explosion will be short livedThe price explosion in gold is solely due to the tariffs.
I don’t even want to go into detail about what impact this will have on the USA. I’ll just say this much: I feel sorry for the American people, and it’s not their fault.
And here, once again, we see the universal law of physics inherent in Median Lines/Forks at work. Right at the center line, the price will pull back and may drift toward the lower median line parallel, should the close occur below the center line.
It seems as though the basic rules of arithmetic are a foreign concept to those in leadership. There is a belief that billions of dollars will now suddenly flow into the U.S. Treasury overnight — which is, of course, complete nonsense. If that were truly the case, the price of gold in London would have risen in step with the U.S. gold price.
Instead, this madness will unfold as yet another act of monumental miscalculation, spreading across the U.S. economy and cementing the debt ledger as if it were the stone tablet of the Ten Commandments.
Let us see what our Median Line/Fork framework will reveal over the coming days.
…and I keep the world in my prayers, that peace may find its way into our thoughts.

XAUUSD Gold Intraday 07 Aug (Short) XAUUSD Intraday Setup
Short Setup in between 3382–3392 Resistance
Price is approaching a key supply zone between 3382 and 3392, where previous equal highs were swept. This area may act as a reversal zone.
Looking for bearish confirmation within this range to initiate short positions.
Stop Loss: 3397
Target: Previous swing lows around 3352–3355
Bearish bias remains valid as long as price stays below 3397.

The bullish outlook remains unchanged, go long with the trend!Yesterday, the gold bulls refreshed the high point, and the daily line closed in the form of a medium-sized Yang line with a long lower shadow. The idea of continuing to be bullish in the short term remains unchanged, and what needs to be paid attention to is the strength of the retracement, which is similar to yesterday. The current support below is maintained at the 3355-3350 line of yesterday's rise. This position is also today's key support level, and the key suppression point above is maintained at the integer level of 3390-3400. This position may not be the end point. It was also mentioned yesterday that under the range of the previous large range of fluctuations, if either side does not break through, it will likely continue to fall into fluctuations. The current bullish trend is still relatively obvious, so we still maintain the idea of low-long operations. If your current operation is not ideal, I hope I can help your investment avoid detours. Welcome to communicate!
From the 4-hour analysis, the important support below is the 3355-3350 line. If the daily level stabilizes above this position, the bullish rhythm of falling back to lows and buying on the trend will remain unchanged. Before the daily level falls below the 3350 mark, you need to be cautious about shorting against the trend. I will provide you with the specific operation strategies at the bottom, please pay attention to them in time.
Gold operation strategy: Go long on gold when it retraces to around 3360-3350, target 3375-3385 area, and continue to hold if it breaks through.

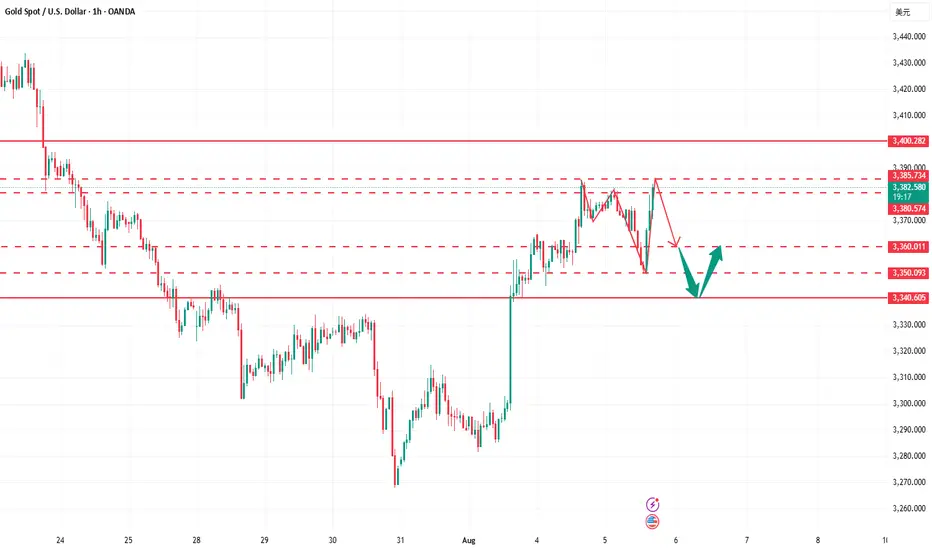
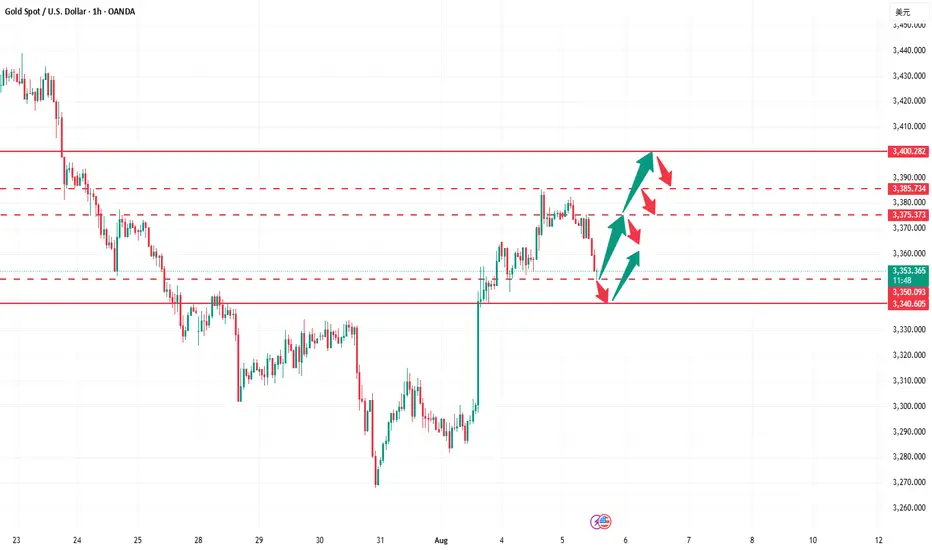
Gold XAUUSD Analysis 06.08.2025Entry: 3373–3378 (on retracement into 1H supply zone)
Stop Loss: 3385 (above recent swing high)
Take Profit: 3352 (targeting previous low / 1H demand)
Bias: BearishRRR: ~2.5:1
Analysis:
Price showed strong rejection from the 3373–3378 supply zone. Expecting a pullback into this area before continuation lower. Bearish structure remains intact with clean lower highs. Plan is to sell the retracement, with SL above 3385. Targeting 3352, which aligns with prior demand and liquidity.
Kindly show support by following liking and commenting your favourite pair for analysis.

The shot at the critical moment is the real trading opportunityGold bottomed out and rebounded yesterday, breaking the high slightly to touch 3390 before falling back. The daily line closed with a small bullish cross overnight, and the upward momentum has slowed down. Today it tends to fluctuate at a high level. In the 4H cycle, the Bollinger band is closing, and the overall bulls continue to run upward. The big positive line directly pulls up, which is relatively strong. The overall market is resistant to declines. Therefore, the big cycle does not expect a big drop for the time being, but the short-term trend fails to continue further. It is safe to maintain a pullback and go long. Pay attention to the support below 3365-3350. Go long after it stabilizes. First look at yesterday's high of 3390. If it breaks, there is a probability of going to 3400 or even around 3415, but be careful of a high rush and fall.

What does it matter if every step is just right?Today's gold fluctuation rhythm is basically consistent with our prediction. The rhythm from entry to profit-taking is clear, and the strategy is executed decisively. First, we decisively arranged long orders at the 3365-3370 line, and successfully took profit at the target line 3375, earning 150pips of profit. Then we decisively reversed and arranged short orders at 3375. The market fell back to around 3360 as expected, and realized 150pips of profit again. In the third round of operations, long orders were entered again near 3352, and the price rose smoothly to 3370 to take profit again. The overall rhythm was tight and profits were steadily pocketed. At present, gold has rebounded to around 3380-3385. We have deployed a new round of short orders in advance and will wait for the price to drop before arranging long orders. Overall, gold is in a volatile rhythm. Even if there is still room for upward movement in the future, it is likely to undergo a round of technical retracement adjustments first.
In gold trading, timing is key!Gold has currently reached a high of around 3385. The technical retracement and correction is also an affirmation of the bulls, and the current support below will continue to move up. From the perspective of the large range of the daily line, there is no large unilateral trend, and the overall box consolidation pattern has been formed. It once rose to 3385 yesterday, but failed to stand firm, indicating that the pressure from above is still quite large. If it can break through 3400, the next target may be 3430; otherwise, it may start a round of deep adjustment. There is a need for technical adjustment, so it is not advisable to chase the rise too much. If your current operation is not ideal, I hope I can help you avoid detours in your investment. Welcome to communicate with us!
Judging from the structure of the 4-hour gold chart, the key support area below is around 3350-3340. If it falls back to this area and stabilizes during the day, you can continue to rely on this area to arrange long orders. The overall bullish thinking remains unchanged. The short-term resistance above is around 3375-3385. If it breaks through, it will further test the key suppression zone of 3390-3400. I will prompt the specific operation strategy at the bottom. I suggest you keep paying attention and follow up in time.
Gold operation strategy: Go long when gold falls back to around 3350-3340, with the target at 3370-3380.
How to seize the best entry point for gold?Gold continued its bullish trend from last Friday, rising to a high of 3385 yesterday. However, the upward momentum failed to sustain, and new highs were not reached during today's Asian and European trading sessions. The short-term bullish trend has ended, and the market is showing signs of correction. Currently, gold is facing downward pressure in the short term, and the short-term trend is volatile. Strategically, we can watch for a rebound to the 3375-3385 area during the European trading session and try to participate in short-term short selling. The target is below 3365-3355. The long-term structure remains bullish. Therefore, if the price falls back to the 3355-3340 area and stabilizes, we can still consider entering long positions to continue the medium-term uptrend. In terms of trading, we should pay attention to the rhythm of the market, betting on rebound resistance with short-term short positions and then going long on dips, maintaining flexibility.

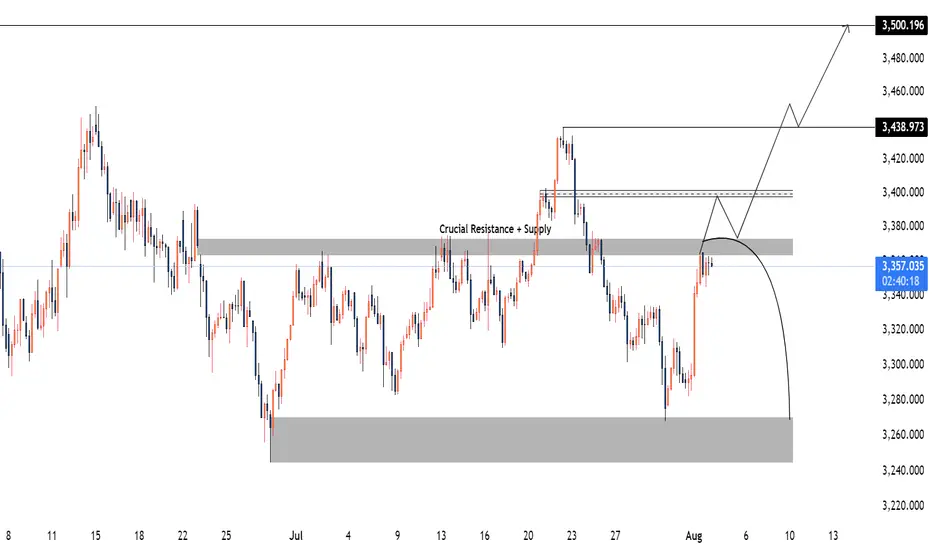
Gold XAUUSD Weekly Analysis 4-8 August 2025XAUUSD Weekly Outlook (SWING)
Price is currently approaching a crucial resistance and supply zone between 3363 – 3373. This area has historically acted as a strong rejection point and remains a significant decision level for upcoming market direction.
Bullish Scenario:
If price breaks and closes above the 3363–3373 zone and later retests it successfully—potentially around the 3400 level—this would indicate a bullish market structure shift. A strong reaction from the retest could open the path toward 3438, with a possible extension to 3500.
Bearish Scenario:
Alternatively, a rejection from the 3363–3373 supply zone without a confirmed breakout would likely trigger a downside move, targeting the lower demand area near 3250.
This 3363–3373 zone remains the key pivot. Watch for price action confirmation to validate either scenario.