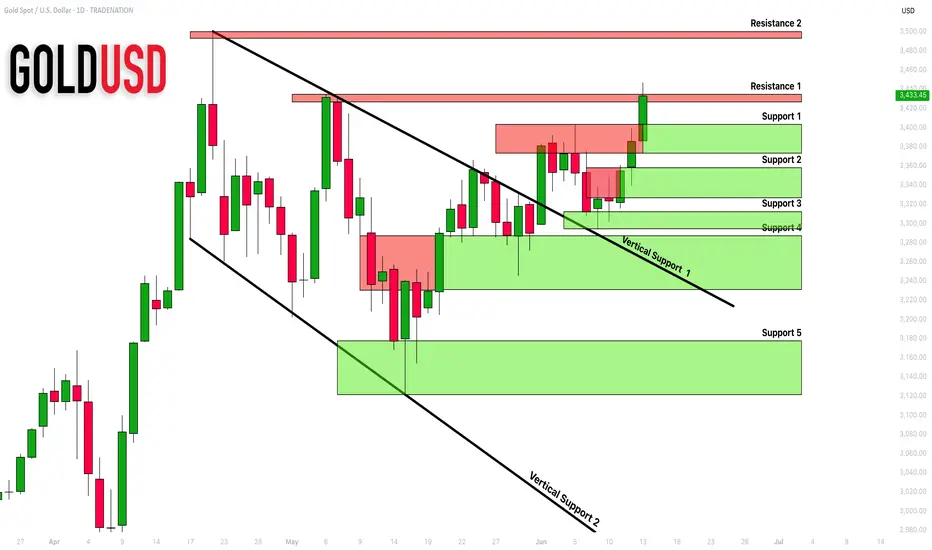
GOLD (XAUUSD): Support & Resistance Analysis For Next Week
Here is my latest structure analysis and
important supports & resistances for GOLD XAUUSD
for next week.
Consider these structures for pullback/breakout trading.
❤️Please, support my work with like, thank you!❤️
I am part of Trade Nation's Influencer program and receive a monthly fee for using their TradingView charts in my analysis.
Goldsignals
Gold Extends Rally as New High Emerges📊 Market Overview:
Gold reached a new intraday high at $3,447 today, supported by a weaker USD and stable U.S. Treasury yields. Prices then pulled back slightly to $3,423 amid short-term profit-taking. Ongoing geopolitical uncertainty and expectations that the Fed may hold or cut rates continue to drive demand for safe-haven assets like gold.
📉 Technical Analysis:
Key Resistance Levels:
• $3,447 – Intraday high on June 13
• $3,465 – Strong Fibonacci extension resistance
• $3,480 – Next upside target if price breaks above $3,447
Key Support Levels:
• $3,423 – Current price and intraday congestion zone
• $3,410 – Minor support on the H4 chart
• $3,400 – Psychological support & 20-day MA
• EMA: Price is trading above the 09-day EMA → short-term trend remains bullish
• Candlestick / Volume / Momentum:
Strong bullish candle with high volume; RSI at 67 indicates further upside potential. Short lower wicks suggest limited selling pressure. MACD on both H4 and daily charts favors continued upside momentum.
📌 Outlook:
Gold is likely to continue rising if it holds the $3,410–$3,423 support zone. A break above $3,447 may open the path toward $3,480 or higher.
💡 Suggested Trading Strategy:
🔺 BUY XAU/USD:
• Entry: $3,420 – $3,425
• 🎯 TP: $3,480
• ❌ SL: $3,408
🔻 SELL XAU/USD
• Entry: $3,445 – $3,450
• 🎯 TP: $3,423 – $3,410
• ❌ SL: $3,457

"XAU/USD Bearish Setup: Rising Channel Breakdown AnticipatedPrevious Resistance Zone (Red Rectangle):
The chart shows a clear resistance zone between ~3,340 and ~3,370 USD.
Price was rejected sharply from this zone earlier (marked by the large blue dot at the swing high).
Current Rising Channel (Blue Channel):
A rising wedge or ascending channel is forming, typically a bearish continuation pattern when found in a downtrend.
Price is currently testing the upper boundary of this pattern.
Bearish Projection (Red Path & Arrows):
The chart creator expects a rejection from the top of the channel, leading to a breakdown and a move toward the next key support at ~3,246.94 USD.
A large red arrow and projected box highlight the short setup zone with an implied favorable risk/reward ratio.
Support Target:
Blue horizontal line at 3,246.94 marks the next significant support level, likely a take-profit target for short sellers.
Macro Factors:
Three small icons indicate upcoming U.S. economic events, possibly influencing XAU/USD volatility and confirming the move.
✅ Summary:
Bias: Bearish
Pattern: Rising Channel (bearish structure)
Entry Zone: Around 3,350–3,360 USD (top of channel)
Target Zone: ~3,246 USD
Risk: Invalid if price closes strongly above the resistance zone (~3,370 USD)

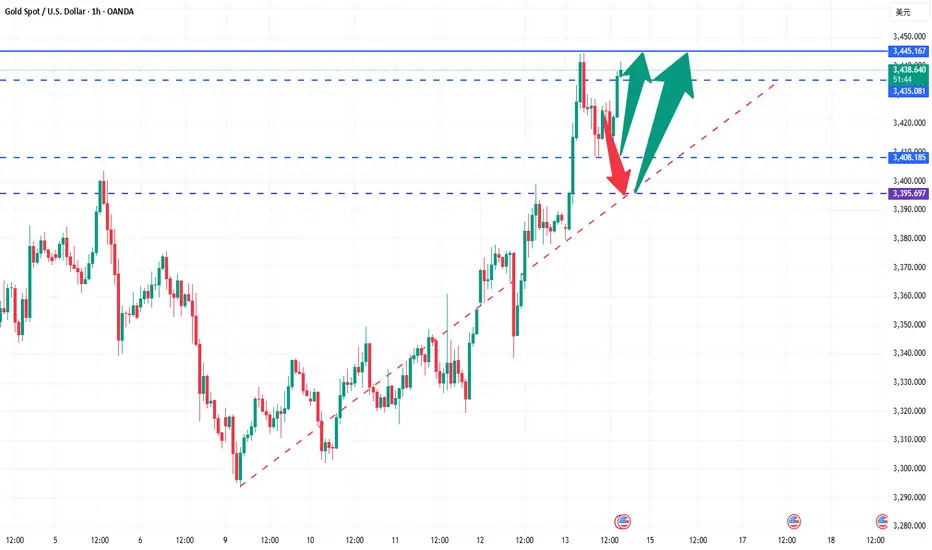
Bulls are in control, and pullbacks are opportunities!Gold rose directly at the opening today due to risk aversion, reaching a high of around 3446.8. We successfully stopped profit twice when we went long. Subsequently, we also notified everyone to enter short positions at 3445 and exit with profit at 3425. Pay attention to the support situation at 3395-3408. Going long on pullbacks is still the main trend at present.
From the current gold trend analysis, today's gold mid-line pulled up and broke through and stood above the 3400 mark to further continue its strength. The short-term support below is around 3310-3408, and the key support below is around the recent top and bottom conversion position of 3395-3405. The intraday pullback relies on this position to continue to be bullish and the short-term bullish dividing line moves up to 3345-3350. The daily level stabilizes above this position and continues to maintain the trend of low-long rhythm. Be cautious about short orders against the trend. I will give you tips on specific operations, and pay attention in time.
Gold operation strategy: Buy gold when it falls back to around 3395-3405, and target around 3425-3440. If it is strong, continue to buy gold at the support of 3410-3408.
When operating, be sure to strictly set stop loss, strictly control risks, and respond to market fluctuations steadily.

Hit the target with one strike! Gold perfectly cashed in 3435Gold closed sideways at a high level yesterday, and closed positive again overnight. It opened back to 3379 and pulled up strongly, breaking through the 3400 mark and then increasing in volume. The recent low-multiple bullish ideas have been realized. There is no doubt that it will continue to be bullish and long today. The market has turned from the previous sweeping upward to a strong unilateral trend. The upper side will first look at the previous high pressure of 3435. Continued breakthrough will further open up the upper space, or it will hit 3500 or even a new high again. The lower support focuses on the top and bottom conversion position of 3395-3405, and then pay attention to the 1H cycle support near 3410. The intraday operation is mainly long on the decline.
Operation suggestion: Go long on gold when it falls back to 3395-3345, and look at 3434 and 3450. If it is strong, continue to go long with the support of 3415-3410.
When operating, be sure to strictly set stop loss, strictly control risks, and respond to market fluctuations steadily.
After the Pullback, Gold May Head Toward the 3500 Mark📊 Market Overview:
Gold surged to 3444 during the Asian session on rising expectations of an early Fed rate cut after softer-than-expected US CPI data. However, profit-taking pushed prices back to the 3425 zone.
📉 Technical Analysis:
• Key Resistance: 3444
• Nearest Support: 3403 – 3406
• EMA 9: Price remains above EMA 9 → trend is still bullish.
• Momentum & RSI: RSI has cooled off from near-overbought territory (~70), suggesting a short-term pullback may occur.
📌 Outlook:
Gold may correct slightly toward support before resuming its upward trend if the 3403–3406 zone holds firm.
💡 Suggested Trading Strategy:
🔻 SELL XAU/USD at: 3440 – 3444
🎯 TP: 3420
❌ SL: 3449
🔺 BUY XAU/USD at: 3406 – 3403
🎯 TP: 3426
❌ SL: 3399

GOLD (XAUUSD): Waiting For Another Breakout
Following the latest news, I think you would agree with me that
Gold will most likely rise more.
Your technical confirmation can be a bullish breakout of the underlined
blue resistance and a daily candle close above 3435.
It will be an important trigger that will push the prices way up to a current ATH.
❤️Please, support my work with like, thank you!❤️
I am part of Trade Nation's Influencer program and receive a monthly fee for using their TradingView charts in my analysis.

The summit is just around the corner, just one final push away!Gold closed sideways at a high level yesterday, and closed positive again overnight. It opened back to 3379 and pulled up strongly, breaking through the 3400 mark and then increasing in volume. The recent low-multiple bullish ideas have been realized. Today, there is no doubt that it will continue to be bullish and long. The market has turned from the previous sweeping upward to a strong unilateral trend. The upper side will first look at the previous high pressure of 3435. Continued breakthrough will further open up the upper space, or it will hit 3500 or even a new high again. The lower support focuses on the top and bottom conversion position of 3395-3405, and then pay attention to the 1H cycle support near 3410. Intraday operations are still mainly based on falling back and long.
Operation suggestion: Go long when gold falls back to 3395-3345, and look at 3434 and 3450. If it is strong, continue to go long with the support of 3415-3410.

XAUUSD Analysis todayHello traders, this is a complete multiple timeframe analysis of this pair. We see could find significant trading opportunities as per analysis upon price action confirmation we may take this trade. Smash the like button if you find value in this analysis and drop a comment if you have any questions or let me know which pair to cover in my next analysis.

GOLD ANALYSIS BULLISH 13 JUNE 2025
As per previous analysis gold moved in the way as I was expecting. Gold is still strongly bullish, this is all due to geopolitics Iran and Israel war. As #gold made high to 3444 also took correction and now continue to it's bullish rally. Due to this war gold may surge to new high, for today I am again expecting to break yesterdays high. I will recommend please don't trade when there is such war and geopolitics issues because this is just analysis but market behavior is not normal and it will move in unwanted direction. Plan your trade accordingly and do trade. Key points 3402, 3415, 3424, 3440.
Comment and like for analysis. Love it then follow
Any Query Reach Us or comment down.
Follow for more updates.
Rudra Vasaikar Wishes You A Great And Very Amazing Trading Life. Trade Safe, Trade Right.
RISK WARNING 🔴 🔴 🔴
There is high risk of loss in Trading Forex, Crypto, Indices, CFDs, Features and Stocks. Choose your trade wisely and confidently, please see if such trading is appropriate for you or not. Past performance is not indicative of future results. Highly recommended - Information provided by Pro Trading Point are for Educational purpose only. Do your investment according to your own risk. Any type of loss is not our responsibility.
HAPPY TRADING.
#gold #xauusd #xauusdtrading #goldtrading #goldanalysis #forextrading #forex #trendline #goldsignals #goldnews goldlatestanalysis #xauusdtradesetup #forextradingguide #fxgold
beyong technical analysis, chart patterns, gold, goldanalysis, goldideas, goldlong, goldsignals, goldlatestanalysis, goldtrading, goldtradingview, technical indicators, xauusdanalysis,

Gold May See Minor Pullback After Testing $3400📊 Market Development:
Gold surged to approach the $3,400 mark after U.S. Unemployment Claims came in higher than expected. The weak labor data increased speculation of an earlier rate cut by the Fed, pressuring the USD and bond yields, which in turn supported gold prices.
📉 Technical Analysis:
• Key Resistance: $3,400
• Nearest Support: $3,365
• EMA: Price remains above EMA 09 → bullish bias intact
• Candle/Volume/Momentum: Long upper wick on H1 suggests profit-taking near $3,400; declining volume may signal weakening momentum.
📌 Outlook:
Gold may experience a short-term pullback if it fails to break above $3,400 and the USD strengthens in the New York session.
💡 Suggested Trade Setup:
🔻 SELL XAU/USD at: $3,395–$3,400
🎯 TP: $3,375
❌ SL: $3,406
🔺 BUY XAU/USD at: $3,365–$3,370
🎯 TP: $3,390
❌ SL: $3,355

Accurately capture golden trading opportunitiesBased on the current trend, it is recommended to focus on low-long operations, but be wary of the market repeating the pattern of the previous few days of high-rush, wash-out and fall. From the perspective of key points, 3360 has been converted from a previous resistance level to a support level. At the same time, the hourly line forms an important support near 3358. If there is a stabilization signal at this position, it can be regarded as a good opportunity to go long. However, if the market falls below the 3356 line, it is not ruled out that the price will further fall to around 3345. This position is the key long-short watershed during the day. Once it is lost, the short-selling force may increase; in extreme cases, if there is a deep wash-out, the gold price may even pull back to 3325. For the upper resistance, pay attention to 3395-3405 first. If it can break strongly, it can further look to 3414.
Based on the above analysis, the trading strategy is as follows:
If gold falls back to the area near 3345-3355 and does not break, you can consider arranging long orders;
When the price rises to the area near 3395-3405 and does not break, you can try to arrange short orders.
When operating, be sure to strictly set stop losses and control risks.
Today's market trend is completely in line with the predicted rhythm, with a clear shock structure and flexible response around key points. With precise layout based on two-way thinking, we can achieve a double kill of long and short positions and a steady harvest. If your current gold operation is not ideal, and we hope to help you avoid detours in your investment, please feel free to communicate with us!

Gold Correction = Bearish Divergence + Wedge + Zigzag CompleteGold ( OANDA:XAUUSD ) attacked the Resistance zone($3,387-$3,357) today after the release of the US CPI indices . Although the figures seemed to be in gold's favor, traders still seem to be determined to continue the price correction.
In terms of Elliott Wave theory , it seems that Gold has managed to complete the Zigzag Correction. We should wait for the next 5 down waves .
Also, we can see the Regular Divergence(RD-) between Consecutive Peaks .
In terms of Classic Technical Analysis , Gold appears to have successfully formed a Rising Wedge Pattern .
I expect Gold to drop to at least $3,296 AFTER breaking the lower line of the Rising Wedge Pattern .
Note: Stop Loss(SL)= $3,380
Gold Analyze ( XAUUSD ), 1-hour time frame.
Be sure to follow the updated ideas.
Do not forget to put a Stop loss for your positions (For every position you want to open).
Please follow your strategy; this is just my idea, and I will gladly see your ideas in this post.
Please do not forget the ✅' like '✅ button 🙏😊 & Share it with your friends; thanks, and Trade safe.

Gold (XAUUSD) Eyes 3,330 Zone as Safe-Haven Demand Builds!!Hey Traders, In today’s trading session, we’re keeping a close watch on XAUUSD for a potential buying opportunity around the 3,330 zone. Gold continues to trade within a strong uptrend, and is currently undergoing a healthy correction, bringing it near a key support/resistance level that could act as a springboard for the next leg higher.
From a fundamental perspective, rising geopolitical tensions in the Middle East have led to the evacuation of diplomatic personnel and increasing concerns of potential military escalation. As uncertainty grows, safe-haven assets like gold tend to attract stronger demand from investors seeking protection against volatility and risk.
If the situation deteriorates further, we could see a surge in gold prices as market participants hedge against geopolitical instability.
Trade safe,
Joe

Go with the flow and seize the gold trading opportunityGold rose and fell yesterday due to the influence of CPI data, and fluctuated violently during the session. There were obvious signs of a wash. In the evening, it rose again driven by the news, closed positive on the daily line, continued its strong upward trend at the opening and set a new high, showing an obvious bullish pattern. The overall structure maintains the bullish idea of low-long and trend-following.
From the 4H cycle, gold rose continuously after stepping back and stabilizing the middle track. The moving average system showed a bullish arrangement, and the Bollinger band opened and expanded, further confirming the continuation of the strong pattern. However, the current price is still running within the triangle convergence range, and has not yet effectively broken. It is not advisable to blindly chase more in the short term.
In terms of operation, it is recommended to take the step back and do more. Pay attention to the short-term support below the 3360-3358 range, and focus on the 3350-3340 range. You can rely on the support to arrange long orders in batches. Pay attention to the 3389 and 3400 areas on the upper short-term pressure. If the high is weak, you can try short-selling in combination with the actual trend.
Operation suggestion: It is recommended to buy gold near 3340-3350, and the target is 3366 and 3382. If it is strong, it is recommended to buy gold at the support of 3358-3360!
All recent trading strategies and ideas have been realized, and the point predictions are accurate. If your current gold operation is not ideal, we hope to help you avoid detours in your investment. Welcome to communicate with us!

Gold Extends Gains, Eyes 3400📊 Market Overview
• Following softer-than-expected US CPI data, gold surged strongly.
• This morning, gold touched a high of 3377 before pulling back slightly to around 3372.
• A weaker USD and growing expectations of Fed rate cuts remain key bullish drivers.
📉 Technical Analysis
• Key Resistance: $3,380 – $3,400
• Nearest Support: $3,325 – $3,310
• EMA09: Price remains above EMA09, signaling a short-term uptrend.
• Candlestick & Momentum: Gold has broken out of a consolidation zone with strong momentum, though short-term overbought signals are emerging.
📌 Outlook
Gold may enter a mild pullback within the 3370–3380 zone before finding fresh momentum from upcoming Fed signals or macro data. Caution is advised when trading near major resistance.
💡 Trading Strategy
🔻 SELL XAU/USD at: 3375–3377
🎯 TP: 3355
❌ SL: 3385
🔺 BUY XAU/USD at: 3325–3330
🎯 TP: 3350
❌ SL: 3315

GOLD IS MOVING UPWARD.#xauusd #gold
Hello friends, very busy this days and also no well, had little health issue. But I was watching gold closely in that days too, caught some great moves. In previous analysis I mentioned gold will move upward, unfortunately gold breaked the pattern and moved down to 3394 after that we see again upward movement started. Again a bearish flag pattern is formed but due to tension in geopolitics gold is strongly bullish also yesterday was CPI news where dollar news was negative and dollar move down due to which gold pushed upward. Today gold opening was in gap in upward.
Today I am expecting to move upward and later on it will definitely come down to fill the gap near 3355. So our main target is now 3380-3391-3402.
Comment and like for analysis. Love it then follow
Any Query Reach Us or comment down.
Follow for more updates.
Rudra Vasaikar Wishes You A Great And Very Amazing Trading Life. Trade Safe, Trade Right.
RISK WARNING 🔴 🔴 🔴
There is high risk of loss in Trading Forex, Crypto, Indices, CFDs, Features and Stocks. Choose your trade wisely and confidently, please see if such trading is appropriate for you or not. Past performance is not indicative of future results. Highly recommended - Information provided by Pro Trading Point are for Educational purpose only. Do your investment according to your own risk. Any type of loss is not our responsibility.
HAPPY TRADING.
#gold #xauusd #xauusdtrading #goldtrading #goldanalysis #forextrading #forex #trendline #goldsignals #goldnews goldlatestanalysis #xauusdtradesetup #forextradingguide #fxgold
beyong technical analysis, chart patterns, gold, goldanalysis, goldideas, goldlong, goldsignals, goldlatestanalysis, goldtrading, goldtradingview, technical indicators, xauusdanalysis,

Gold Consolidates Around $3,340–Mild Bullish Bias Ahead CPI Data📊 Market Summary
Gold is consolidating around $3,340/oz, up about 0.5% today, as investors seek safe-haven assets amid ongoing US–China trade tensions. The market is also closely watching the upcoming U.S. CPI data release.
📉 Technical Analysis
Key Resistance:
• $3,350–3,360 – recent swing highs, aligning with the intraday EMA50 and Fibonacci resistance.
• $3,370–3,380 – major monthly high, potential breakout zone.
Nearest Support:
• $3,320–3,330 – EMA20–21 zone, daily support and key pivot level.
• Below $3,320, next support lies near $3,300.
EMA 09:
• Price is trading above EMA9 but still below EMA21–50 → suggests neutral-to-slightly bullish intraday bias.
Candlesticks / Volume / Momentum:
• Small-bodied candles with low volume → signs of sideways movement.
• RSI on H1 ~60, H4 ~55 → modest upward momentum, not yet overbought.
📌 Outlook
Gold is likely to continue consolidating around $3,340, with mild upside potential if the U.S. CPI data comes in hot or trade talks remain inconclusive.
💡 Suggested Trading Strategy
SELL XAU/USD at: $3,350–3,355
🎯 TP: $3,330–3,335
❌ SL: $3,360
BUY XAU/USD at: $3,320–3,330
🎯 TP: $3,340–3,345
❌ SL: $3,310

The gold trend is perfectly in line with expectations.The recent trend of gold is consistent with my expectations. Overall, the rebound is mainly based on fluctuating downward, and the rhythm of the oscillation between long and short positions is perfectly grasped. The upper resistance is still strong, and gold can still be shorted if the rebound is not broken.
From the current analysis of the gold trend, the lower support focuses on the area around 3315-3305. If it falls back to this position range, continue to look at the continuation of the rebound upward; the upper resistance focuses on the area around 3350-3362. The overall rhythm of the high-altitude and low-multiple range is still maintained, and the strategy is mainly to participate in the range back and forth.
1. Go long when gold falls back to 3315-3305, and the target is 3330-3340;
2. Go short when gold rebounds to 3350-3360, and the target is 3340-3330.

Gold rebound is still a short-selling opportunityFirst of all, let's take a look at why the market is still not reversing after a big rise, and there is a rapid rise and fall?
The data is bullish, and gold is rising rapidly, but we should pay attention to the sustainability of the rise, and secondly, the current trend direction. The overall trend of gold is still fluctuating downward recently, so even if the data is bullish, it is likely to just give an opportunity to "go high and short".
Although gold performed strongly after the data was released, it began to fall under pressure at the 3360 line, the trading concentration area of the last box shock, indicating that the bulls' volume is still not enough to break through the upper resistance. It is reasonable to rise and fall.
Since gold is currently in a market that is tempting to buy more, it means that the main trend is still bearish. The rebound is still dominated by short selling. The gold 1-hour cycle closed with a long upper shadow, indicating that the upward attack is weak, indicating that the area above 3350 is still a strong pressure area. This upward rush is just a short-term effort with the help of data benefits, which is a typical false breakthrough. Therefore, gold rebounded to the 3350-3360 area in the US market, and it is still dominated by high shorts.
This is the charm of the market - some people are always hesitant in the ups and downs, while others can always grasp the key turning points. The premise is to be able to see the trend clearly and follow the trend.
Don't be led by the market, but understand: Is the current fluctuation a trap or an opportunity?
If the direction is wrong, the effort will be in vain; if the direction is right, you will get twice the result with half the effort.
Don't make excuses for failure, just find ways to succeed. Have you found it?
All recent trading strategies and ideas have been realized, and the point predictions are accurate. If your current gold operation is not ideal, we hope to help you avoid detours in your investment. Welcome to communicate with us!

XAUUSD Top-down analysis Hello traders, this is a complete multiple timeframe analysis of this pair. We see could find significant trading opportunities as per analysis upon price action confirmation we may take this trade. Smash the like button if you find value in this analysis and drop a comment if you have any questions or let me know which pair to cover in my next analysis.

Gold V-shaped reversal still has room to rise In the morning, the market was under pressure at 3328, and two consecutive big negative lines fell to the low of 3302, breaking through the lower track of the descending flag consolidation channel, forming an effective break. 3317 was originally the confirmation point of the channel counter-pressure, and it was also the 618 split resistance at the time. Then the middle track was lost, and the trend was bearish, so it tried to rebound but continued to fall under pressure.
But the market immediately made a V-shaped reversal, breaking through the morning high of 3328, and had attacked to 3342 before the US market. The European session was volatile and strong, and with the help of a pullback before and after the U.S. session to lure short sellers, there is still hope for a second rise
The focus of the support for the retracement is on two positions: one is the 3322 line, corresponding to the middle track and 50% split support; the other is 3318, corresponding to the 618 split support. If it stabilizes after touching it, it will most likely point to the 3348 counter-pressure position.
If the pressure of 3348 cannot be broken, there is still a possibility of repeated fluctuations in the short term. It is necessary to pay attention to whether the secondary low point appears when it pulls back to further consolidate the support structure. If the market directly breaks through and stands above 3348, 3293 may have been confirmed as a short-term low.
The recent trading strategy ideas are all realized, and all the points are predicted accurately. If your current gold operation is not ideal, I hope I can help you avoid detours in your investment. Welcome to communicate with us!

XAUUSD 200 pip FVG drop?XAUUSD Finally started to break below to the major direction of the trend. After crossing the daily high, price started to break below upon retest of the neck line of the 4H head and shoulder.
As the market has got rejected from daily resistance we see possible drop back to daily low or even test of the strong liquidity zone on the monthly support level.
Upon price action confirmation, a sell trade is high probable
