Gold Finds Support in PRZ – $3,337 in Sight? As I expected in my previous idea , Gold ( OANDA:XAUUSD ) moved towards the Support zone($3,280-$3,245) after breaking the lower line of the ascending channel.
Gold is moving near the Support zone($3,280-$3,245) , Potential Reversal Zone(PRZ) and Monthly Pivot Point .
In terms of Elliott Wave theory , Gold appears to be completing a main wave 4 . The structure of the main wave 4 can be complex . Confirmation of the end of the main wave 4 requires a break of the Resistance lines and Resistance zone($3,387-$3,357) .
I expect Gold to move up after entering the Potential Reversal Zone(PRZ) and the first target could be $3,314 and the second target could be $3,337 . If the momentum is high for Gold, you can consider higher targets for Gold to increase .
Note: If Gold touches $3,245 , we should expect further declines.
Gold Analyze ( XAUUSD ), 2-hour time frame.
Be sure to follow the updated ideas.
Do not forget to put a Stop loss for your positions (For every position you want to open).
Please follow your strategy; this is just my idea, and I will gladly see your ideas in this post.
Please do not forget the ✅' like '✅ button 🙏😊 & Share it with your friends; thanks, and Trade safe.
Goldsignals
Gold May Undergo Short-Term Correction Before Continuing Uptrend📊 Market Overview:
Gold prices are currently around $3,307/oz, up 0.5% on June 2, supported by safe-haven demand amid escalating geopolitical tensions and trade concerns. However, after reaching a peak of $3,500 in April, gold has corrected as market sentiment shifted towards riskier assets due to easing US-China trade tensions.
📉 Technical Analysis:
• Key Resistance: $3,325 – $3,350
• Nearest Support: $3,280 – $3,265
• EMA: Price is above EMA 09 → uptrend.
• Candlestick Patterns / Volume / Momentum: Gold is in a consolidation phase with a slight upward bias. Technical indicators like RSI(14) at 56.183 and MACD(12,26) signaling buy suggest continued upward momentum.
📌 Outlook:
Gold may experience a short-term correction if it fails to hold the $3,280 support level. However, the long-term trend remains positive if the price stays above EMA 09 and does not break key support.
💡 Suggested Trading Strategy:
SELL XAU/USD at: $3,325 – $3,330
🎯 TP: $3,305
❌ SL: $3,335
BUY XAU/USD at: $3,280
🎯 TP: $3,300
❌ SL: $3,270

Technical Analysis on XAU/USD (Gold vs USD) – Bullish Reversal📊 Chart Overview:
This chart of XAU/USD (Gold) on a lower timeframe shows a potential bullish reversal setup. The price action has formed a series of lower highs and lower lows, but now a bullish momentum is building up, suggesting a possible breakout to the upside.
🔍 Key Observations:
🟠 Swing Points Identified:
The orange circles mark significant swing highs and lows, clearly outlining a recent downtrend.
The latest swing low (bottom-right) shows a strong rejection with a bullish engulfing candle forming, indicating buyer interest.
📦 Demand Zone (Support Area):
The grey rectangle near the lower region marks a demand zone where buyers have stepped in before.
Price has reacted strongly from this zone again, validating it as a key support level.
📉 Resistance Turned Potential Breakout Zone:
The red line (~3,291.416) represents a resistance level that was previously support.
Price has broken above it and now appears to be retesting it, indicating a possible retest-confirmation for a bullish continuation.
🎯 Target & Risk Management:
✅ Entry: Confirmed breakout and retest around 3,291.
📈 Target: 3,364.819 (green zone above), based on previous resistance.
❌ Stop Loss: Below 3,267.772, the recent swing low.
The setup offers a favorable risk-to-reward ratio.
🧭 Projection Path:
The white arrowed path illustrates a likely pullback before continuation upward, suggesting a bullish structure if confirmed.
✅ Conclusion:
Gold is showing signs of a bullish reversal from a well-defined demand zone, with a potential rally toward the 3,365 area. A successful retest of the broken resistance as new support would strengthen the bullish bias.
📌 Watch closely for confirmation candles on the retest before entering.

XAUUSD Analysis todayHello traders, this is a complete multiple timeframe analysis of this pair. We see could find significant trading opportunities as per analysis upon price action confirmation we may take this trade. Smash the like button if you find value in this analysis and drop a comment if you have any questions or let me know which pair to cover in my next analysis.

Gold Analysis
Last week's movement so far on the chart moved as expected. To continue this week's path, expect another step to correct to two support areas, first the 3264-3255 range, and if lost to the support area 3265-3232. It can be considered that from one of these two supports, the upward movement for the liquidity above it will continue. The resistance/support areas will change their nature if lost.

GOLD (XAUUSD): Support : Resistance Analysis For Next Week
Here is my latest structure analysis and
important supports & resistances for Gold for next week.
Horizontal Structures
Support 1: 3238 - 3286 area
Support 2: 3122 - 3179 area
Support 3: 2957 - 2982 area
Resistance 1: 3353 - 3366 area
Resistance 2: 3427 - 3425 area
Resistance 3: 3483 - 3501 area
Vertical Structures
Vertical Support 1: falling trend line
Vertical Resistance 1: falling trend line
Consider these structures for pullback/breakout trading.
❤️Please, support my work with like, thank you!❤️
I am part of Trade Nation's Influencer program and receive a monthly fee for using their TradingView charts in my analysis.

GOLD AND WAR NEXT TO 4K$Hello traders
as i can see gold is trading in a Decending Triangle zone and it had tested Fibo 0.61 ratio in month of may dip as we can see gold close monthly candle above 3280 zone which is a clear sign that big players and banks are still prefer Safe haven we can see US econmey in a bad recession zone unemployment and higher inflation is a big problrm for $ and on all these things Mr. Trump Tariffs is a game changer in commodities markets if we see Geopolitical issues around the world it esculating more war in diffrent regions of the world.. Now Israiel & US have a new biggest problem Iran which is showing us a attack on Iran can be happen incoming days as we can see 6 meetings was unsucessful in Oman for a Deal to Stop Iran's Nucler Enrichment Program which is not good... other then fundamental Charts are crystal clear and showing us a clear view for a New ATH on Gold our Risk reward ratio is prefect for us have a proper research before taking any trade its just an trade idea share your thoughts with us it will help many other traders Comments are open we love your comments and support the channel so it can diliver to many other new traders Stay Tuned for new updates ..
Gold Declines as PCE Inflation Data Cools📊 Market Overview:
Gold is currently trading around $3,289/oz, down from the day's high of $3,322. This decline follows the U.S. PCE inflation data showing a 2.1% annual increase in April, below the forecast of 2.2% and March's 2.3%. Core PCE also rose 0.1% monthly and 2.5% annually, the lowest since early 2021.
📉 Technical Analysis:
• Key Resistance: $3,310 – $3,330
• Nearest Support: $3,270
• EMA: Price is currently below the 09 EMA, indicating a short-term downtrend.
• RSI Indicator: The RSI is declining, signaling increasing selling pressure.
• Candlestick Pattern: A bearish candlestick pattern has formed after failing to break above the $3,330 resistance zone.
📌 Outlook:
If gold fails to hold the $3,270 support level, it may continue to decline towards $3,250. However, maintaining above $3,270 could see a rebound towards the $3,300 – $3,310 range.
💡Suggested Trade Strategy:
SELL XAU/USD at: $3,310 – $3,315
🎯 TP: $3,290
❌ SL: $3,320
BUY XAU/USD at: $3,270
🎯 TP: $3,290
❌ SL: $3,260

Gold at Key Rejection Zone: Will the Drop Resume from $3310?By examining the gold chart on the 4-hour timeframe, we can see that after some consolidation between $3294 and $3302, the price finally began a sharp drop, correcting down to $3245. This area was a key demand zone on lower timeframes, which triggered a rebound, and gold is now trading around $3310. If the price gets rejected from the $3310–$3313 zone, we can expect another potential decline.
Please support me with your likes and comments to motivate me to share more analysis with you and share your opinion about the possible trend of this chart with me !
Best Regards , Arman Shaban

XAUUSD Analysis todayHello traders, this is a complete multiple timeframe analysis of this pair. We see could find significant trading opportunities as per analysis upon price action confirmation we may take this trade. Smash the like button if you find value in this analysis and drop a comment if you have any questions or let me know which pair to cover in my next analysis.

XAUUSD Bearish Signal | Technical + Custom AlgoSmart Trend Signal | Technical Analysis + Custom Algorithm
This signal is the result of a combination of classic technical trend analysis and a proprietary software I personally developed.

Is Gold’s Momentum Strong Enough to Break $3,400?📊 Market Overview:
Gold prices retreated slightly as stronger-than-expected U.S. consumer confidence data boosted expectations that the Federal Reserve may keep interest rates elevated for an extended period. This lent strength to the U.S. dollar, weighing on gold. Meanwhile, a more stable geopolitical tone—particularly in U.S.-EU trade discussions—has reduced safe-haven flows into gold.
📉 Technical Analysis:
• Key Resistance: $3,345 – $3,355
• Nearest Support: $3,270 – $3,280
📌 Outlook:
Gold may remain under pressure in the short term if the U.S. dollar stays firm and the Fed’s hawkish stance persists. However, the $3,270 support zone remains a key pivot for any potential rebound.
💡 Suggested Trading Strategy:
SELL XAU/USD at: $3,345 - $3,350
🎯 TP: $3,325
❌ SL: $3,355
BUY XAU/USD at: $3,270 – $3,280
🎯 TP: $3,290
❌ SL: $3,260

XAU/USD: Ready for another Decline? (READ THE CAPTION)By examining the #EURUSD chart on the 3-day timeframe, we can see that the price is currently trading around 1.132. If it manages to hold below 1.14, I expect further downside. The bearish targets are 1.12790, 1.11800, 1.10700, and 1.096 respectively.
Please support me with your likes and comments to motivate me to share more analysis with you and share your opinion about the possible trend of this chart with me !
Best Regards , Arman Shaban

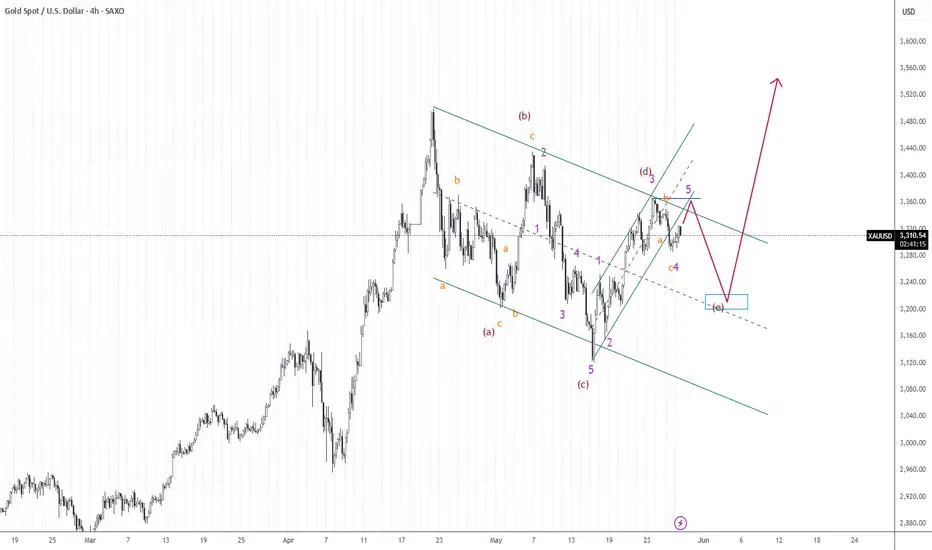
XAU/USD Elliott Wave Analysis: Gold Price Set for Drop to $3,240The chart for XAU/USD (Gold Spot vs. USD) on the 4-hour timeframe displays a potential Elliott Wave structure within a descending channel. The price recently completed a five-wave impulsive move upward, labeled as wave (d), suggesting a corrective move down to complete wave (e). A potential short-term entry point is identified near the top of the rising wedge at **\$3,360**, targeting a bearish pullback. The expected retracement may reach the **\$3,240–\$3,200** zone, where the (e) wave is projected to complete. This area aligns with the lower boundary of the corrective channel and prior structural support. After this correction, a bullish reversal is anticipated, potentially launching a strong rally towards **\$3,520+**, which serves as the long-term **take profit** zone. This setup presents an opportunity for traders to position short in the near term and long once the (e) wave completes, signaling the end of the larger correction and the start of a bullish breakout.
XAU/USD: Bull or Bear? Let's Find Out! (READ THE CAPTION)By examining the gold chart on the 4-hour timeframe, we can see that after our previous analysis, the price first corrected to the $3323 area and is currently trading around $3336. As mentioned in the previous analysis, as long as the price remains above $3313, we can expect further upside for gold. Based on the prior analysis, the next bullish targets are $3342, $3358, $3366, and $3394.
Please support me with your likes and comments to motivate me to share more analysis with you and share your opinion about the possible trend of this chart with me !
Best Regards , Arman Shaban

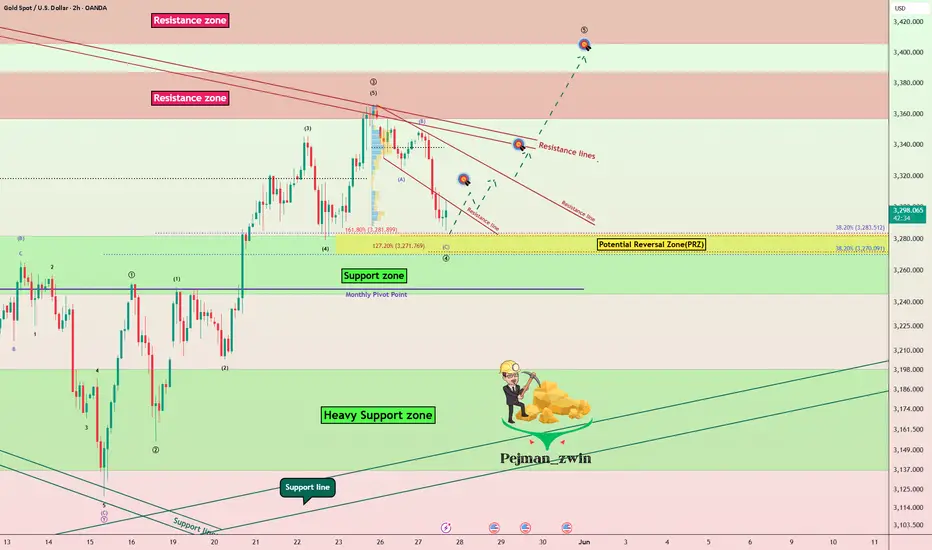
Gold Enters PRZ and TRZ – Correction is Coming!?Gold ( OANDA:XAUUSD ) moved as I expected in the previous Idea and reached the Resistance zone($3,387-$3,357) and Resistance lines .
Gold is moving near the Resistance lines , Resistance zone($3,387-$3,357) , Potential Reversal Zone(PRZ) and Time Reversal Zone(TRZ) .
Also, we can see the Regular Divergence(RD-) between Consecutive Peaks .
In terms of Elliott Wave theory , Gold appears to be completing microwave 5 of Main wave 3 , so Main wave 3 could have an extended structure .
I expect Gold to experience at least one correction after entering the PRZ and TRZ , the correction could continue to $3,329 . If the Support lines are broken, the next target could be the Support zone($3,280-$3,245) .
Note: If Gold touches $3,420, there is a possibility of further pumping and breaking the Resistance zone($3,435-$3,406).
Gold Analyze ( XAUUSD ), 2-hour time frame.
Be sure to follow the updated ideas.
Do not forget to put a Stop loss for your positions (For every position you want to open).
Please follow your strategy; this is just my idea, and I will gladly see your ideas in this post.
Please do not forget the ✅' like '✅ button 🙏😊 & Share it with your friends; thanks, and Trade safe.

XAUUSD Analysis todayHello traders, this is a complete multiple timeframe analysis of this pair. We see could find significant trading opportunities as per analysis upon price action confirmation we may take this trade. Smash the like button if you find value in this analysis and drop a comment if you have any questions or let me know which pair to cover in my next analysis.

GOLD - it's breakout? What's next??#GOLD - perfect move as per our perveious idea regarding gold and now market just broke his current supporting/key level that was actually 3314-15
Keep close because if that is proper breakout then we can expect a further drop towards further downside areas.
Note: we will go for cut n reverse above 3314-15 on confirmation.
Good luck
Trade wisely

Gold May Face Short-Term Correction at $3,350 Resistance📊 Market Overview:
- Gold is trading around $3,329/oz on May 27, after a slight decline due to President Donald Trump's postponement of the 50% tariffs on the EU until July 9, easing trade tensions.
- However, end-of-month USD selling pressure from portfolio rebalancing and concerns over U.S. debt continue to support gold prices.
📉 Technical Analysis:
- Key Resistance: $3,350
- Nearest Support: $3,295
- Candlestick Patterns / Volume / Momentum: The 14-day RSI is at 57, suggesting bullish momentum persists. However, price is testing strong resistance at $3,350. Failure to break through may lead to a pullback towards $3,295.
📌 Outlook:
Gold may experience a short-term pullback if it fails to break above the $3,350 resistance level and if market sentiment continues to be influenced by geopolitical and monetary policy factors.
💡 Suggested Trading Strategy:
SELL XAU/USD at: $3,345 – $3,350
🎯 TP: $3,330
❌ SL: $3,350
BUY XAU/USD at: $3,295
🎯 TP: $3,310
❌ SL: $3,390

xau live trade and educational breakdown Gold hold on to higher ground above $3,330
Despite last week's significant climb, Gold has begun the week on the back foot, with gains restricted around $3,350 per troy ounce. The recent surge in market mood makes it difficult for XAU/USD to regain momentum. Monday is Memorial Day, thus financial markets in the United States will be closed.

Gold Pulls Back Slightly from Highs📊 Market Overview:
Gold (XAU/USD) slightly retreated to around $3,325/oz during the May 26 session, after reaching a two-week high of $3,365. The main reason was the increased investor risk appetite after U.S. President Donald Trump postponed a plan to impose 50% tariffs on EU goods, reducing safe-haven demand for gold.
However, the long-term bullish trend remains supported by a weakening U.S. dollar and expectations of interest rate cuts from major central banks.
📉 Technical Analysis:
• Key Resistance: $3,350 – $3,365
• Nearest Support: $3,325 – $3,285
• EMA: Price remains above the EMA50, indicating a sustained uptrend.
• RSI Indicator: Near 50, giving a neutral signal.
• MACD: Slight bullish signal.
• ADX: 36.998, indicating a strong upward trend.
• Price Pattern: Price is fluctuating within the $3,200 – $3,500 range, with the EMA50 at $3,200 acting as strong support.
📌 Outlook:
Gold may continue to experience a slight short-term correction if market risk appetite remains elevated. However, the long-term uptrend is still supported by a weak USD and expectations of rate cuts.
💡 Suggested Trading Strategy:
🔻 SELL XAU/USD at: $3,350 – $3,365
🎯 TP: $3,300
❌ SL: $3,380

THE KOG REPORT Bank Holiday tomorrow so we'll keep it simple and update the KOG Report on Tuesday ready for the week ahead. Please have a look at the last few KOG Reports to see how it went, wasn't a bad week at all.
This week, immediate red boxes are on the chart, there is a red box active above and the indicator is suggesting a potential retracement on the move. So we'll look for price to attempt the high, if failed we can expect the move downside into the order region where we may settle.
RED BOXES:
Break above 3365 for 3370, 3376, 3381, 3390 and 3403 in extension of the move
Break below 3350 for 3343, 3335, 3330, 3323 and 3310 in extension of the move
Please do support us by hitting the like button, leaving a comment, and giving us a follow. We’ve been doing this for a long time now providing traders with in-depth free analysis on Gold, so your likes and comments are very much appreciated.
As always, trade safe.
KOG

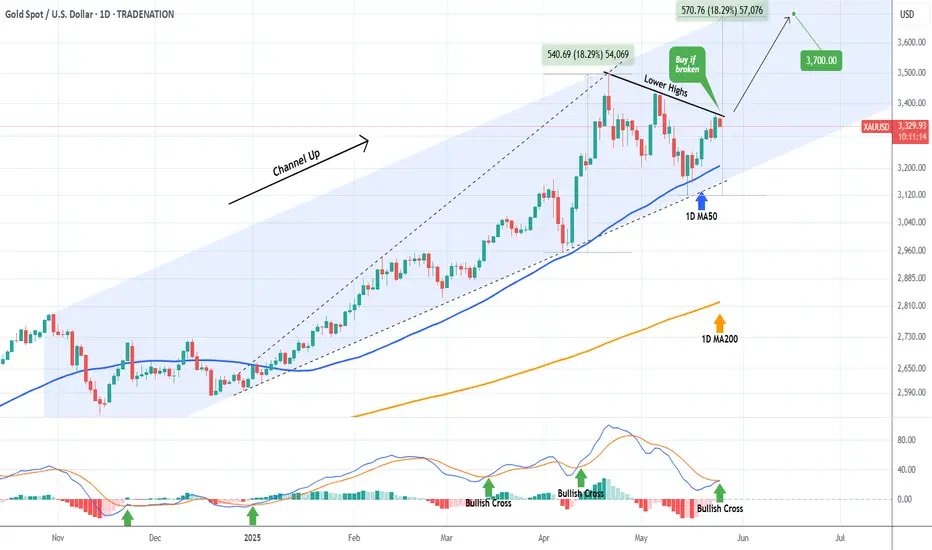
XAUUSD This is the level to look for a break-out.Gold (XAUUSD) has been trading within a Channel Up since the October 30 2024 High, which then transitioned inside it into a Bullish Megaphone. The recent May 15 rebound took place on the 1D MA50 (blue trend-line), which has been the pattern's Support since basically the start of the year (January 08 2025).
Today however we see this rebound taking a pause on the Lower Highs trend-line that started on the April 22 High and until it breaks we can't speculate on a bullish price action as it is more likely to test again the 1D MA50, if not break the pattern downwards.
If however Gold closes a 1D candle above the Lower Highs trend-line, we will turn bullish again, targeting 3700 (+18.29% from the bottom, similar to the previous Bullish Leg).
Notice also that the 1D MACD just completed a Bullish Cross, which favors the buyer's case.
-------------------------------------------------------------------------------
** Please LIKE 👍, FOLLOW ✅, SHARE 🙌 and COMMENT ✍ if you enjoy this idea! Also share your ideas and charts in the comments section below! This is best way to keep it relevant, support us, keep the content here free and allow the idea to reach as many people as possible. **
-------------------------------------------------------------------------------
Disclosure: I am part of Trade Nation's Influencer program and receive a monthly fee for using their TradingView charts in my analysis.
💸💸💸💸💸💸
👇 👇 👇 👇 👇 👇