XAUUSD — Intraday bullish if 3,996 holds — Targets 4,031 → 4,046Overview
Market printed CHOCH → BOS up intraday. I’ll look for a sell-side sweep into 3,996 (Bullish OB + FVG) and take confirmation longs toward BSL at 4,031 and extension 4,046. I’m not interested in chasing highs; I want liquidity → confirmation.
SMC Map (from your chart)
Buy-side liquidity (targets): 4,031.455, 4,046.774
Supply / Bearish OB: ~4,011
Mitigation zone: Bullish OB + FVG ~3,996.993
HTF Demand / Invalidation floor: 3,952.474
Structure: CHOCH → BOS up (intraday).
Playbook: sweep → BOS → FVG fill → OB entry.
Scenarios (reference levels)
Scenario 1 – Long (preferred)
Entry zone: 3,997–3,999 after a sweep of 3,996 + M5 BOS up and pullback (FVG fill).
SL: below 3,992 or below the M5 BOS swing low.
TP1: 4,011 (supply/OB).
TP2: 4,031 (BSL).
Runner: 4,046 (next BSL).
Management: take partial at TP1, move SL → BE; trail to structure.
Scenario 2 – Defensive short (reaction only)
Entry zone: 4,011–4,013 if price taps supply and prints M5 BOS down.
SL: above 4,016 or above reaction high.
TP1: 4,002 (intra support).
TP2: 3,996 (mitigation zone) → consider flip long if confirmation appears.
Invalidation: H1 close above 4,015 (supply reclaimed).
Notes & Session Timing
Focus on London Killzone; re-assess for NY if 4,011 breaks/holds.
No entries without confirmation (avoid FOMO at highs).
News/catalyst: manage size around data; protect gains into volatility spikes.
Risk
Partial at TP1, SL → BE post-confirmation. Risk per trade ≤ your plan. This is a personal view, not financial advice.
Goldtrading

LiamTrading – Gold compressed at the triangle peak; watch for...LiamTrading – Gold compressed at the triangle peak; watch for a break at 4020 (H2)
After a week of accumulation, the price is pressing into the triangle peak between the descending trendline (from late October) and the ascending trendline (from 11/5). The advantage will lean towards an increase if 4020 is broken and sustained.
Technical Analysis (priority H2, Volume Profile – Trendline – S/R – Fibonacci)
Trendline & Structure
The descending trendline is blocking the recovery waves; the ascending trendline supports the adjustment waves.
Closing the H2 candle above the confluence zone ~4020 will confirm a clear upward movement.
Support / Resistance (S/R)
Main support: 3970–3972 (swing low & “Key level Support”).
Decision zone: 4014–4020 (break–retest zone).
Resistance: 4045 (medium-term), 4050 (supply for scalp orders), upper band 4105–4110.
Volume Profile (recent session / composite)
POC magnet: 4015–4017 → likely to have profit-taking/fluctuations; staying above POC turns this area into a launchpad.
LVN: around 4020 → beautiful break-and-go; failing to hold often pulls back to 4015/4010.
Fibonacci Extension (H2 swing)
1.618 coincides with 4045–4050 → first upward target.
2.272/2.618 creates a liquidity zone 4095–4110 → area may weaken/strong profit-taking.
Today's Trading Scenarios
Scenario 1 – Buy on breakout
Entry: 4020–4022 after closing above trendline + retest holding 4018–4020
SL: 4014
TP: 4045 → 4070 → 4100–4110
Management: Take partial profit at 4045; move SL to break-even when reaching +1R. Staying above 4020 turns POC 4015–4017 into support.
Scenario 1b – Buy on pullback (before breakout, cautious volume)
Entry: 3998–4002 (“400x”) when there is an upward reaction at the ascending trendline
SL: 3988
TP: 4017 → 4045
Note: H2 closes below 3988 → cancel the order.
Scenario 2 – Sell scalp at resistance
Entry: 4048–4052 (confluence of Fibo 1.618 + supply zone)
SL: 4056
TP: 4040 → 4030 → 4020
Note: This is counter-trend. Ignore if H2 closes strongly above 4052.
Summary
The upward bias is confirmed when breaking–holding 4020, opening targets 4045 → 4070 → 4100+. Before that signal, trade within the range respecting POC 4015–4017 and ceiling 4045/4050. Risk per order 0.5–1%, move SL to BE when reaching +1R.

The 11.7 range is narrowing; buy low and sell high.Gold has recently exhibited a typical consolidation pattern. After a brief dip to 3928 at the beginning of the week, it gradually stabilized and rebounded from Wednesday, briefly surging to 4020 yesterday, forming a V-shaped rebound overall, but failing to break out of the large consolidation range of 4060-3915. As time progresses, the range of fluctuation continues to narrow, forming a converging triangle pattern, suggesting the market is at a critical juncture in choosing a direction.
Today's trading should focus on two key price levels: 4020 represents significant short-term resistance, while 3965 is a support level that has been repeatedly tested recently. Strategically, short-term investors can buy low and sell high within the 4020-3965 range.
XAUUSD – WAITING FOR CONFIRMATION OF UPTREND – TARGET 4050 💛 XAUUSD – WAITING FOR CONFIRMATION OF UPTREND – TARGET 4050 🎯
🌤 1. Overview
Hello everyone 💬
Gold today is still in a phase of hesitation – waiting for signals to confirm a new trend.
On the H2 chart, the price has broken the downtrend line and is retesting this line. The structure of “higher lows” indicates that buying power is gradually gaining the upper hand.
The previous peak around 4018 is currently the decisive point for the trend – if the price confirms a breakout above, the uptrend could extend towards the 4050 area.
Currently, the market is fluctuating within the range of 3964 – 4018, and needs to break out of this range to determine a clearer direction.
💹 2. ICT Perspective
📈 The price has broken the downtrend line and retested the structure on the H2 chart – an early signal for the potential formation of an uptrend.
🟣 The 3964–4018 area is a short-term liquidity accumulation zone before the price expands.
🔹 OB 4040–4042 coincides with significant resistance, suitable for short sell (scalp) orders if there is a strong reaction.
💫 When the price exceeds 4018, the uptrend structure will be confirmed and the expansion target could head towards 4050 – 4077.
🎯 3. Reference Trading Plan
💖 BUY Scenario (priority when confirmed)
Entry: above 4018 | SL: 4011
TP: 4025 – 4033 – 4050 – 4077
💢 Short SELL Scenario (scalping)
Entry: 4040–4042 | SL: 4046
TP: 4022 – 4015 – 3998
⚠️ 4. Important Notes
Clear confirmation is needed when breaking the 4018 area before entering a buy order.
If the price continues to fluctuate within the 3964–4018 range, trading should be limited.
Today is Friday, manage risk more strictly, prioritize accuracy in each order.
🌷 5. Conclusion & Interaction with LanaM2
Gold is showing positive signals 💛
Be patient and wait for reactions around the 4018 area – this could be the start of a new uptrend if clearly confirmed.

STAY IN THE WAVE TO CATCH THE WAVE - THE ART OF RANGE MANAGEMENTHey Everyone,
Here at GVFX, we are currently buying dips. What that means is that we buy on the dips and therefore only concentrate on long positions/buys. As mentioned before, having both sell and buy positions open in your account will affect your psychology and in turn, your trading decisions.
Now a question that typically arises here is why would it still be advisable to buy when the market is pushing down? Firstly, let me assure you that the same algorithms, experience and strategies that we use with our bullish directional bias also gives us the heads up, or down if you will, on when the market is going down. Don't think for a moment that we only know how to analyse a bull market or up trends. We share trade ideas for both Bullish and Bearish moves but choose not to hedge out of choice.
In my experience, it is much safer to get out of a stuck buy position than a stuck sell position. That's not to mention the clean PSYCHOLOGICAL PROFILE that is achieved when trading in just one direction. And although hedging can in theory work, it requires years of experience and in the end, is simply not worth the effort and psychological stress.
Let us look at an example of the current short/mid term trend to further highlight this point. When you have short-term bearish momentum down, we take buys from key supports or MAs which act as dips. Remember that the market does not go up or down in a straight line (with the rare exception of short-lived parabolic moves). So, when the market is going down and hits one of our key levels, a buy from that point will go back up for 30 to 40 pips (this number of pips has been calibrated based on back testing) before resuming back down.
You can think of it like this. The market moves in a zigzag manner. The zig is that part of the leg which is going down to create lower lows (if the downward trend is continuing). The zag is that part of the leg which takes a breather and pushes back up with momentum for our entry and quick pip-take range to create a lower high (if the downward trend is continuing) before heading back down again. We catch the right and safest waves (buys) in and out and surf to success. When price hits a key structural support or stops creating lower lows and lower highs, we then reassess for entries with a wider range of pip capture.
Hope this post helps our followers to understand how we ride waves by staying committed to one direction in order to always fall naturally into the wave rather then chasing a wave!!
GoldViewFX

GOLD (XAUUSD): Deep Consolidation
This week is very slow for Gold.
The market is stuck within a wide horizontal range on a daily time frame.
With the absence of high impact US fundamentals, I think that probabilities will be high that the market will keep consolidating.
The best strategy to follow for now is to look for trading opportunities from the boundaries of the underlined parallel channel: selling from the resistance and buying from the support after a confirmation.
As the price is closer and closer to the resistance, wait for its test and then look for selling.
That is the plan so far.
❤️Please, support my work with like, thank you!❤️
I am part of Trade Nation's Influencer program and receive a monthly fee for using their TradingView charts in my analysis.

LiamTrading – Gold Confirms Medium-Term UptrendLiamTrading – Gold Confirms Medium-Term Uptrend
Gold has officially broken through the descending trendline, confirming a transition to a medium-term uptrend. After a prolonged accumulation phase, the market is beginning to show clear buying strength, and the potential for an extended rally is gradually forming.
Macroeconomic – Fundamental Analysis
The latest report from the World Gold Council (WGC) shows that central banks continued to increase their gold purchases significantly in September, totaling 39 tons, the highest level since the beginning of the year.
Most notably, the Central Bank of Brazil added 15 tons of gold to its national reserves for the first time this year.
Since the beginning of the year, net purchases by central banks have reached 200 tons, clearly reflecting a shift away from the USD amidst global economic and geopolitical instability. This capital flow provides a solid foundation for gold's medium- and long-term uptrend.
Technical Analysis
On the H2 chart, gold prices have broken the descending trendline, signaling a reversal and establishing a new upward structure.
The 3985–3988 zone is acting as dynamic support, potentially serving as a retest point before prices continue to rise.
The POC of the Volume Profile at the 4015–4017 zone is a short-term resistance, where the market may see profit-taking reactions before breaking higher.
The 4046 mark is considered a decisive area; if surpassed and maintained, the medium-term uptrend will be strongly reinforced.
Today's Trading Scenarios
Scenario 1 – Buy in line with the uptrend:
Entry: 3986–3988 (may wait for retest confirmation)
SL: 3980
TP: 4020 – 4045 – 4090
Scenario 2 – Short sell at resistance:
Entry: 4015–4017
SL: 4023
TP: 4002 – 3986
Summary
Gold is signaling a clear establishment of a medium-term uptrend, supported by central bank buying flows. Traders should prioritize buying positions at strategic support zones and observe price reactions around the POC to confirm the next direction.

Gold Price Surges Above $4,000Gold Price Surges Above $4,000
As the chart shows, XAU/USD climbed above the $4,000 mark today, a move likely driven by:
→ Weakness in the US dollar index – or a pullback from the resistance level discussed in yesterday’s DXY analysis.
→ Concerns over the ongoing US government shutdown – according to media reports, one consequence has been that American airlines began limiting ticket sales in November.
Technical Analysis of XAU/USD
On 28 October, our analysis of gold price movements showed the following:
→ We constructed an ascending channel (marked in blue), illustrating the metal’s remarkable rally from its August low.
→ We suggested that the developing pullback might target the QL line, reinforced by the round-number support at $3,900.
This support zone successfully held, forming a local bottom at point B, after which the price entered a period of consolidation, resembling a symmetrical triangle pattern.
Notably, gold has today broken upward through this triangle (outlined in black). In the broader context, this breakout represents a strong signal from the bulls, suggesting a possible resumption of the 2025 uptrend.
If buying momentum continues, their strength may be tested by:
→ Resistance at $4,045;
→ Resistance near $4,150, which aligns with the 50% retracement of the A→B decline and has previously acted as a reversal zone for XAU/USD.
This article represents the opinion of the Companies operating under the FXOpen brand only. It is not to be construed as an offer, solicitation, or recommendation with respect to products and services provided by the Companies operating under the FXOpen brand, nor is it to be considered financial advice.

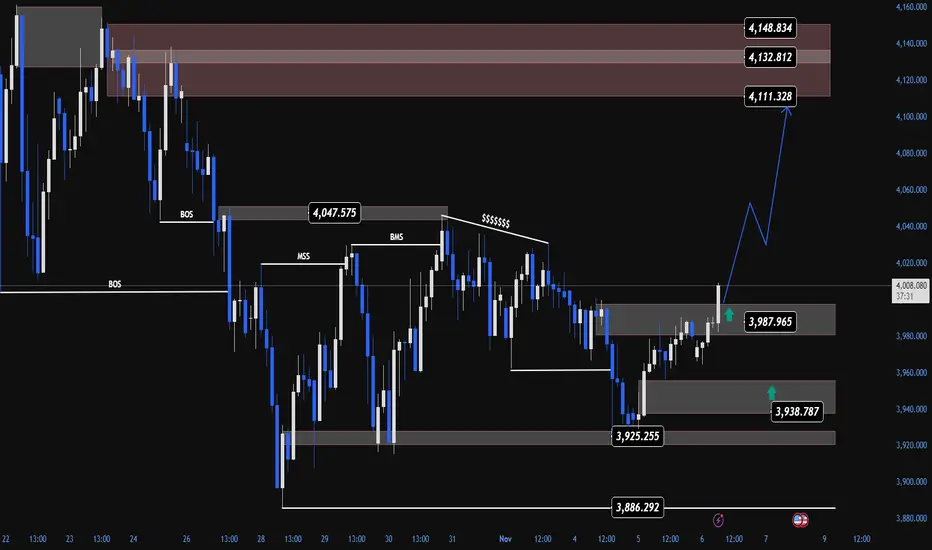
GOLD Smart Money Might Be Preparing for Bullish Structure ShiftGold (XAU/USD) is showing early signs that Smart Money may be shifting from a distribution phase into a short-term accumulation phase.
After a strong bearish leg marked by multiple Breaks of Structure (BOS), recent price behavior now suggests the potential formation of a Market Structure Shift (MSS) — an early indication that institutional flow could be changing direction.
💭 1️⃣ Market Structure – When the Market “Whispers” About Reversal
On the H1 timeframe, we can clearly observe a chain of consecutive BOSs since the 4,150 zone, but what’s intriguing is the reaction around 3,925 – 3,940.
Here, price failed to make new lower lows and began rejecting strongly — leaving several rejection wicks that reveal smart money absorption at discounted prices.
This area represents the discount zone of the current range — where institutions often collect liquidity from trapped sellers before pushing price toward premium levels for redistribution.
The latest Break of Market Structure (BMS) around 3,987 confirms that bearish momentum is weakening, and buyers may be starting to reclaim control in the short term.
🩶 2️⃣ Supply & Demand Zones – Footprints of Smart Money
Karina is currently watching three key zones shaping this market phase:
Demand Zones:
3,938 – 3,925: A strong demand base formed after the initial push upward — acting as a key support if price retraces.
3,986 – 3,988: A minor demand zone formed post-BMS, serving as a potential “reaccumulation point” for the next bullish leg.
Supply Zones:
4,111 – 4,149: Unmitigated Bearish Order Block from the previous decline — the most probable upside target for Smart Money in the current swing.
The projected SMC scenario: Smart Money accumulates at demand → builds liquidity → drives price into the upper supply zones.
🧭 3️⃣ Liquidity Context – Quiet but Purposeful Movement
Gold currently sits within a liquidity equilibrium — a transitional area where both buy- and sell-side liquidity coexist.
Below, 3,886 remains a pocket of sell-side liquidity, while above, large buy-side liquidity pools rest around 4,110 – 4,150.
Smart Money may first collect the remaining sell-side liquidity before triggering a strong upward displacement toward the upper supply zones — following the familiar pattern:
liquidity sweep → displacement → continuation.
🌙 4️⃣ Trade Scenario – Flow With Smart Money, Not Against It
As long as price holds above 3,938 – 3,987, the short-term bias for Karina is bullish.
If price retests these demand zones and forms bullish confirmations (e.g., bullish engulfing or clear order flow shift), it may set the stage for a push toward the 4,111 – 4,148 region.
Entry: 3,938 – 3,987
Stop Loss: 3,925
Take Profit: 4,111 – 4,148
This setup presents roughly a 1:4 R:R, consistent with a buy-side liquidity grab strategy under SMC principles.
🌷 5️⃣ Reflection – When the Market Moves in Silence
After an extended bearish phase, Gold now seems to be accumulating strength in quiet preparation.
This is not a loud reversal — it’s a subtle rebalancing of institutional flow.
To Karina, the market right now feels like a slow, gentle rhythm — calm, deliberate, and full of hidden intent. Sometimes, the key isn’t chasing volatility, but listening to the whispers of Smart Money in the silence of price action. 🌸
This analysis reflects Karina’s personal perspective and is not financial advice.
Do you see the same structure forming? Could this be the early stage of a bullish cycle, or just another liquidity grab? Let’s discuss below 💬
XAU/USD Holds 3,980$ as Bulls Eye Recovery Toward 4,020$🔍 Market Context
Gold steadies near the 3,980$ mark as traders weigh shifting expectations on US interest rates.
The latest ADP employment report showed a modest increase of 42,000 jobs — easing fears of an accelerated slowdown but reinforcing the broader cooling trend in the labor market.
While the Federal Reserve’s rate cuts have supported bullion throughout the year, the prolonged US government shutdown now clouds macro visibility, delaying key economic data.
Despite mixed sentiment, gold remains one of 2025’s strongest-performing assets, up over 50% year-to-date, driven by ETF inflows and central bank demand.
📊 Technical Outlook (H1–H4)
Gold has staged a notable rebound from the 3,947$–3,969$ demand zone, reclaiming short-term structure and approaching the 3,990$–4,000$ liquidity pocket.
This area aligns with the 0.618 Fib retracement and descending trendline resistance — making it the next decision point for intraday traders.
Key Technical Zones:
• 💎 Support: 3,947$ – 3,969$ (Liquidity Base / Re-accumulation)
• 🎯 Resistance: 3,992$ – 4,024$ (Fibo 0.618 + Trendline Confluence)
• ⚙️ Extended Bull Target: 4,028$ – 4,033$ (1.272–1.618 Fibo Expansion)
• ⚠️ Invalidation: Below 3,940$ → shifts bias toward 3,905$ liquidity pool.
🎯 MMFLOW View
Smart money continues to accumulate within the re-accumulation pocket near 3,950$, hinting at latent bullish intent.
If price holds above 3,970$ after today’s consolidation, an extension toward 4,020$–4,033$ remains highly probable.
However, failure to maintain intraday demand could invite another liquidity sweep before a larger push higher.
⚜️ MMFLOW Insight:
“Liquidity reveals intention — structure only confirms it.”

XAUUSD – DAILY BULLISH SCENARIO – TARGET 4050💛 XAUUSD – DAILY BULLISH SCENARIO – TARGET 4050 🎯
🌤 1. Overview
Hello everyone 💬
Although the larger trend for gold leans towards a downtrend, today I prioritize a bullish scenario in the short term.
On the M30 chart, the price structure is gradually increasing, indicating that short-term capital is shifting towards buyers.
The 3990 zone is a very important area – where a Break of Structure (BOS) has just appeared and is also a strong resistance that has reacted multiple times before.
Price needs to confirm a break above this area to continue expanding the bullish trend.
💹 2. Technical Analysis (ICT Perspective)
📈 An ascending structure (BOS) has formed on M30.
🟣 Buy Zone 3977–3979 coincides with the support trendline – a beautiful confluence point for buyers.
🔹 Resistance zone 3990–4000 is the area to confirm the main direction.
💫 Higher target: Fibonacci Extension 1.618 area around 4049–4050, coinciding with the psychological resistance at 4050.
🎯 3. Reference Trading Plan
💖 Main BUY (priority)
Entry: 3977–3979 | SL: 3970
TP: 3988 – 4000 – 4022 – 4040 – 4050
💢 Short SELL (when price reacts strongly at resistance)
Entry: 4012–4014 | SL: 4020
TP: 4002 – 3988 – 3965
⚠️ 4. Important Notes
Price needs to confirm above the 3990 area to solidify the bullish trend.
If it breaks below 3970, the ascending structure is temporarily invalidated.
Today, prioritize buying according to the capital flow, sell only when there is a clear signal at the resistance zone.
🌷 5. Conclusion & Interaction with LanaM2
Gold is showing positive signals 💛
Be patient and wait for reactions at the Buy Zone 3977–3979, this could be the starting point for a new upward move towards 4050.
This is not an investment recommendation, just a personal view according to the ICT method.
If you find it useful, please 💛 like – 💬 comment – 🔔 follow LanaM2 to update gold analysis with me every day ✨

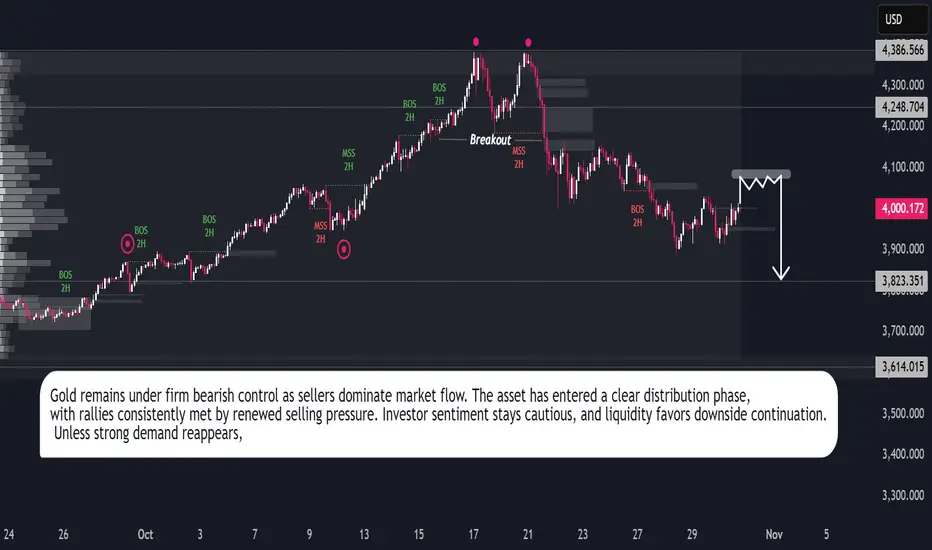
Gold Outlook: Bears Stay in ControlGold continues to operate within a bearish market environment characterized by persistent liquidation and declining momentum. The recent structural shift reflects an ongoing reallocation of capital away from defensive metals toward higher-yield instruments, signaling a broader change in market positioning.
Trading activity indicates that each upward movement is being met with renewed selling interest, suggesting limited participation from institutional buyers. This behavior aligns with the prevailing sentiment of caution, as investors prioritize stability over speculative exposure.
The broader outlook remains subdued, with market conditions favoring continued downside until clearer evidence of renewed demand emerges. Gold’s performance reflects a phase of market adjustment, where declining liquidity and moderate volatility reinforce the persistence of bearish sentiment across the short-term horizon.
4050 or 3905 ?🗒️By examining the gold chart on the 2-hour time frame,
📊you can see that the price managed to reach the 3929 range by breaking the support of 3971;
After reaching this range, buyers got to work and gold is currently trading in the 3975 range.
🔻Given the overall market trend, I expect more declines in gold in the 3947 and 3905 ranges;
💬If the resistance at 4002 is broken, we can expect gold to grow to the 4050 range;
-
-
🗒️با بررسی نمودار طلا در تایم فریم ۲ ساعته،
📊مشاهده میکنید که قیمت با شکستن حمایت ۳۹۷۱ توانسته به محدوده ۳۹۲۹ برسد؛
پس از رسیدن به این محدوده، خریداران دست به کار شدند و طلا در حال حاضر در محدوده ۳۹۷۵ معامله میشود.
🔻با توجه به روند کلی بازار، انتظار کاهش بیشتر طلا در محدودههای ۳۹۴۷ و ۳۹۰۵ را دارم؛
💬اگر مقاومت ۴۰۰۲ شکسته شود، میتوان انتظار رشد طلا تا محدوده ۴۰۵۰ را داشت؛
💭CONTACT ME : @aghayeshademani

Profitable Gold XAUUSD Indicator Trading Strategy Explained
To profitably trade a massive bullish rally on Gold , you don't need a complicated system.
In this article, I will teach you an easy indicator strategy for trend-following trading XAUUSD.
It is based on 2 default technical indicators that are available on any trading platform: Mt4, Mt5, TradingView, etc.
You will get a complete trading plan:
exact entry signal,
smart stop loss placement,
trade management rules.
The first indicator that you will need to trade this strategy is Moving Average.
We will use a combination of 2 Moving Averages: Exponential Moving Average EMA with 20 length and a Simple Moving Average SMA with 9 length.
Our entry signal will be a crossover of 2 MA's on a 4H time frame.
SMA and EMA should meet first.
SMA should break through EMA to the upside to confirm a bullish signal.
With a high probability, Gold price will rise significantly then.
The main nuance of this strategy is to wait for a confirmed crossover and avoid the traps.
Patiently wait for a touch of 2 moving averages first.
After that, you will need to wait for a close of one more 4H candle to make sure that SMA stays above EMA.
You can see that though 2 Moving Averages met, SMA failed to break through EMA.
That is how a valid buy signal looks: SMA stays above EMA after a close of the next 4H candle.
After you identified a valid crossover, it is your signal to open BUY trade on Gold .
Your entry should be exactly after a close of a 4H candle.
Stop loss will be based on another popular free indicator - Average True Range ATR with default 14 length settings.
Your safe stop loss should be 2 ATR from the entry.
In our example, ATR is 145 pips.
2 ATR will be 190 pips.
That will be our stop loss.
With this trading strategy, we will not use a fixed Take Profit TP and use trailing stop loss instead.
It will help us to catch extended bullish waves on Gold.
Once the market starts rising, updating the highs, trail your stop loss based on EMA and keep it 1 ATR below that.
Make sure that you move your stop loss only when EMA and Gold price are rising . Once Gold price or EMA start moving in sideways or go down, do not lower your stop loss.
Using this strategy consistently, you will be able to catch significant bullish waves.
In Autumn trading season of 2025, this strategy provided, 3100+ pips entry signal.
What I like about this strategy is that being very simple, you can easily backtest that and measure its objective trading performance.
Easy entry, confirmation, and trade management rules make this strategy appropriate for beginners in Gold trading and will help to not miss a current extraordinary trend.
❤️Please, support my work with like, thank you!❤️
I am part of Trade Nation's Influencer program and receive a monthly fee for using their TradingView charts in my analysis.
The Market Is Still in Distribution, but Smart Money Moves QuietGold is trading around $3,990, recovering slightly after last week’s sharp sell-off. However, from a Smart Money Concept (SMC) perspective, the market structure continues to show clear bearish intent — with lower highs, unmitigated supply zones, and descending liquidity still controlling price flow.
💭 1️⃣ Market Structure – The Bearish Flow Remains Intact
After several BOS (Break of Structure) and CHoCH (Change of Character) confirmations, the bullish attempts are getting weaker.
Price remains capped under a clean descending trendline, showing how sellers are gradually stepping in at every premium retracement level.
The current market is operating within a distribution phase, where Smart Money continues to build short positions above liquidity zones while trapping late buyers inside minor pullbacks.
The key level 4,043 – 4,050 stands out as the nearest Bearish Order Block (OB) and strong short-term supply. Until this area is decisively broken, Gold remains technically bearish.
🩶 2️⃣ Supply Zones – Where Smart Money Left Their Footprints
Karina is currently watching three critical supply layers:
4,043 – 4,050: Active supply zone aligning with trendline confluence – ideal for short-term sell setups.
4,149 – 4,160: A deeper liquidity pocket where Smart Money previously distributed heavy positions.
4,221 – 4,359: Major macro supply zones – where institutional orders were likely built during October’s highs.
Price is still well below these regions, suggesting that any rally remains corrective rather than impulsive.
🧭 3️⃣ Liquidity Context – The Path of Least Resistance
Below current price, 3,884 – 3,890 forms the next liquidity magnet — a cluster of equal lows and inefficiency gaps that Smart Money might target next.
Above, resting buy-side liquidity around 4,050 gives institutions a perfect opportunity to engineer a small push up before resuming the main downtrend.
This is the same pattern we’ve seen repeatedly: liquidity grab → displacement → continuation.
🌙 4️⃣ Trading Scenario – Flow With the Institutions, Not Against Them
As long as the structure remains below the trendline, Karina maintains a bearish bias.
If price retests 4,043 – 4,050 and shows rejection through a bearish engulfing or sharp rejection wick, short setups will align with SMC logic.
Entry: 4,043 – 4,050
Stop Loss: 4,060
Take Profit: 3,884 – 3,890
The setup offers a clean 1:4 R:R, based purely on structure and liquidity flow — no indicators, no noise.
🌷 5️⃣ Reflection – When Silence Speaks Louder Than Volatility
Gold’s current rhythm is calm yet calculated. Every retracement feels like a whisper from Smart Money — testing patience, not conviction.
For Karina, this is the phase where discipline matters most.
While many chase impulsive moves, Smart Money quietly prepares for the next wave, and the charts tell their story to those patient enough to listen. 🌙
This analysis reflects Karina’s personal view and is not financial advice.
What do you see in today’s Gold structure? Is this retracement a calm before another drop, or the beginning of accumulation? Let’s discuss below 💬

Gold Rebuilds Structure Above $3940, Eyeing $4030 Liquidity Pool
🔍 Market Context
Gold is attempting to regain bullish momentum as safe-haven demand remains supported by rising geopolitical tensions and uncertainty around the upcoming US ADP employment data.
The market continues to oscillate between risk aversion and rate expectations — with the Fed’s hawkish tone keeping the Dollar capped but steady.
At the same time, capital flow rotation from equities into defensive assets is quietly supporting the metal’s structural recovery, with gold holding above key liquidity levels despite intraday volatility.
📊 Technical Analysis (H1–H4)
After forming a double-bottom structure near $3,938, XAU/USD has reclaimed the 38.2% retracement zone (3,974–3,975) from its previous bearish leg.
This area now acts as a pivot zone, separating short-term bullish continuation from potential retracement.
The chart reveals a classic liquidity cycle shift:
Phase 1: Sweep of downside liquidity below 3,930, marking an internal structural low.
Phase 2: Expansion leg reclaiming short-term FVGs, signaling a potential smart money accumulation phase.
Phase 3: Repricing toward upper liquidity targets aligned with Fibonacci extensions.
Key Technical Zones:
• 💎 Liquidity Base: 3,938 – 3,950 (recent demand re-entry area)
• 🎯 Rejection Zone 1: 3,974 – 3,999 (previous inefficiency block)
• ⚙️ Target Zone: 4,033 – 4,045 (1.272–1.618 Fibo extensions, liquidity pool)
• ⚠️ Invalidation: Break below 3,920 would shift structure back to distribution.
🎯 MMFLOW Scenario
If gold sustains above the 3,950 support cluster, buyers are likely to extend the retracement toward 3,999–4,033 where resting liquidity sits.
A clean rejection from 4,000 could trigger an intraday pullback — but as long as price holds above the 3,938 OB base, the bullish recovery structure remains intact.
The short-term narrative favors controlled accumulation, suggesting that smart money is building positions into liquidity zones before the next impulsive move.
⚜️ MMFLOW Insight:
“Liquidity isn’t random — it’s engineered. Every move leaves a footprint, and gold is tracing its next one above $3,950.”

XAUUSD – PRIORITIZE BUYING, TARGET 4040XAUUSD – PRIORITIZE BUYING, TARGET 4040 🎯
🌤 1. Overview
Hello everyone 💬
My perspective on gold today is still to prioritize buying, as there hasn't been a clear deep decline.
The price is currently consolidating in a narrow range, needing more time to build momentum before breaking out.
I will wait to buy again at the OB area – where there is high liquidity, this is a zone likely to see strong price reactions.
The best scenario today: the price may sell off slightly at FVG, then drop to OB to trigger the buy setup.
💹 2. Technical Analysis (ICT Perspective)
💜 Price Structure: Gold still maintains a short-term uptrend, the main trend hasn't been broken.
💎 Liquidity: Liquidity is concentrated below the 3940 area – a potential buying OB.
💫 FVG: The 3975–3980 area is a zone where a slight bearish reaction may occur.
⚙️ Order Block (OB): 3938–3945 is a crucial support zone, with the potential for a strong price rebound from here.
📈 Main Target: 4040 – a high liquidity zone, coinciding with a large frame FVG.
🎯 3. Reference Trading Scenarios
💢 Short SELL (scalping)
Entry: 3980 | SL: 3988
TP: 3972 – 3960 – 3940
💖 Main BUY (priority)
Entry: 3940 | SL: 3932
TP: 3952 – 3968 – 3990 – 4012 – 4035
✨ 4. Important Notes
🔹 Observe price reactions at FVG and OB before taking action.
🔹 If the price exceeds 3988, the bearish scenario is temporarily invalidated.
🔹 The main direction is still to buy according to the Smart Money trend – only consider short selling when confirmed.
🌷 5. Conclusion & Interaction with LanaM2
Gold is still following the Smart Money Flow trajectory,
patiently waiting for the price to reach a favorable zone to act 💪
This is not an investment recommendation, just a personal perspective based on the ICT method.
If you find it useful, please 💛 like – 💬 comment – 🔔 follow LanaM2
to stay updated with the latest gold insights every day.

Gold prices fell back during the US session on November 5th.From the 4-hour chart, the current short-term resistance levels to watch are 3965-70 and 4020-55. Short-term support is at 3918-20, with a key support level at the previous low of 3888-90. The strategy is to sell on rallies.
Gold Trading Strategy:
1. Sell gold at 3980-70, add to the short position at 4020-25, stop loss at 4039, target 3940-3930.

GOLD 1H CHART ROUTE MAP UPDATE & TRADING PLAN FOR THE WEEKHey Everyone,
Please see our updated 1h chart levels and targets for the coming week.
We are seeing price play between two weighted levels with a gap above at 4042 and a gap below at 3992. We will need to see ema5 cross and lock on either weighted level to determine the next range.
We will see levels tested side by side until one of the weighted levels break and lock to confirm direction for the next range.
We will keep the above in mind when taking buys from dips. Our updated levels and weighted levels will allow us to track the movement down and then catch bounces up.
We will continue to buy dips using our support levels taking 20 to 40 pips. As stated before each of our level structures give 20 to 40 pip bounces, which is enough for a nice entry and exit. If you back test the levels we shared every week for the past 24 months, you can see how effectively they were used to trade with or against short/mid term swings and trends.
The swing range give bigger bounces then our weighted levels that's the difference between weighted levels and swing ranges.
BULLISH TARGET
4042
EMA5 CROSS AND LOCK ABOVE 4042 WILL OPEN THE FOLLOWING BULLISH TARGETS
4089
EMA5 CROSS AND LOCK ABOVE 4089 WILL OPEN THE FOLLOWING BULLISH TARGET
4136
EMA5 CROSS AND LOCK ABOVE 4136 WILL OPEN THE FOLLOWING BULLISH TARGET
4194
BEARISH TARGETS
3992
EMA5 CROSS AND LOCK BELOW 3992 WILL OPEN THE FOLLOWING BEARISH TARGET
3956
EMA5 CROSS AND LOCK BELOW 3956 WILL OPEN THE FOLLOWING BEARISH TARGET
3922
EMA5 CROSS AND LOCK BELOW 3922 WILL OPEN THE SWING RANGE
3866
3820
As always, we will keep you all updated with regular updates throughout the week and how we manage the active ideas and setups. Thank you all for your likes, comments and follows, we really appreciate it!
Mr Gold
GoldViewFX

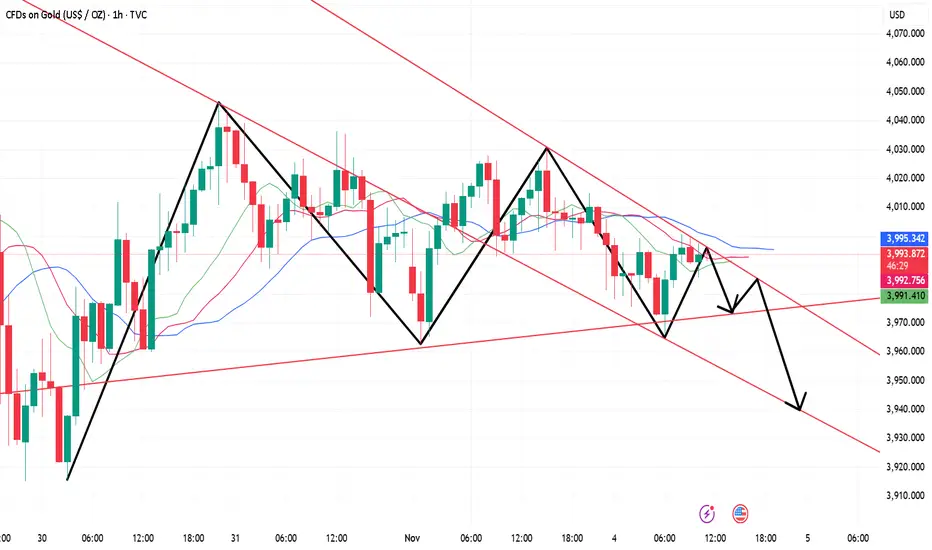
Gold Short-Term Technical Analysis Guide (November 4th)!!!Gold is showing a converging pattern on the 1-hour chart, with moving averages clearly intertwined and failing to establish a strong directional trend. Gold is currently facing resistance around the 4000 level and hasn't shown a strong upward breakout. If gold breaks through and holds above 4000, then the 4020-4030 resistance zone should be monitored during the US session. Overall, gold is expected to remain in a range-bound market.
GOLD – When the Market “Whispers” About the Weakness of Buyers1️⃣ Market Structure – When the Bullish Rhythm Slows Down
After a series of CHoCHs and BOSs, the short-term bullish structure has clearly broken. The zone around 4,027 – 4,030 now acts as a Strong High, where smart money likely absorbed most of the buy-side liquidity.
Each retracement has become weaker, forming a sequence of Lower Highs — a classic sign of a distribution phase. The market is currently trading within the premium zone of the current range, where any reaction could be the “last kiss” before a potential drop toward lower demand areas.
2️⃣ Supply & Demand Zones – Footprints of Smart Money
Zooming into price behavior, the Sell Zone 4,010 – 4,015 stands out as a key Bearish Order Block formed after the most recent BOS — a zone Karina is watching closely.
If price retests this area and shows a clear rejection (e.g., bearish engulfing or upper-wick rejection), it could mark the beginning of a smart-money-aligned short setup.
Below, the 3,938 – 3,920 zone remains the untested liquidity pocket — a Weak Low where buy-side positions are likely resting. Smart Money may target this area to complete the distribution cycle before generating a potential accumulation reaction.
3️⃣ Liquidity Context – Silence Often Speaks the Loudest
Above the 4,020 – 4,030 area lies buy-side liquidity — a cluster of stop-loss orders from retail longs. A small liquidity sweep into this region followed by a strong bearish reaction would be a classic SMC pattern: grab liquidity, then move in the true direction.
Once that liquidity is absorbed, price could accelerate toward the 3,938 – 3,920 zone to clear sell-side liquidity, finalizing the redistribution phase.
4️⃣ Trading Scenario – Following the Smart Money Flow
Given the current structure, Karina favors short opportunities if price reacts decisively at the 4,010 – 4,015 zone, confirmed by bearish price action (such as a rejection wick or engulfing pattern).
Entry: 4,012 – 4,015
Stop Loss: 4,030
Take Profit: 3,938 – 3,920
This offers an approximate 1:4 R:R ratio, aligning with a high-probability, structure-based setup. It’s not a trade signal, but rather a perspective — a way to understand how Smart Money moves and leaves its traces.
5️⃣ Conclusion – Patience Is the Quiet Strength of a Trader
The market often speaks through behavior, not noise. Gold is currently in a quiet state — a moment of balance where Smart Money prepares for its next move. For Karina, silence itself can be the strongest signal when you know how to listen.
This analysis reflects Karina’s personal view and is not financial advice.
What do you see in Gold’s current structure? Could this minor push toward 4,015 be the start of a deeper move down? Let’s discuss in the comments 💬.

Gold Awaits Direction Near $4,000 as Fed Comments Limit Upside🔍 Market Context
Gold is trading slightly below the $4,000 mark in early Asian hours, pressured by the Fed’s hawkish tone despite weaker US manufacturing data.
Fed Chair Jerome Powell signaled that another rate cut this year is “not guaranteed”, tempering expectations for further easing.
Meanwhile, ISM Manufacturing PMI slipped to 48.7 in October, below forecast — showing a slowdown, yet not enough to shift the Fed’s cautious stance.
Markets currently price in a 70% chance of a 25 bps cut in December and a total 82 bps by end-2026, reflecting moderate easing expectations rather than a full pivot.
📊 Technical Outlook (H1–H4)
Gold is consolidating around the 3,984–3,985$ area, forming a reaction base above 3,963$ support.
The structure remains within a short-term ascending channel, with the next directional cue likely from the 4,024$ resistance zone.
Key Levels:
• Support 1: 3,963$ – 3,984$ (liquidity defense zone)
• Support 2: 3,923$ (bullish invalidation level)
• Resistance 1: 4,024$
• Resistance 2 / Target: 4,046$
A sustained break above 4,024$ could trigger momentum toward 4,046$, confirming trend continuation.
Conversely, losing 3,963$ would expose 3,923$ as the next liquidity pool before a potential rebound.
🎯 Trading Outlook
Bias remains neutral-to-bullish as long as 3,963$ holds.
If price reacts positively at this zone during the Asian session, short-term buyers may step in toward 4,024$–4,046$.
However, any fresh hawkish comments from Fed officials could cap gains and trigger profit-taking.
⚜️ MMFLOW Insight:
“Liquidity builds where patience fades — smart money waits for the crowd to act first.”

Gold prices dipped and rebounded; watch for 3980.Gold prices traded within a range today, with bullish and bearish forces relatively evenly balanced.
In Asian trading, gold opened lower and quickly dipped, hitting a daily low of $3962 before rebounding. As of pre-market trading, gold is currently trading around $4000. Looking at the hourly chart, the Bollinger Bands are narrowing, and gold is trading below the middle band, exhibiting typical range-bound trading characteristics.
During the US session, watch for resistance at $4030. A break above this level could present a buying opportunity on a pullback, with a target of the $4050 area. If prices fall again, watch for support around $3980. In short, the market remains range-bound; avoid chasing highs or lows.
