Weekly Outlook: Strong Bullish Momentum Meets Key US Data XAUUSD – Weekly Outlook: Strong Bullish Momentum Meets Key US Data | MMFLOW TRADING
Market View:
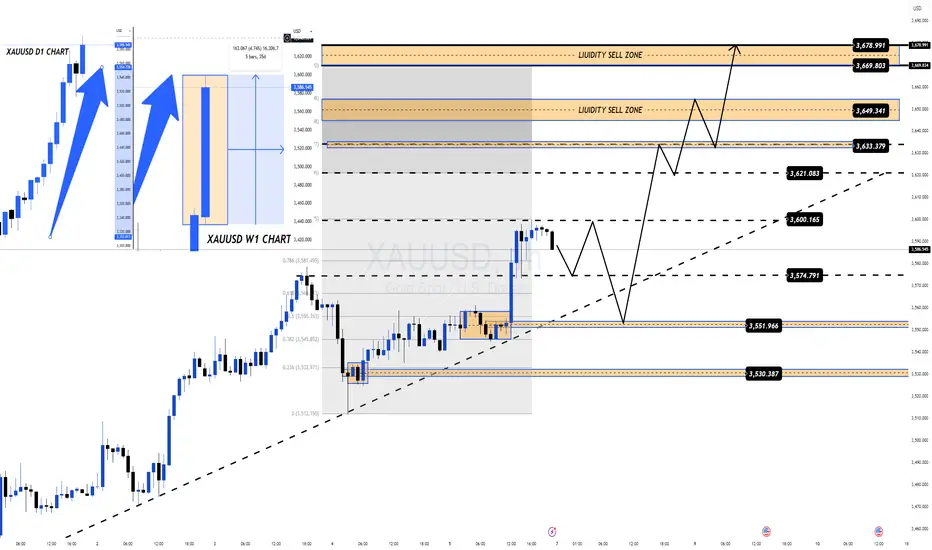
Gold (XAUUSD) ended the week with explosive momentum after Nonfarm Payrolls pushed price to a new ATH near $3600/oz. On the daily chart, the bullish candle closed with only ~30% wick, showing no signs of profit-taking. The weekly chart also printed a powerful bullish candle, confirming BUY dominance. This suggests that gold could see further upside in the coming week – and potentially throughout this month.
Macro & Fundamental Drivers (Week Ahead):
Key US data will drive volatility in XAUUSD:
Wed, Sep 10: Core PPI & PPI m/m → hotter-than-expected prints could support USD short term, weighing on gold.
Thu, Sep 11: CPI (Core, m/m, y/y) + Jobless Claims → the most critical release. Softer CPI + higher jobless claims would fuel gold’s rally, while hotter CPI keeps Fed hawkish.
Fri, Sep 12: UoM Consumer Sentiment & Inflation Expectations → inflation outlook could shape Fed expectations further.
Overall, fundamentals may create volatility, but the medium-term bias stays bullish.
Technical Outlook (H1 Chart):
Price is consolidating sideways after the Nonfarm breakout. Key levels to watch next week:
Support: 3574 – 3551 – 3530 – 3516
Resistance: 3600 – 3621 – 3633 – 3649 – 3669 – 3678
Trading Plan:
BUY bias (preferred):
Long on pullbacks around 3574–3550
SL: below 3530
TP: 3600 → 3621 → 3633 → 3649 → 3669 → 3678
SELL scalp (alternative):
Only if 3530 breaks with strong CPI upside surprise → target 3516/3527
Summary:
✅ Gold remains in a strong uptrend on both Daily and Weekly charts, with macro factors favouring further upside if inflation continues to ease.
👉 Watch 3592 (bullish trigger) and 3575 (bearish trigger) – these are the decision points for the next major move.
Follow MMFLOW TRADING for daily updates and trade setups.
Goldtradinhg
GOLD DAILY CHART ROUTE MAPHey Everyone,
Daily Chart Update
Another Clean Rejection: Structure Still Dominates
Following up on the recent price action last week, the 3372 support level continued to provide support aligned perfectly with the channel half-line, giving us the bounce that continued all the way up to 3409, just short of the 3433 resistance, which once again remains open for a potential test.
We remain in the same structured range, with price still rotating between 3272 and 3433, a 170+ pip zone that continues to deliver high-probability trade setups.
Here’s where we are now:
🔹 Range Still Active
Price is respecting the 3272–3433 boundaries with precision. Until we get a decisive break and hold outside this range, range bound strategies remain in play.
🔹 No Breakout = Clean Rejection
The failure to sustain above 3433 confirms resistance is still valid. We're watching EMA5 for potential breakout confirmation, until then, the bias stays neutral within the range.
🔹 Channel Half-line Bounce
That rejection into 3272 also matched the channel half line, and the bounce there further cements this area as critical support. The latest rally to 3397 reinforces the strength of this pivot.
Updated Key Levels
📉 Support – 3272
Still the major pivot. Buy zones remain valid here unless we see a confirmed breakdown.
📈 Resistance – 3433
Now clearly tested and rejected more than once. Any clean break and hold above could change the dynamic, but until then, it’s solid resistance with 3397 as support.
Thanks as always for your support.
Mr Gold
GoldViewFX

GOLD ROUTE MAP UPDATEHey Everyone,
A fantastic start to the week with our chart idea playing out perfectly inline with our trading plans.
We started the day with our Bullish target 3090 hit, followed with 3103 and then cross and lock confirmation to complete 3117. We also got the cross and lock above 3117 to open 3128 and just fell short of a pip. We will keep this full gap in mind, as we continue with our plans to buy dips
Rejection at this level will see lower Goldlturns tested and likely continue to see bounces on the weighted Goldturn levels, which we can use inline with our plans to buy dips.
We will keep the above in mind when taking buys from dips. Our updated levels and weighted levels will allow us to track the movement down and then catch bounces up.
We will continue to buy dips using our support levels taking 30 to 40 pips. As stated before each of our level structures give 20 to 40 pip bounces, which is enough for a nice entry and exit. If you back test the levels we shared every week for the past 24 months, you can see how effectively they were used to trade with or against short/mid term swings and trends.
BULLISH TARGET
3090 - DONE
EMA5 CROSS AND LOCK ABOVE 3090 WILL OPEN THE FOLLOWING BULLISH TARGET
3103 - DONE
EMA5 CROSS AND LOCK ABOVE 3103 WILL OPEN THE FOLLOWING BULLISH TARGET
3117 - DONE
EMA5 CROSS AND LOCK ABOVE 3117 WILL OPEN THE FOLLOWING BULLISH TARGET
3128
BEARISH TARGETS
3074
EMA5 CROSS AND LOCK BELOW 3074 WILL OPEN THE FOLLOWING BEARISH TARGET
3055
EMA5 CROSS AND LOCK BELOW 3055 WILL OPEN THE FOLLOWING BEARISH TARGET
3039
EMA5 CROSS AND LOCK BELOW 3039 WILL OPEN THE FOLLOWING BEARISH TARGET
3020
EMA5 CROSS AND LOCK BELOW 3020 WILL OPEN THE SWING RANGE
SWING RANGE
2999 - 2985
As always, we will keep you all updated with regular updates throughout the week and how we manage the active ideas and setups. Thank you all for your likes, comments and follows, we really appreciate it!
Mr Gold
GoldViewFX
