Group

EURJPY Bulls Running well, Update on Previous PostEURJPY Bullish Overview. t.me/BigBellyShark
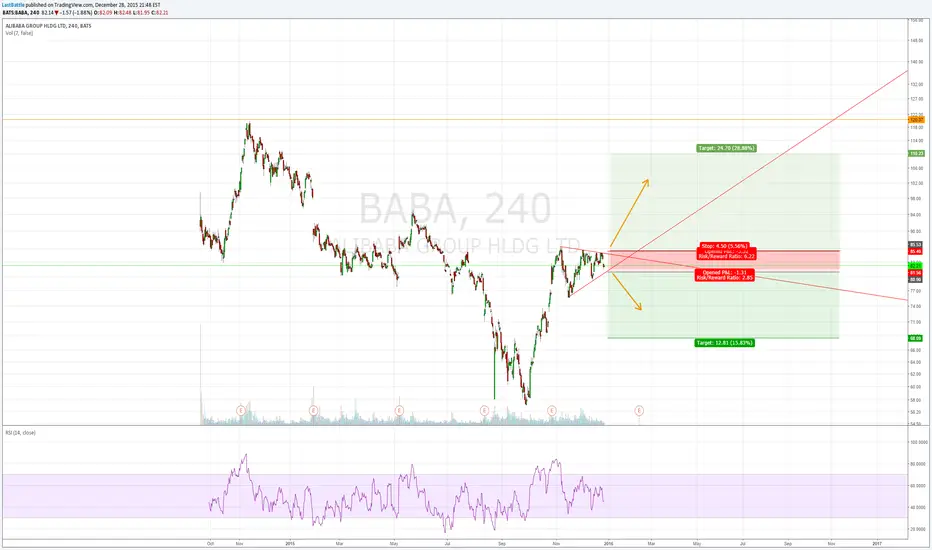
My previous post showed the weekly chart of EJ and how the zones highlighted will be good zones to look for buys on this pair. EJ approached the zones shown on the previous charts and we got the reaction we were looking for. 119.400 Key Support zone which we saw a huge impulse of buyers step into the market.
$$$ on Hour 4 Price Broke Previous LTF market structure, resulting in a series of HHs and HLs
$$$ Price previously broke HTF market structure and is forming a new Higher Low.
Looking at bullish targets it is key to understand that with our targets we need to be aware that there are more zones set above the zones we can see on hourly/H4 which price can easily reach over the next quarter.
What to look for next on EURJPY
We need a break above 122.150, once this occurs we will go down to a lower time frame and identify LTF entries. with Target Profits set at 124.400. (200+ Pips)
BIG UPDATES COMING TO OUR NEW TELEGRAM GROUP.
Big Belly Shark Trading.
t.me/BigBellyShark type this in google to gain access to our New Channel.
Free Telegram Group With Top-Down Analysis on our favourite forex pairs.

Astralis Group is leaving the stationPandemic Panic super sale seems to be over. I'm glad I had two chances to accumulate with significant discounts.
Still holding for long term potential. We're 6 months into a 10 year trade.
Its not too late for you get a piece.

Buy: ALG.AXAnother one for the watchlist
Pretty violent downtrend
Ascending triangle forming
Price on the right side of MA
Enter on the break of 47c

Astralis Group and the Danish pandemic comebacks What a crazy lockdown period huh? I used the time to trim my expenses budget, plan ahead and free up more capital for investing.
I also learned a lot of cooking skills.
I also invested during the lockdown (As I do every month with excess capital). Here's the Astralis Group update.
Nobody is perfect, and I absolutely have taken a hit on this stock so far, but keep in mind that we are only a few months into a decade long trade.
Currently, we're in the accumulation phase for this stock, which means that excess capital is spread around this and other picks when available.
For clarity, I've posted the average price i've paid for the stock during the accumulation phase.
It's a simple strategy, but it can apply well to sectors / picks you determine will do well over a protracted period of time.
Astralis has resumed function as regular, and won most recently the CS:GO Road to Rio event.
June is going to be action packed for Astralis Group as both their League of Legends team and CS:GO teams clash off in the summer event qualifiers.
Positive outcomes and viewership numbers, combined with a more positive outlook on global reopening, could spark a rally around the june period, sending us up to test some resistance.

EURUSD, First Re-entry Long?GOOD DAY TRADERS. First off please please message me if you would like to JOIN the limited time opening of our FREE Private Profit Chat on Discord! ... many many educational videos are being uploaded for the next few weeks.
SIMPLE, setup today with the perfect inverse on the DXY index, We've been stalking for the last few days in the Group Chat so we will see how this plays out.
I am personally already long. But this is just my outlook.
Please let me know in the comment section below if you have any questions, tips or suggestions! -CO

Buying Astralis part 2Again, following up on the previous analysis posted I am repeating the buy signal, and adding more to my position.
Please, don't consider this a "loss chase" but merely part of my strategy to gradually build up a stock portfolio.
Astralis' Origen team managed to win their matches this weekend, securing them a tied spot for the first place in the LEC Spring
Around the time of the annual report, Astralis might even have won enough matches in the LEC to actually mention that they're (If they are at that point) qualified for some of the mid-year invitational leagues.
Each league that Astralis' teams qualified for, or owns spots in, is money for us as shareholders. More exposure means better sponsor deals.
These things, combined with the excellent opportunity for Astralis Group to showcase a remarkable 2019 result, and some great expectations for 2020, I think, will spark an impulse wave.
This earnings report will also be Astralis Group's first time to speak to the shareholders, so I am expecting the price to pick up rapidly upon the release of their first report, since bringing in over 5000 new individual investors.


USD/CAD Short Now- Target 50 PIPS DM to Join Free TelegramUSDCAD has climbed back up to daily resistance and is now starting to reject, this is a nice price action setup. I have a free telegram channel where I will be posting my trades for the week. DM me if you want to make some extra money.

MATCH GROUP (Buy opportunity for existing shareholders)The stock rebounded from its 50-day moving average in heavy volume. That offers a follow-on buy opportunity for existing shareholders or a new entry for aggressive buyers.

GBP JPY LONGI see a long trade emerging with TP:140.651 and SL: 139.549.
Thanks to everyone who is in our Telegram group

WAVESBTCWith btc correcting a bit, we might see some alt action.
One alt that might be approaching bottom for now is WAVES.
Chart tells me would could make a >10% move here which could last a few days. Im using a measured move for my target, targetting next price channel. Aiming for 16-20% here. Stoploss I would go for 3-5%, best to buy on a retracement on 4h or 2h chart.

Rising Wedge Long BTC - Custom Longs/Shorts IndicatorCheck out the ALL Longs vs Shorts Indicator, Click Here
It can display any pair's Longs/Shorts on BitFinex
The amount of Bitcoin short positions on Bitfinex fell by 20% this morning following a 6,500 Bitcoin short order being closed.
Usually a move of this magnitude would move the Bitcoin price up, but it didn't break $5,350 level of resistance.
The lack of price action could be attributed to a hidden sell order being placed, which would mean that in spite of the $34 million short position closing, price would remain pegged to the hidden order.
The amount of long positions on Bitfinex did increase from 23,800 to 26,000, which could suggest that a trader flipped their short position to long as a result of the ongoing market rally
finance.yahoo.com

GAS looking to clear 20MA on weekly 50% targetGAS chart with targets, so far we are getting rejected by the 20 weekly MA, we all know what happens if GASBTC breaks above, targets on chart. Added 2 stoplosses.

BTCUSDT follow that december run pretty closelyI copied over the ranges from that nice run we had back in december, so far everything seems to line up nicely, meaning we will see another drop back to low 3k range.

ONT/BTC short term EW set upONT smashing down doors, hit the 1.168 extension from the original push lining up with the 100% on the trend based fib extension, which means this leg has been of equal length of the original leg, next target being the 1.272.
There we should find a reversal pattern and be looking at the .786 on the trend based fib for a re-entry to catch the last leg up to the 1.618 on the trend based fib.
we will look to exit this trade just before the 1.272 around .0002190-.0002200, re-entry at .0002000 ish

BTC/USD - Rejection at 4200 Level Supply- A rejection off the Supply Zone that was taken from the 2nd of December.
- Price has tested this Supply Zone 3 times since this latest rejection, thus verifying that this zone is valid.
- An easy prediction down to the Demand Zone that was formed by the red candle on the 20th of December.
- Possible outcomes would be, either a push off this Demand Zone, to one of the outlined Fib levels. Or, a fall through this Demand, to the next short target. (The next Demand below)
www.unitytradinggroup.com

ASX: VTG VITA GROUPI am not confident of Vita's price movement lately. It has broke out of the falling channel but a double top has formed and prices are likely to reverse. Watch out for break and confirmation below $0.93.
Target short @ $0.52.
A price above $1.415 will invalidate this bearish view.
Background: Vita diversification strategy involving a move into cosmetic clinics. Vita Group is best known as the operator of Telstra branded stores.

Swift Network Group SW1:ASX is ready to growSW1 Swift Network Group prices seem to be moving into the apex of the simultaneous triangle. I am expecting a breakout to the upside. The correction at EW2 hits the golden pocket nicely at 0.65. I believe we are going into EW3.

PLG hope or death...PLG hope or death. PLATINUM GROUP METAL shares have seen better days as well. But they are not the ones. The exchange rate has been in a decreasing trend for a long time. The time for a technical rebound is coming slowly. It is equally a question when the decreasing fractal wave structures and the increasing fractal wave structures are changed based on the same ATRs. But now it is time for a growing fractal wave motion. This is also confirmed by the fact that the exchange rate moves on the outside of the ATR axis (orange line). From here I'm waiting for a several-day upward movement. This 0A wave (first half of the green wave) is the target price of 0.6538. Then I look for the correction wavelength of the double fractal structure (Green AB), target price 0.2846. Then there is a rising wave structure.

Bitcoin Group SE (Germany) / Psychology of MarketThe idea of full market cycles is important to understand. “Where” you are within the current long-term investing cycle has everything to do with your long-term outcomes. The psychology of a major bubble follows a similar pattern, but having risen to ridiculous levels of leverage, has very much further to fall. Much greater collective psychological extremes are experienced in a rare period of manic optimism, and its inevitable aftermath.


SFR GROUP Price in 1 hour timeframe with Ichimoku keylevelsI think of a slight bearish trend tomorrow with an initial range of 24.47-24.81 (support-resistance). I think of a bearish trend until 24.47
