GRT

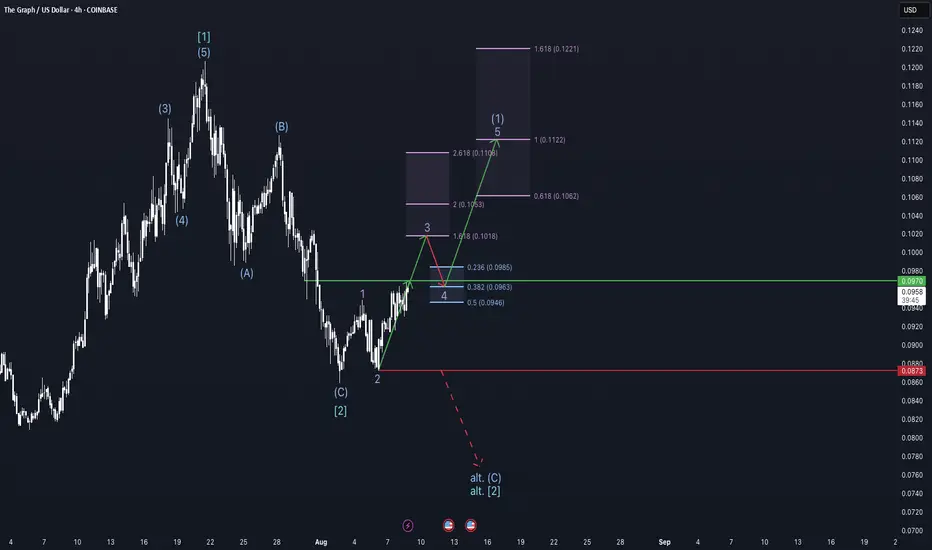
Chasing new highs - GRT weekly update August 8 - 14thThe Graph (GRT) has formed two higher-degree 1–2 setups — one at the Cycle degree and one at the Primary degree — creating a structurally bullish foundation. At the Intermediate degree, price is currently advancing in Wave 1, while at the Minor degree, it is in Wave 3, the most dynamic phase of an impulse. This alignment of early waves across degrees suggests a potentially strong continuation if key resistance levels are broken.
The immediate bullish confirmation comes from a break above the $0.097 resistance, which would open the door for a sustained rally toward the $0.106–$0.122 zone, based on Fibonacci extensions. However, there is an alternative scenario: if the market fails to clear $0.097 and sells off, breaking the $0.0873 support, it would indicate that Intermediate Wave C and therefore Primary Wave 2 are not yet complete. In that case, a final low to complete the larger correction would be expected before the uptrend resumes.
From a sentiment perspective, funding rates are positive, and open interest is rising, showing increasing long exposure. The liquidity heatmap reveals significant liquidity resting below current price, with only minor clusters above — a configuration that could invite a short-term liquidity sweep before continuation.
This setup also needs to be viewed in the context of broader macroeconomic conditions. For much of this year, capital inflows into crypto were limited by the Federal Reserve’s restrictive monetary policy. However, the CME FedWatch Tool now shows a 89.1% probability of a rate cut at the September FOMC meeting. Markets tend to front-run such events, and this expectation could fuel Wave 3 advances across the crypto sector. But with anticipation running high, there is also the risk of a sell-the-news reaction, particularly if retail traders over-leverage into the move.
It’s worth noting that this structure in GRT closely mirrors many other altcoin charts at the moment — a sign of high correlation within the crypto market.
As long as the $0.097 resistance is broken and the $0.0873 level remains intact, the probability favours the bullish scenario — with a multi-degree Wave 3 advance potentially underway, fueled by both technical structure and macro catalysts.
GRT Main trend. 23 02 2025Logarithm. Main trend. Time frame 1 week (no need for less). Hype will be when they promote everything related to artificial intelligence. It may go against the general trend in this regard.
But, at the moment, behind the market, which is logical. I imposed dynamic support/resistance zones of the Gann fan for orientation with the intersection of ordinary key levels (as everyone sees). I showed formations that can be formed and key reversal zones, percentages to them.
Previous closed trading idea +311% / +890%
1️⃣exactly in the designated zones of the planned first “hamster pump” +311%
2️⃣and the maximum pump (planned dump zone) 700-900%
GRT/USDT Main trend. Descending wedge. 8 02 2023
Local trading situation now.
Locally, after collecting long stop-loss at a large % (-27), this zone is held. If the market as a whole is positive, then this zone with 3 trend support points will be the main support for the development of the upward trend.
If this zone is broken, and the price consolidates below the “neck” level, then a decline to the 0.78 zone, that is, the formation of a descending wedge in the secondary trend. There will be a “double bottom” globally. Then, a breakthrough of the wedge resistance, and aggressive pumping under the hype of all that sort of thing.
Scam. Unlikely . Lower declines (implementation of "head and shoulders" without a squeeze) — the likelihood of a scam, that is, tales of hacking and "closure of the project". What is unlikely is how the project is traded in the US on Coinbase, and for this there are consequences for the creators.

GRT Main Trend (addition) Double Bottom + Triangle 08 2025Logarithm. Time frame 1 week.
Main trend . Supplement for clarity to the previous idea for this cryptocurrency, published 23 02 2025 Everything is essentially the same, the new idea is made to visualize the trend, nothing more.
GRT Main trend.
Line chart, price now
Secondary . Big double bottom (in any case, with local scenario A or B, it will be realized in the medium term).
Local trend (price movements in the trend minimum zones before a big pump). Triangle above the Gann fan ray (see the previous idea, where this tool of the logic of movement in the trend is shown).
The second wave of the triangle is formed.
A downward breakout is a descending pennant, which is the removal of longs under the pattern of a larger scale of historical minimums.
A upward breakout is the realization of the triangle targets, and the price movement to the descending line of the main trend +80-100%
GRT/USDT Weekly Analysis — “Life or Death Zone” for The Graph!🟡 🔥 Critical Zone: Demand Area in Play!
The Graph (GRT) is retesting one of its most critical historical demand zones — the $0.0700 to $0.0897 area — a level that has acted as strong support multiple times since mid-2022.
> This zone is not just a support — it’s a make-or-break level that has defined the survival of the GRT trend on the higher timeframes.
The current price action shows hesitation, low volatility, and potential accumulation — all classic signs that a major move is brewing.
---
📊 Technical Structure & Price Behavior
GRT has been trading in a wide sideways channel after a long-term downtrend, with multiple bounce attempts off this demand zone.
No higher highs have been confirmed since the last rally towards $0.24.
Volume appears to be declining, indicating compression before expansion.
Price has failed to break and sustain above key resistance levels, hinting that buyers are cautious — or waiting for macro confirmation.
---
🐂 Bullish Scenario: Accumulation & Breakout Potential
If buyers continue to defend the $0.0700–$0.0897 zone, and GRT can break above short-term resistance at $0.1281, this could confirm a reversal structure or at least a mid-term relief rally.
🎯 Potential Bullish Targets:
1. $0.1281 – minor local resistance
2. $0.1868 – structural breakout level
3. $0.2402 – previous rejection zone
4. $0.3233 – historical supply
5. $0.4352 & $0.5285 – macro targets if momentum builds
> A breakout above $0.1868 with volume could kickstart a trend reversal towards the $0.30–$0.50 region.
---
🐻 Bearish Scenario: Breakdown Below Demand
However, if GRT loses the $0.0700 key support, this would invalidate the accumulation thesis and potentially trigger panic selling.
⚠️ Bearish Breakdown Targets:
$0.0450 – intermediate support
$0.0300 – all-time low and last line of defense
> A breakdown would likely signal a return to macro bearish sentiment and a reset of the entire structure.
---
🔄 Market Psychology: The Calm Before the Storm?
We are in a classic zone of indecision, where both bulls and bears are waiting for a confirmation. This setup is often followed by high-volatility breakout or breakdown moves.
Traders and investors alike should be watching this area very closely.
---
📌 Strategic Summary:
Strategy Type Action
Long-term Investors Accumulation with strict stop below $0.0700
Swing Traders Wait for breakout of $0.1281 with confirmation
Risk-Averse Traders Avoid until direction is clear above $0.1868 or below $0.0700
#GRT #GRTUSDT #CryptoAnalysis #AltcoinUpdate #TechnicalAnalysis #SupportAndResistance #CryptoBreakout #DemandZone #AltcoinWatchlist #CryptoReversal #TheGraph
GRT/USDT at a Crossroads: Golden Pocket Retest or Breakdown?The GRT/USDT chart is currently at a critical technical juncture, presenting a high-probability setup for both breakout continuation or breakdown rejection. Here’s a breakdown of the key elements visible on the chart:
---
📐 1. Major Downtrend Breakout
GRT has been in a long-term downtrend since its peak in late 2024, with a well-respected descending trendline acting as resistance.
In mid-July 2025, the price broke above this trendline, signaling a potential trend reversal from bearish to bullish.
While volume was moderate, the breakout is technically valid.
---
📊 2. Golden Pocket Fibonacci Retest
Price is currently retesting the critical Fibonacci retracement zone:
0.5 = $0.09453
0.618 = $0.08941
This range is widely known as the “Golden Pocket”, a high-probability bounce zone during bullish continuation setups.
Price is currently sitting inside this zone, which makes this a potential low-risk entry area.
---
🧱 3. Key Historical Consolidation Zone
The area between $0.089 and $0.095 is not only the golden pocket but also aligns with a strong historical consolidation zone from April to June 2025.
This level acted as both support and resistance, making it a key technical and psychological level.
---
⚔️ Potential Price Scenarios
---
📈 Bullish Scenario (Upside Potential):
If price holds and bounces from the $0.089 – $0.095 support zone:
1. Initial resistance targets:
$0.10185 to $0.11000
2. Followed by breakout targets:
$0.11625
$0.12987
$0.14748
3. Medium-term bullish targets if trend continues:
$0.19021
$0.23545
📌 Bullish Confirmation Signs:
Bullish engulfing or strong reversal candle on the daily close.
Increased volume on the bounce.
RSI recovery from neutral (30–50) zone.
---
📉 Bearish Scenario (Downside Risk):
If price fails to hold above the $0.08941 Fibonacci level:
1. A breakdown below support may trigger further selling pressure.
2. Key downside targets:
$0.08000 (minor support)
$0.06629 (previous swing low)
📌 Bearish Confirmation Signs:
Daily close below $0.089 with strong bearish volume.
RSI drops below 30.
Strong rejection from resistance with bearish structure.
---
🧠 Pattern and Market Structure Insights
Breakout + Retest: Classic setup where price breaks a long-term trendline and returns to retest the breakout zone.
Fibonacci Confluence: The golden pocket aligns with previous price structure, reinforcing its strength.
Hidden Double Bottom (Potential): If price holds, this may also form a subtle double bottom structure — a bullish continuation signal.
---
📚 Conclusion & Trading Strategy
GRT/USDT is currently showing a technically strong setup, with a clean breakout followed by a meaningful retest at a key demand zone.
💡 If you're looking for a strategic long entry, this area offers low risk, high reward potential, provided you manage your stop-loss correctly.
---
🎯 Trade Idea & Risk Management
Potential Entry: $0.089 – $0.095
Conservative Stop Loss: Below $0.088
Initial Target Zone: $0.101 – $0.116
Mid-term Target: $0.19 – $0.23
#GRT #GRTUSDT #TheGraph #AltcoinAnalysis #CryptoBreakout #TechnicalAnalysis #CryptoTrading #FibonacciLevels #TrendlineBreak #GoldenPocket #BullishSetup #BearishBreakdown #CryptoEducation #Altcoins

GRT Short Term BullishOverall this crypto is very weak. Most alts are weak, with few exceptions. The Graph has actually been non-stop building even though the coin has bled out for 4+ years. I doubt the long-term trend is bullish, but on the short term, it looks like a standard head and shoulders pattern on the 1-hour. On the 4-hour we have a golden cross - although every other time frame is so bearish.
I started buying some on the left shoulder while it fell in the target zone; I loaded the trade fully on 40x leverage after the right shoulder completed and broker through the zone of resistance.
Looking to see a break of $0.13, which is the top of the head pattern. If we see blow off top in crypto, it should break through decisively over the next 30 days and we could see low .20s
Anything is possible but I may be out of this trade by the time you read this. Not Financial Advice. Probably completely random nonsense.

Is a Breakout Imminent for #GRT or Another Bull Trap is Ahead?Yello, Paradisers! Are we looking at a clean breakout setup that could send #GRT flying or is this the perfect trap to wipe out early bulls? Let's see the latest #GRTUSDT moves:
💎The daily chart on #GRTUSD is showing a perfectly formed descending channel, with price now hovering just above the lower boundary—a zone that has consistently held as strong descending support. After multiple rejections from the upper boundary and rebounds off the lower trendline, the price has now shown its first serious signs of momentum since bottoming in the strong demand zone
💎This structure has been in play since early May for #TheGraph, with each bounce from the support line giving temporary relief, only for the price to get slapped down at the descending resistance. But this most recent bounce looks different—it’s happening directly above a well-defined demand zone between $0.0668–$0.0700, a level that has historically attracted strong buyer interest.
💎A breakout above the descending resistance trendline, ideally with a strong daily close above $0.085–$0.090, would invalidate the bearish pressure and likely trigger a sharp leg up. The mid-term resistance sits around $0.1032, and clearing that would open the door to a retest of $0.1318, a level that previously acted as a strong rejection zone.
💎If the price fails to reclaim the descending channel and rolls over again, especially losing $0.0668 on a daily close, the bullish structure would be invalidated. That would shift focus toward the support zone at $0.053, and if that breaks, the next target becomes $0.0300—a brutal drop that would liquidate most late longs and signal deeper downside.
Stay disciplined. The next big opportunity will come to those who wait, not those who chase.
MyCryptoParadise
iFeel the success🌴

Can the Graph chart a recovery rally into resistance?Quite a few multiples if it can!
Entires in the support band represent low risk entries
(compared to last cycles elevated valuation's)

GRT/USDT at a Critical Point! Reversal Structure or Breakdown?📊 Full Technical Analysis – GRT/USDT (1W Timeframe)
🔎 Overview:
GRT is currently positioned at one of the most critical technical levels in its long-term structure. After a prolonged downtrend from the $2.88 all-time high, price is once again testing the historical demand zone between $0.07 – $0.09, which has repeatedly acted as a strong support level since mid-2022. This area represents a major accumulation zone, where smart money may be silently positioning.
🧠 Structure & Pattern Formation:
✅ Historical Demand Zone (Major Support Area):
The $0.07 – $0.09 range has been tested over 5 times in the last 2 years, showing strong demand.
This zone also acts as the potential base of a double bottom pattern, indicating a possible macro reversal.
🟡 Double Bottom Potential (Reversal Pattern):
Two nearly equal lows forming around this demand area hint at a classic double bottom formation.
Confirmation comes if price breaks and holds above $0.1281 resistance.
🔻 Declining Selling Pressure:
Sellers appear to be losing momentum, as seen in the declining weekly volume.
This could signal distribution is ending and accumulation is underway.
📈 Bullish Scenario:
If GRT holds this critical support and breaks above key resistance, a strong mid-term rally may follow:
1. Breakout Confirmation:
Valid if the weekly candle closes above $0.1281.
2. Upside Targets (Fibonacci + Historical Resistance):
🎯 $0.1868 → minor resistance / past consolidation zone.
🎯 $0.2402 → previous rejection area.
🎯 $0.3233 → key Fibonacci retracement level.
🎯 $0.4352 → strong horizontal resistance.
🎯 $0.5285 → mid-term bullish target.
3. Ideal Bullish Conditions:
Bullish divergence on the weekly RSI.
Increasing volume on breakout confirmation.
📉 Bearish Scenario:
If the support fails to hold, GRT could face further downside:
1. Breakdown Below $0.07 – $0.09 Zone:
⚠️ $0.0550 → minor support.
⚠️ $0.0300 → All-Time Low and psychological support.
2. Deeper Risk:
If panic selling occurs or broader market sentiment worsens, GRT may print new lows, continuing its long-term bearish trend.
🧭 Conclusion & Strategy:
> GRT is in a highly interesting accumulation phase from a technical perspective.
The risk-to-reward from this support zone is attractive, with signs of a potential reversal building. However, traders should wait for confirmation and always use proper risk management.
Entry Strategy:
Speculative entry: inside the $0.08–$0.09 zone (tight stop-loss below $0.07).
Confirmed entry: after breakout and weekly close above $0.1281 (targeting levels mentioned above).
#GRT #TheGraph #GRTUSDT #CryptoReversal #DoubleBottom #SupportZone #AltcoinSetup #BullishCrypto #BearishRisk #TechnicalAnalysis

GRTUSDT 1W AnalysisGRT ~ 1W Analysis
#GRT Buy back gradually from here with a short term target of at least 20%+ from this support.

$GRT IS ABOUT TO GO Graph ( JSE:GRT ) is about to go. Zoom in and out and see it for yourself. History will always repeat itself. You can see the short term targets

Maintaining support is necessary, not essential, for the climb.Hello friends🙌
🔊Given the price drop, you can see that the support we identified has worked well for you so far and buyers have supported the price.
Now, given the heavy price drop and disappointment in the market, we can expect a rise until the targets are set.
Don't forget capital and risk management, friends.🙏
🔥Join us for more signals🔥
*Trade safely with us*
GRT | Altcoins | MASSIVE UPSIDE Potential on The GraphAnother altcoin that has great upside potential is the Graph BINANCE:GRTUSDT
The Graph from a weekly perspective may seem like there's not much action, but if you zoon in to the daily timeframe we see a different picture.
WEEKLY:
VS DAILY:
We can see anything from a +40% increase to a -30% dip in just a few days; a picture that is lost when we look at the weekly. This is IDEAL for swing trading.
Once you've established the general direction from the MACRO, swing trades become very viable (spot). If your patient enough to wait for a few days, a +30% could easily be achieved within a two week timespan.
______________________
BINANCE:GRTUSDT

GRTUSDT 1D AnalysisGRT ~ 1D Analysis
#GRT On the 1D time frame the selling pressure has stopped.. Buy on this support block with a short term target of at least 10%+ from here.

GRT Analysis (12H)From the point where we placed the red arrow on the chart, it seems that a large-degree triangle on the GRT chart has completed, and we are now in a new wave sequence.
In these new downward waves, wave A/W has completed, and it now appears we are in the middle of wave B/X.
We are looking for a rebuy opportunity around the green zone.
It is expected that during the middle of wave B/X, there will be a correction down toward the green zone, followed by an upward move to continue wave B/X.
A daily candle closing below the invalidation level will invalidate this analysis.
For risk management, please don't forget stop loss and capital management
Comment if you have any questions
Thank You

Is it time to buy?Hello friends✌
Given the good price growth and the arrival of buyers, now that the price is correcting, it is the best time to buy.
🙏If you like it, support it with a ✔like✔ and ✔comment✔.
*Trade safely with us*
GRTUSDT 1D AnalysisGRT ~ 1D Analysis
#GRT Buy when re -testing this support block or buy after successfully penetrating this resistant line with a short -term target of at least 10%+.

#GRT/USDT#GRT
The price is moving within a descending channel on the 1-hour frame, adhering well to it, and is on its way to breaking it strongly upwards and retesting it.
We are seeing a bounce from the lower boundary of the descending channel, which is support at 0.0956.
We have a downtrend on the RSI indicator that is about to break and retest, supporting the upward trend.
We are looking for stability above the 100 moving average.
Entry price: 0.1010
First target: 0.1033
Second target: 0.1065
Third target: 0.1110

The Graph: Your Altcoin ChoiceCan The Graph really grow by 6,000% in 2025?
I don't know, seems like a lot but I also have some more conservative targets.
$2.04 can yield a huge 2,493% from current levels. This is GRTUSDT moving up and not hitting a new All-Time High in 2025. There is a long long-term higher low and higher lows tend to lead to higher highs, which means that an All-Time High is indeed possible.
Another conservative target sits at $1.18 for 1,400% from current levels. There are also several lower, short-term targets mapped on the chart.
The Graph peaked super early in 2021, in February. The rest of the market peaked in April, May and many pairs in November 2021. So this is almost erratic behavior. This is good for the long-term and for the 2025 bull market. When projects move in unique ways, it tends to be a positive.
The project has been solid and strong. The chart is also good with good price action, a nice design and reasonable growth. The action is happening now near the same levels as the September 2023 low support. From here, prices can grow.
It can take a few days, maximum several weeks for the start of the next bullish wave. May for certain but never beyond. In fact, the bottom might be in now and we are gearing up for up for months.
I will not give you more as this is enough... A full bull market can develop within 6 months. Sometimes it can take 12 months or 16 months, but at other times, a pair can produce all the action in less than 6 months. This might be one of those.
Be prepared.
Thank you for reading.
Feel free to leave a comment with your questions.
If you enjoy the content just follow.
Namaste.

GRTUSD - Falling WedgeA falling wedge idea
I think the down trend in white will be retested before the true breakout
After that the falling wedge pattern can act on its bullishness
Daily chart

GRT: Current SituationYou asked, and we delivered:
GRT is trading at 0.0930 USDT, down over 70% from its September peak of 0.3600 USDT, reflecting a steep decline amid a broader crypto market dip (total market cap down 4.4% in the last 24 hours). The price is testing a critical support zone at 0.0900-0.0930 USDT, with bearish signals dominating: it’s below the moving average, and indicators like MACD suggest ongoing selling pressure. A falling wedge pattern hints at a potential reversal, but volume is needed to confirm any breakout. The market’s cautious mood amplifies GRT’s struggles, making this a pivotal moment.
Technical Indicators and Key Levels
Short-Term (4-Hour Chart):
Support: 0.0900-0.0930 USDT (critical), 0.0800 USDT
Resistance: 0.1000 USDT, 0.1200 USDT
Indicators: RSI near oversold (~30), MACD bearish. A hold above 0.0900 USDT could spark a bounce to 0.1000 USDT.
Long-Term (One-Year Chart):
Support: 0.0800 USDT, 0.0600 USDT
Resistance: 0.2000 USDT, 0.3000 USDT
Holding 0.0900 USDT is key for any recovery; below risks a deeper slide.
Potential Scenarios
Bullish Case: Hold 0.0900 USDT, break 0.1000 USDT with volume → target 0.1200 USDT (short-term), 0.2000 USDT (long-term).
Bearish Case: Break below 0.0900 USDT → test 0.0800 USDT or 0.0600 USDT.
Volume is critical—watch for spikes to confirm moves.
Broader Context and Tips
GRT’s role in decentralized indexing supports long-term value, but short-term risks loom. Traders should focus on 0.0900 USDT, a hold could signal a bounce, a break risks more downside. Use tight stops (e.g., below 0.0900 USDT for longs) and stay alert for volume shifts or news on adoption. Long-term, accumulating near 0.0900 USDT or 0.0800 USDT could pay off if the market turns.

GRTUSDT 1WGRT ~ 1W Analysis
#GRT Buy gradually from here if you still have a Conviction on this Coin with a minimum target of 20%+.
