GS inside day after earningsGS has a inside day after earnings, and it's one of my favorite trade!
The stock futures had a little bit plunge this afternoon as the news about Spain, while in terms of inside day, we won't be afraid of news.
What we focus on more is the direction it breaks.
If it's able to break to the upside, it means it shows great relative strength and it's still a nice long; If it breaks to the downside, then it will pretty much be a short-term trade as I am not bearish with the stocks yet.
Also, there is a potential bat pattern entry
I drew this kind of pattern several times as it can give different strategy depending on different kinds of scenario, so I have a clear mindset to deal with the unpredictable market movement.
GS


6.5.2017 Trade Idea: GSIf you are interested in more of our trades, check out our profile and Tradingview Indicator @ChaoticTrader

BTC/USD symmetrical shortingCurrently being abused like a biotech small cap..Hedgies and banks could be setting up for big buy-ins
www.zerohedge.com

GS Long from 205.50-204.50After GS top of 255 This Winter, It now approaches a critical target price of 205$. Today it trades at 213$ a share.
GS is a buy at 205-204, however, if it slips below 200 and holds at 199-198, then we will likely see a decline of at least another 15 points, likely finding a bottom around 185 or 178.
IF it does not find a bottom even at 178, we will likely see another decline, this time toward 155 or 150 dollars a share.
These are the options for price bottoms right now.

Possible Short position on Goldman Sachs (GS)While some are junked up on this trade, I'm absolutely bearish from the magic box, nice target around 198.15.
Have a good trading week!!


GS - Goldman Sachs again above the centerlineThey managed to crawl above the centerline. again, even in the weekly.
The little pressure favors the momentum for the long side.
Looking for a long entry, up to the U-MLH or to the moon...
P!


The Goldman ShortMight get a bounce at -1.11. If you're lucky you'll catch some shares to short at $1. In all reality, this stock is going to 200 after their earnings call, so there is "no risk" in this trade.

This is a really big divergenceThink the banks are heading south soon.
Also a five wave up is done at a minimum level.
This is similar to the rates wave count.
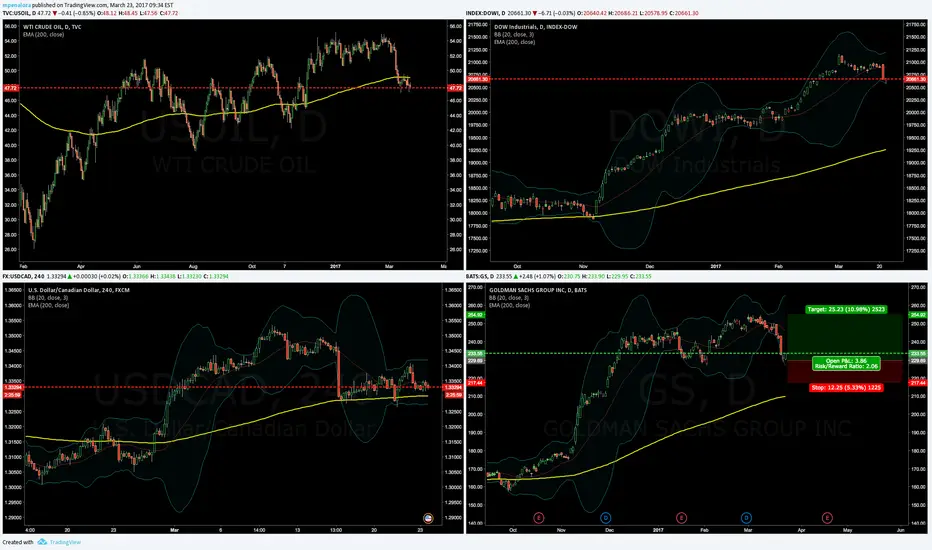
Long Goldman Sachs The financial sector is having a tough week. Today the sellof looks like its pumping the brakes, and the set up for Goldman Sachs looks really nice. The support @ 228 looks like its working just fine, and we could be looking to take long positions towards the 250-254 ressistance.
Goldman Sachs - rising trend breached amid flatter yield curveA flatter yield curve us bad news for the banking stocks.
Bearish price RSI divergence followed by a breach of the rising trend line suggests the 50-DMA support of 243 could be put to test.
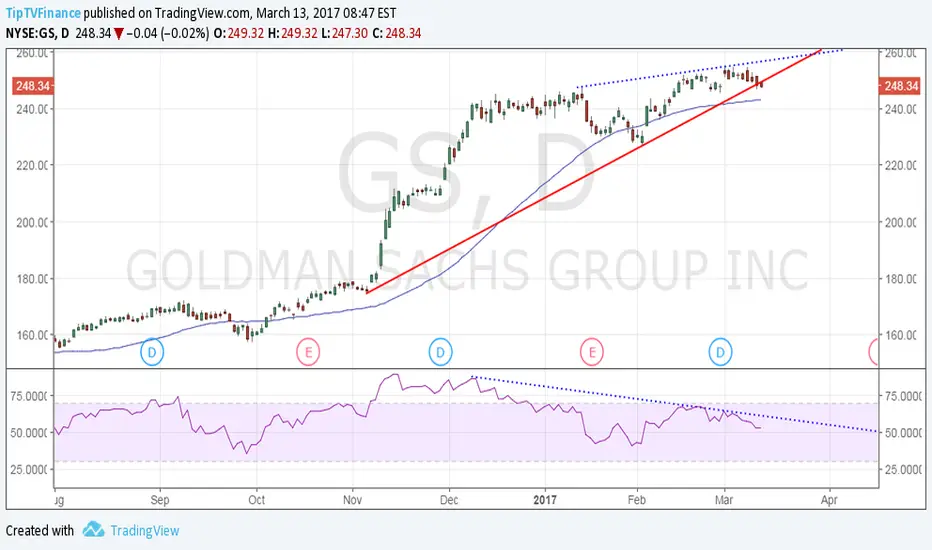
Goldman Sachs - Flattening yield curve, bearish outside day Correction could gather pace as the treasury yield curve continues to flatten. Meanwhile, we have a bearish price-RSI divergence and a bearish outside day candle on the daily chart. The share price could drop to 230 levels


JPM continues to see strengthWith the enactment of deregulation on Dodd-Frank, large banks are gapping up to a higher level. Since Trump's election, JPM has jumped almost 30% and it's gonna retest 88 so as to open the new territory.

GS @ 1h @ it smeels like an shortterm selloff, last trading daysTake care
& analyzed it again
- it`s always your decision ...
(for a bigger picture zoom the chart)
Best regards :)
Aaron


GS @ daily @ highest H/L-Range (dow shares) last weekThis is only a trading capability - no recommendation !!!
Buying/Selling or even only watching is always your own responsibility ...
.zip (with PDF`s) @ my Google Drive
drive.google.com
4XSetUps for next week - friday close (DOW 30 Index & all shares)
Best regards :)
Aaron


$GS Base and Breakout Setup (long)The key to trade this kind of setup is the Buy Stop on a breakout. Without breakout or breakout on the wrong side
--> THE ENTRY IS NOT CONFIRMED.
You can choose to buy breakout pullback though, i.e. after the breakout, wait for the pullback to test the breakout point then buy. This is much safer method but sometimes there’s simply no pullback after the breakout. A compromise might be half to buy breakout and half to buy pullback.

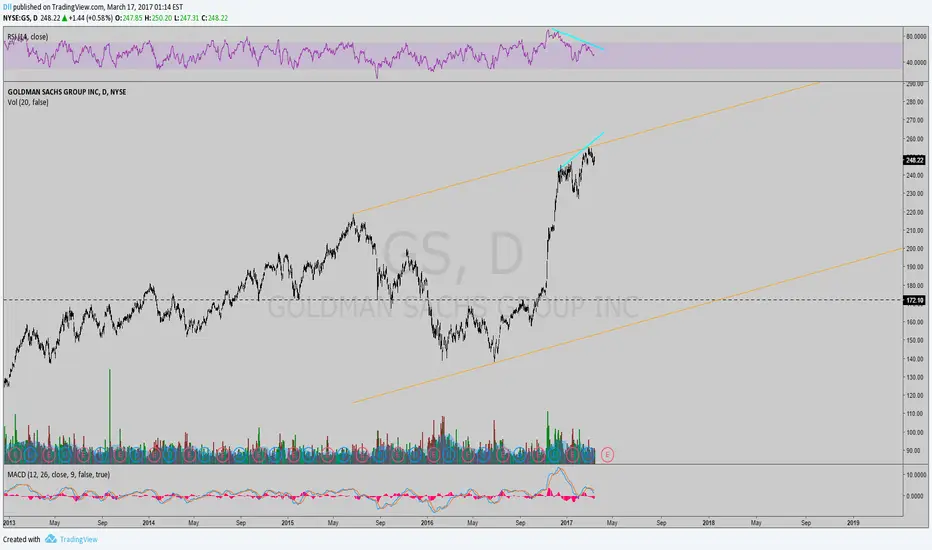
Something DifferentI don't usually trade equities, but a fellow trader told me to take a look at the Goldman Sachs chart...
Price is currently consolidating near the 10 year high of $250.70, after a huge bullish run in the second half of 2016. For me, what I'd be looking for now is a break & retest of this $10 channel, with targets around $218.00 and $200.00 (good psychological level), which would profit between $19 and $37/share.
The icing on the cake for me was a quick look at the RSI, which shows clear bearish divergence on both the daily and 4H chart..... IF we do in fact see the breakout, it could happen within the next few days, or next week Tuesday when earnings comes out, which is estimated to be worse than last quarter.
**Full Disclosure : Even if this setup works out in the end, I probably wont be trading it, just a first glance analysis.**
