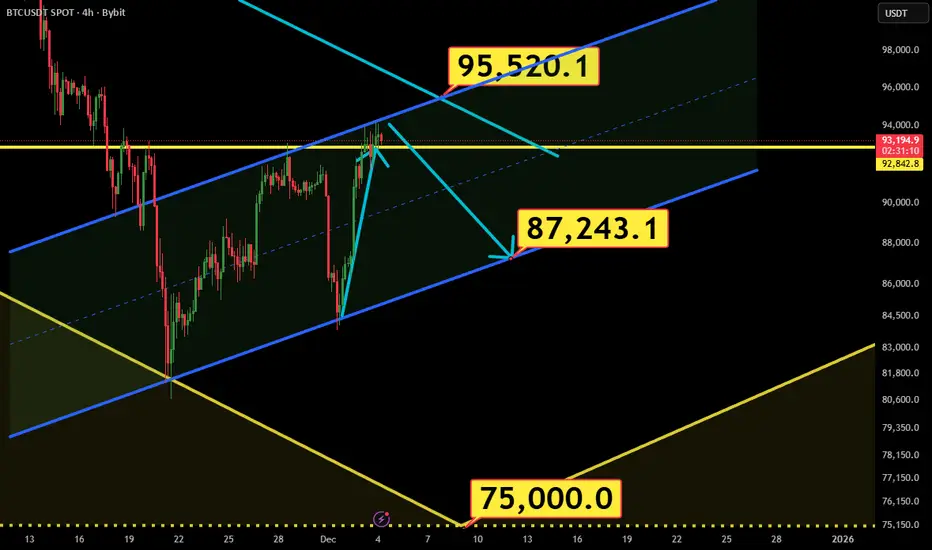
Not ready yet!If Bitcoin fails to secure a 12-hour close above 95,000, a corrective move toward 87,000 and even 75,000 remains on the table. However, one way or another, the market structure is ultimately poised to break upward toward 108,000.
Harmonic Patterns
GBPUSDHello Traders! 👋
What are your thoughts on GBPUSD?
The GBPUSD pair has successfully broken above a key bearish trendline and cleared a resistance zone, signaling a shift in momentum toward the upside.
At the moment, price is reacting to a minor resistance level, where some hesitation and short-term fluctuations are visible — a natural behavior following a strong impulsive move.
After a brief consolidation or minor correction in this zone, we expect a continuation to the upside, with price likely pushing through this resistance and heading toward the next target levels.
Don’t forget to like and share your thoughts in the comments! ❤️

Bitcoin - This cycle is totally clear!🚨Bitcoin ( CRYPTO:BTCUSD ) enters the next bearmarket:
🔎Analysis summary:
Bitcoin always creates textbook cycles. And after every retest of the major resistance curve, Bitcoin started a major bearmarket. Since we already witnessed bearish confirmation, Bitcoin is heading for a new correction. Just let it play out.
📝Levels to watch:
$60,000
SwingTraderPhil
SwingTrading.Simplified. | Investing.Simplified. | #LONGTERMVISION

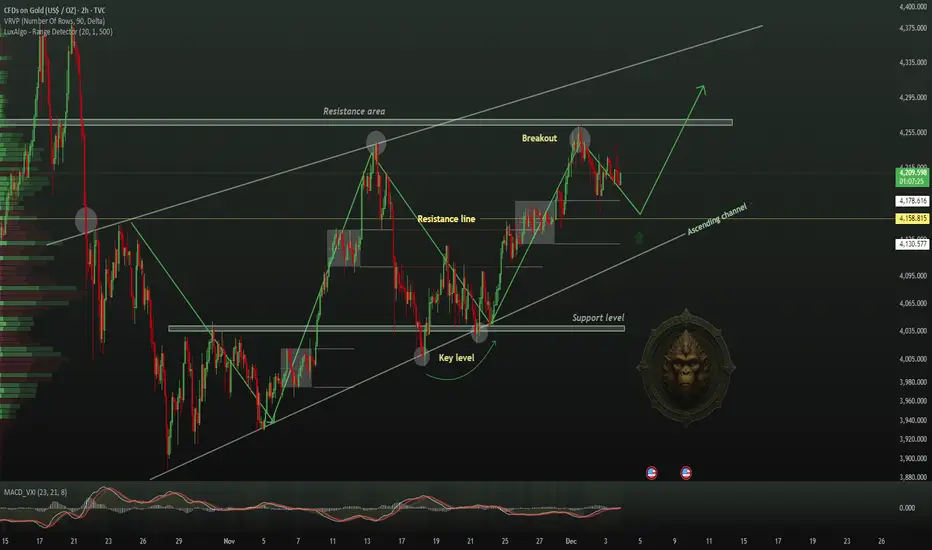
XAUUSD – Sideways Ahead of the CPI CatalystGold is currently in a “holding pattern” as the market waits for the U.S. CPI data on December 5. Rising U.S. Treasury yields are putting pressure on prices, but the USD dropping to a 1-month low is helping to cushion the downside. At the same time, labor data remains mixed — initial jobless claims fell sharply , while ADP reported a steep decline in private employment — leaving traders without a clear directional bias. As a result, XAUUSD is stuck in a sideways phase.
On the chart, gold is ranging between 4,200 – 4,280:
4,200 → strong support, aligned with the ascending trendline and Ichimoku cloud base.
4,280–4,300 → strong resistance where sellers consistently appear.
Price action shows buyers holding a slight advantage: candles repeatedly bounce from support, the trendline remains intact, and the Ichimoku cloud supports price like a cushion. However, bullish momentum is still not strong enough to break through 4,280 as the market remains cautious ahead of CPI.
Likely scenario: XAUUSD will continue oscillating within this sideways box — retesting 4,200 then moving back toward 4,280. A clear breakout will depend entirely on the CPI release:
Break above 4,280 → opens the path to 4,300+
Break below 4,200 → signals a deeper correction
For now, the best approach is range trading and waiting for a decisive signal after CPI.

BITCOIN Mayer Multiple shows the way to the Bear Cycle bottom.Bitcoin (BTCUSD) remains on a short-term rebound, as mentioned before, a standard counter-trend/ dead cat bounce during Bear Cycles.
Here you see the Mayer Multiple Bands (MMB), an indicator we've used countless times to determine tops, bottoms and general trends of a Cycle. This time we plot this simple yet powerful tool to make an early estimate on the potential bottom of this Bear Cycle.
We will keep this short as there is no reason to overcomplicate things, especially at this stage. BTC is as we said on a small rebound currently after almost testing the 2SD below (blue trend-line) of the MMB. On all previous Bear Cycles show on this chart, every time this happened, the market bounced and consolidated then.
When the 2SD below trend-line broke, the market reached the 3SD below (green trend-line) rather aggressively and quickly. In all instances, that was the Bear Cycle bottom, with the only exception being the 2022 Bear Cycle, which gave one last short-term rebound/ consolidation and bottomed when it broke below the 1W MA300 (red trend-line).
The 1W MA300 has historically had a hidden but key role on BTC Cycles. When tested, always after the initial MMB bottom, it provided a 2nd and final opportunity to enter (buy) the new Bull Cycle at such a low price.
It is possible to see something like that happen again. With its course (1W MA300), assuming the current Bear Cycle also lasts for around 52 weeks (364 days) like the previous two, we estimate it to be a little under $60000 by October 2026. The MMB 3SD below though could be by that time around $40000. It is possible of course that we breach the 1W MA300 (much) earlier thus at a lower price, meaning also potentially hitting the MMB bottom a little higher.
In any case the bottom range seems roughly by $60k - $40k. Since determining the Cycles (hence Tops - exits, Lows - entries) has always been more about timing and less about pricing, this is why we've discussed before that it would be a good idea to start buying (call it DCA if it suits you better) around $60k. As always, however, these are just the facts. The decision is yours.
So at what price do you think this Cycle will bottom? Feel free to let us know in the comments section below!
---
** Please LIKE 👍, FOLLOW ✅, SHARE 🙌 and COMMENT ✍ if you enjoy this idea! Also share your ideas and charts in the comments section below! This is best way to keep it relevant, support us, keep the content here free and allow the idea to reach as many people as possible. **
---
💸💸💸💸💸💸
👇 👇 👇 👇 👇 👇

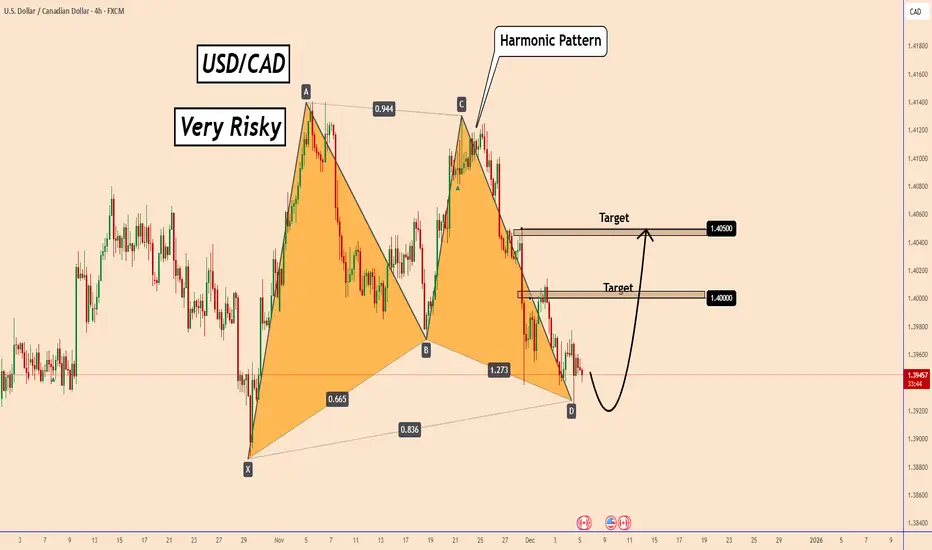
USDCAD: FED Cut Speculation Keeps Pair on a TightropeUSDCAD: FED Cut Speculation Keeps Pair on a Tightrope
In the current environment, where the market expects the FED to cut rates next week by 25 to 50 basis points, trading USDCAD comes with a very high level of risk.
The market today will also speculate on the US PCE data and its potential impact on the FOMC's rate cut decision.
US PCE is expected to be 2.8% vs. 2.7% YoY and Core PCE data is expected to be 2.9% vs. 2.9% YoY.
A higher reading could help the US dollar show some strength. However, I think with small deviations, a 25 basis point cut is already possible, and it was already priced in, so we should be cautious.
You may find more details in the chart!
Thank you and Good Luck!
❤️PS: Please support with a like or comment if you find this analysis useful for your trading day❤️
EURUSD – The Dollar Weakens, Uptrend Takes OffIf there is one currency pair currently favored by macro conditions, EURUSD is clearly at the top. The U.S. dollar keeps weakening as recent economic data remains poor, with ADP showing a drop of 32,000 jobs , and expectations for a Fed rate cut next week rising sharply. Meanwhile, political uncertainty surrounding Trump’s plan to appoint a new Fed Chair further pressures the USD. In contrast, the euro is trading near a 7-week high and is on track for its strongest yearly gain since 2017.
On the 2H chart, EURUSD is moving cleanly inside an ascending channel : price is riding the lower boundary and gliding above the Ichimoku cloud — a sign of a strong bullish structure where dips are simply pauses. The area around 1.1640 acts as a key support level, aligning with the channel bottom, the Ichimoku cloud, and a small demand zone previously respected by the market.
The main scenario: price may dip slightly toward 1.1640 to accumulate liquidity, then rebound following the prevailing trend toward the 1.1700–1.1703 target zone, and potentially higher toward the channel top. As long as EURUSD stays above 1.1640 and does not close decisively below the Ichimoku cloud, the dominant direction remains bullish, favoring buy-the-dip strategies rather than counter-trend selling.

05.12.25 Daily ForecastPairs on Watch -
FX:EURUSD
FX:AUDUSD
A short overview of the instruments I am looking at for today, multi-timeframe analysis down to what I will be looking at for an entry. Enjoy!


GOLD BUY | Idea Trading AnalysisGOLD is moving in an ascending channel and creating symmetrical triangle and is moving in a descending AND is moving in an UPWARD channel.
We expect a decline in the channel after testing the current level.
Hello Traders, here is the full analysis.
I think we can soon see more fall from this range! GOOD LUCK! Great BUY opportunity GOLD
I still did my best and this is the most likely count for me at the moment.
-------------------
Traders, if you liked this idea or if you have your own opinion about it, write in the comments. I will be glad
COINBASE entering a brutal Bear Cycle. 1st Stop = $150Coinbase (COIN) has been on a strong decline since its July All Time High (ATH) and right now is within the 1W MA50 (blue trend-line) - 1W MA100 (green trend-line) range. This is similar so far to the correction phases since March 2024 that found a bottom on the Support Zone but more importantly looks identical to the start of the 2022 Bear Cycle.
Based on the latter, after the current 3-wek consolidation is over, the stock should decline more, towards the 0.236 and 0.382 Fibonacci levels. The latter is where the Support Zone is, hence our medium-term Target is $150.00 (marginally above).
If the Support Zone breaks and the market keeps mirroring the 2022 Bear Cycle, we are looking at a brutal sell-off that could be as low as $54.00 (Fib 0.786) and $32.00 (Fib 1.0). Notice that in 2022, the most efficient bottom buy signal was given initially by a massively oversold 1W RSI (nearly 20.00) and finally confirmed by a Higher Lows Bullish Divergence of the same indicator. Use that to time the bottom to your advantage regardless of the price and buy for the next long-term Bull Cycle.
---
** Please LIKE 👍, FOLLOW ✅, SHARE 🙌 and COMMENT ✍ if you enjoy this idea! Also share your ideas and charts in the comments section below! This is best way to keep it relevant, support us, keep the content here free and allow the idea to reach as many people as possible. **
---
💸💸💸💸💸💸
👇 👇 👇 👇 👇 👇

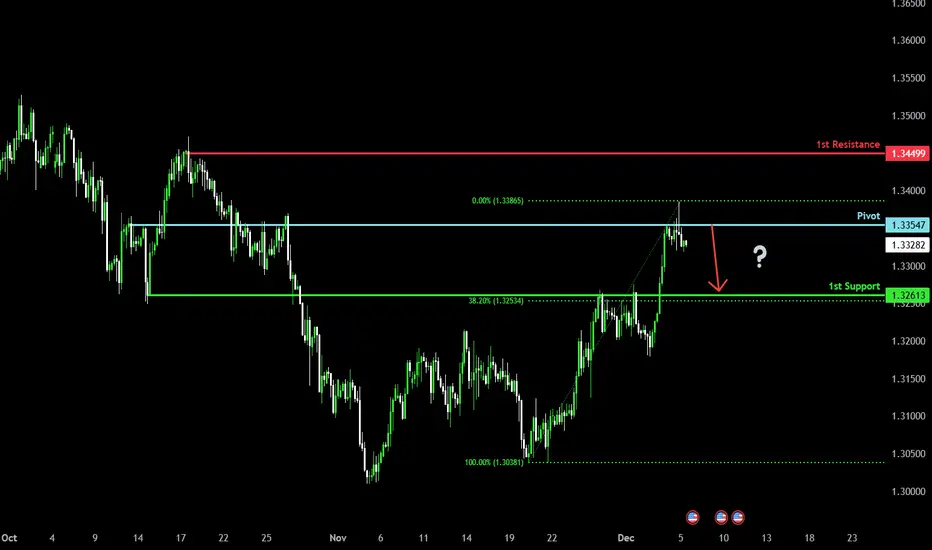
Could we see a reversal from here?Cable (GBP/USD) has rejected off the pivot and could drop to the 1st support.
Pivot: 1.3354
1st Support: 1.3261
1st Resistance: 1.3449
Disclaimer:
The opinions given above constitute general market commentary and do not constitute the opinion or advice of IC Markets or any form of personal or investment advice.
Any opinions, news, research, analyses, prices, other information, or links to third-party sites contained on this website are provided on an "as-is" basis, are intended to be informative only, and are not advice, a recommendation, research, a record of our trading prices, an offer of, or solicitation for, a transaction in any financial instrument and thus should not be treated as such. The information provided does not involve any specific investment objectives, financial situation, or needs of any specific person who may receive it. Please be aware that past performance is not a reliable indicator of future performance and/or results. Past performance or forward-looking scenarios based upon the reasonable beliefs of the third-party provider are not a guarantee of future performance. Actual results may differ materially from those anticipated in forward-looking or past performance statements. IC Markets makes no representation or warranty and assumes no liability as to the accuracy or completeness of the information provided, nor any loss arising from any investment based on a recommendation, forecast, or any information supplied by any third party.
Small scalp degen move. This is an intraday scalp for degens who like to squeeze the juice. Fundamentals back the theory due to accumulation during a bear channel.

GBP/JPY M30 | Bearish Drop OffMomentum: Bearish Drop
Price may push back up toward the sell entry, which acts as pullback resistance and aligns with the descending trendline, showing clear bearish pressure.
Sell Entry: 206.51
Pullback resistance
Stop Loss: 206.89
Pullback resistance
Take Profit: 205.91
Pullback support / 78.6% Fibonacci retracement
High Risk Investment Warning
Stratos Markets Limited (tradu.com ), Stratos Europe Ltd (tradu.com ):
CFDs are complex instruments and come with a high risk of losing money rapidly due to leverage. 70% of retail investor accounts lose money when trading CFDs with this provider. You should consider whether you understand how CFDs work and whether you can afford to take the high risk of losing your money.
Stratos Global LLC (tradu.com ): Losses can exceed deposits.
Please be advised that the information presented on TradingView is provided to Tradu (‘Company’, ‘we’) by a third-party provider (‘TFA Global Pte Ltd’). Please be reminded that you are solely responsible for the trading decisions on your account. Any information and/or content is intended entirely for research, educational and informational purposes only and does not constitute investment or consultation advice or investment strategy. The information is not tailored to the investment needs of any specific person and therefore does not involve a consideration of any of the investment objectives, financial situation or needs of any viewer that may receive it. Past performance is not a reliable indicator of future results. Actual results may differ materially from those anticipated in forward-looking or past performance statements. We assume no liability as to the accuracy or completeness of any of the information and/or content provided herein and the Company cannot be held responsible for any omission, mistake nor for any loss or damage including without limitation to any loss of profit which may arise from reliance on any information supplied by TFA Global Pte Ltd.

S&P vs CryptoThe S&P is completing its cycle, and after that it is expected to correct to the specified levels, followed by a correction in Bitcoin as well.
btc
BAT is correcting toward the specified levels after completing its flag pattern
Most other coins are also mimicking Bitcoin’s behavior
link

USDJPY – 1H | Bearish Continuation Setup from Rejection TrendlinFX:USDJPY
If price loses 91,868 support, bearish continuation could accelerate into the liquidity pocket below. First major reaction expected near 86,531, while a deeper sell-side target sits toward 80,524 if liquidity flush extends.
Key Scenarios
📉 Bearish Case (Primary Setup)
Break + retest below 91,868 →
🎯 Target 1: 86,531
🎯 Target 2: 80,524 (deep liquidity sweep)
📈 Invalidation / Bullish Flip
Sustained close above 94,200 = failed distribution → further upside.
Current Levels to Watch
Resistance 🔴: 93,500–94,200
Support 🟢: 91,868 (break = sell continuation)
Main target: 86,500 → extension 80,524
⚠️ Disclaimer: This is a market study only, not financial advice

EURUSD BUY | Idea Trading AnalysisEURUSD is moving in an UP trend channel.
The chart broke through the dynamic Resistance line, which now acts as support.
We expect a decline in the channel after testing the current level which suggests that the price will continue to rise
Hello Traders, here is the full analysis.
I think we can soon see more fall from this range! GOOD LUCK! Great BUY opportunity EURUSD
I still did my best and this is the most likely count for me at the moment.
-------------------
Traders, if you liked this idea or if you have your own opinion about it, write in the comments. I will be glad


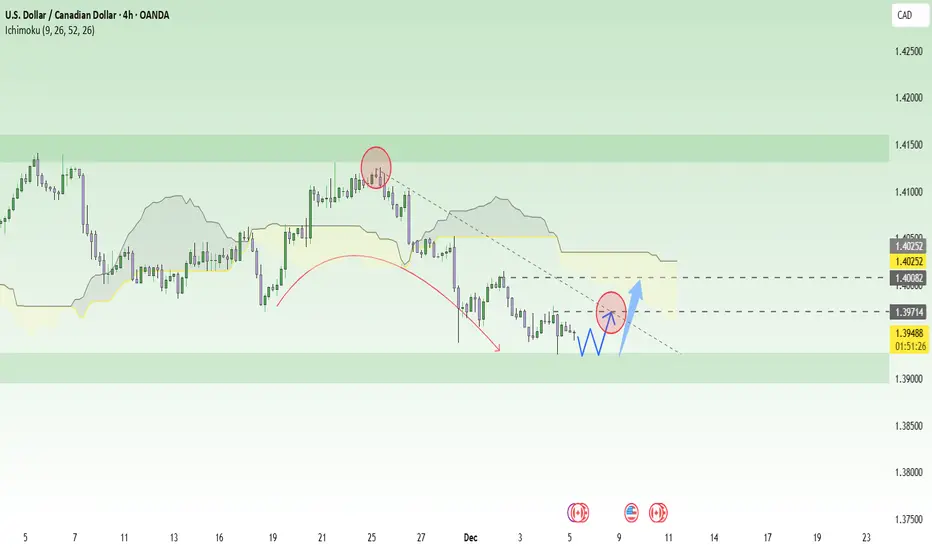
USDCAD – A “Soft Rebound” Forming at Defensive SupportUSDCAD is currently caught between two weak forces . On one side, the USD is losing momentum as markets almost fully expect the Fed to cut rates soon ; on the other side, the CAD isn’t strong either as Canada’s manufacturing data continues to weaken. These opposing forces neutralize each other, preventing a strong trend—but they do create room for a mild technical rebound from the current support zone.
On the H4 chart, USDCAD has slipped out of its upper consolidation range and gradually moved toward the support area around 1.3920, a level where price has reacted strongly multiple times before. The decline is slowing, with candles showing reduced volatility—signs that selling pressure is fading . Above, the zone around 1.3970, aligned with the lower edge of the Ichimoku cloud and the descending trendline, becomes a reasonable upside target for a rebound.
Preferred scenario: USDCAD may continue to test the floor near 1.3920, form a small accumulation pattern, then bounce for a light recovery toward 1.3970, possibly even sweeping slightly higher toward the cloud if USD sentiment stabilizes. However, this remains only a corrective move within a broader weakening structure. Therefore, the optimal approach is to look for short-term buys at support , take profits early at nearby resistance, and maintain strict risk management in a macro environment that remains highly uncertain.
APPLE Just formed its Cycle Top. Best sell opportunity is here.Almost 3 months ago (September 19, see chart below), we gave a buy signal on Apple Inc. (AAPL), which recently hit our final $290 Target:
This week we go back to the long-term 1W time-frame as the Bullish Leg (green) since the April 07 bottom just hit the top (Higher Highs trend-line) of its 4-year Channel Up.
The 2023 Bullish Leg also peaked on its 1.236 Fibonacci extension and eventually corrected back to its 1W MA50 (blue trend-line), hitting its 0.382 Fibonacci retracement level at the same time. The 2022 and early 2025 Bearish Legs even broke below the 1W MA50 and bottomed after a minimum -32.05% decline. The April 2025 bottom even hit the 1W MA200 (orange trend-line).
All of those Channel Up (Cycle) Tops have taken place while the 1W RSI broke above the overbought level (70.00). This has already taken place since last week and we also se the 1W MACD to start reversing, which is something that has also happened every time after a Top.
Based on all the above evidence (1.236 Fib hit, Channel Up top hit, 1W RSI overbought, 1W MACD reversing), we expect Apple to start a long-term correction (Bear Cycle), technically the new Bearish Leg of the 4-year Channel Up and initially make contact with the 1W MA50 and the 0.382 Fibonacci retracement level at $236.00. If the price closes a 1W candle below the 1W MA50, then we expect a second Target to be fulfilled at the bottom of the Channel Up at $200, below the 1W MA200 but still almost -32.00% from the top.
The most efficient long-term buy signal is perhaps given by the 1W RSI again, when it hits the 33.20 Support. Use that to time your buy entry accordingly.
---
** Please LIKE 👍, FOLLOW ✅, SHARE 🙌 and COMMENT ✍ if you enjoy this idea! Also share your ideas and charts in the comments section below! This is best way to keep it relevant, support us, keep the content here free and allow the idea to reach as many people as possible. **
---
💸💸💸💸💸💸
👇 👇 👇 👇 👇 👇

XAUUSD weekly closing below 4245H1 TIMEFRAME SETUP
XAUUSD still moving in rising wedge pattern and we have supply at 4243-4246 zone.
XAUUSD is still bullish rall pattern overall 4245 is supply zone.
If H1 &H4 candle closes below 4245 then readyfor the implusive drop towards 4208 then 4200 milestone.
If it's H1-H4 closes above 4250 then don't sell ,Market will test 4280 .
Keep in mind 4245

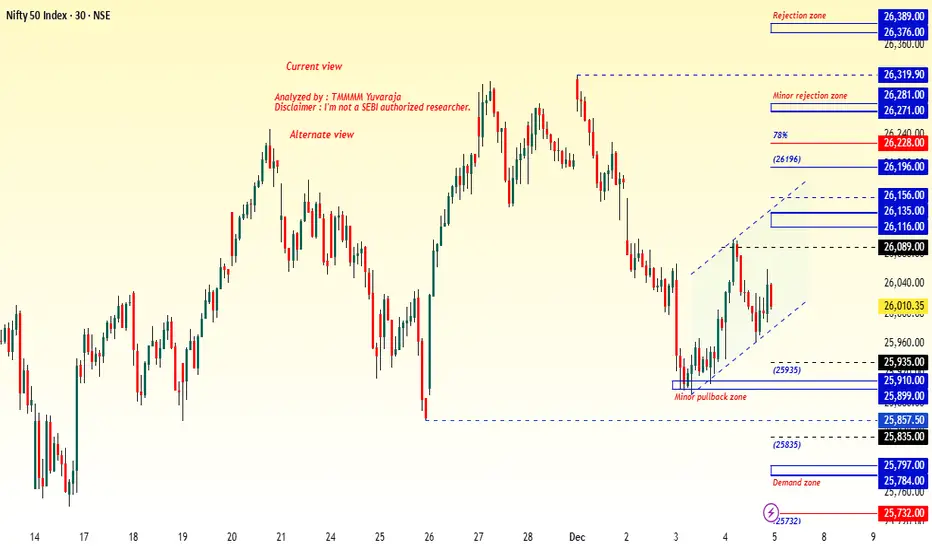
#Nifty Directions and Levels for December 5:Good morning, friends! 🌞
Market Directions and Levels for December 5:
There were no changes in the global or our local market. The Dow Jones indicates a moderately bullish sentiment, while our Indian market indicates a moderately bearish sentiment. However, today the GIFT Nifty indicates a neutral opening.
What to Expect Today?
Today we have a RBI monetary policy announcement. It’s a volatile day, and movement will depend on the event. In my charts, the higher time-frame structure is still showing a solid bullish bias. So if today’s market turns green, we can expect a minimum of the channel top (short-term target). On the other hand, if the market breaks the current swing bottom, we can expect 100% to 127% extension targets for a minor correction. If we call that structurally a flag pattern, AB=CD pattern, or a C wave, then the implications would align accordingly.
BTC Bullish Setup Identified – My Trade Plan📌 Bitcoin has successfully formed a bullish setup on the 1H time-frame. Based on current price behavior and structural support levels, I am entering this trade with a clear and disciplined plan.
🟩 Entry Zone
₹ 91,200 – 91,500
Price is currently respecting this demand zone, showing signs of absorption and potential upside reversal.
🔰 Stop Loss
₹ 90,000
Clean invalidation level below the support.
If this breaks, bullish structure is gone — so SL is fixed.
🎯 Target
₹ 93,500
This aligns with previous resistance and the next liquidity pool.
Once price reaches this zone, I’ll book profits.
⸻
📈 Summary
• Setup Type: Bullish Reversal
• Entry: 91,200–91,500
• SL: 90,000
• Target: 93,500
• Risk–Reward: Attractive & disciplined
⸻
BTC is preparing for a bounce — waiting for confirmation and executing with proper risk management. 🚀📊
