Future market trend predictionIn the short term, the price trend of Bitcoin is full of uncertainties. On the one hand, if the global macroeconomic environment continues to deteriorate, with slower economic growth and increased inflationary pressures, it may prompt more investors to seek safe-haven assets. As an asset with certain safe-haven properties, Bitcoin may attract some capital inflows, providing support for its price. However, if regulatory policies are further tightened in the short term, especially if more stringent restrictive measures are introduced in countries and regions where Bitcoin trading is active, then the price of Bitcoin may face significant downward pressure.
you are currently struggling with losses,or are unsure which of the numerous trading strategies to follow,You have the option to join our VIP program. I will assist you and provide you with accurate trading signals, enabling you to navigate the financial markets with greater confidence and potentially achieve optimal trading results.
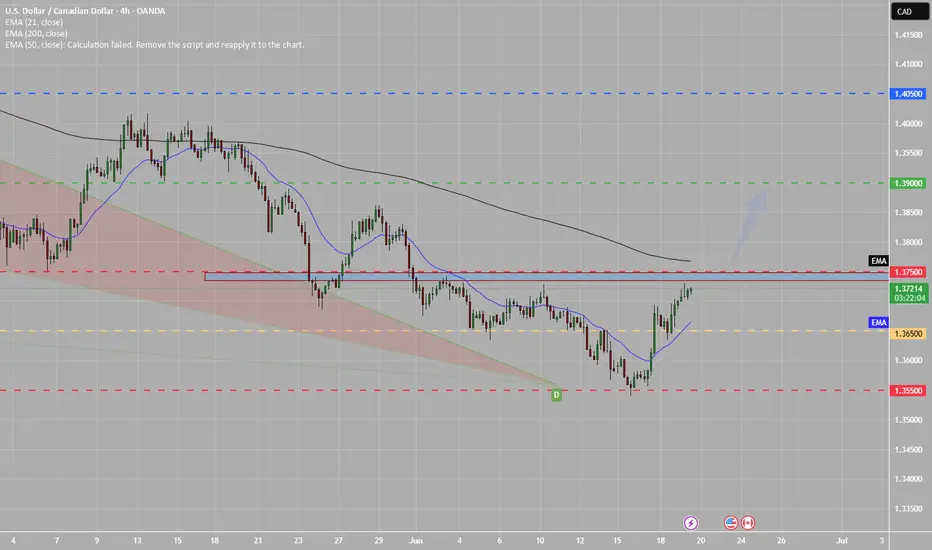
Harmonic Patterns

Will oil prices fall after the sharp surge in crude oil?Oil prices corrected under the dual pressure of news-driven factors and inventory data. Brent crude oil futures traded in a narrow range, reaching $76.38 per barrel, while WTI July contracts edged down to $73.35 per barrel. With intensified geopolitical uncertainties, market sentiment remains dominated by wait-and-see attitudes. The unexpected increase in EIA crude oil inventories dampened market optimism. According to the latest data from the U.S. Energy Information Administration (EIA), crude oil inventories in the U.S. increased by 2.6 million barrels for the week ending June 14, far exceeding the market expectation of a 1.1 million barrel decline, indicating weak demand. The rebound in inventories has exerted downward pressure on oil prices.
Oil prices have repeatedly crossed the moving average system, with the short-term objective trend showing a range-bound rhythm. In terms of momentum, the MACD indicator is intertwined near the upper side of the zero axis, reflecting weak bullish momentum. It is expected that crude oil prices will mainly maintain a consolidative pattern, with the trading range between 79.00 and 73.00.
you are currently struggling with losses,or are unsure which of the numerous trading strategies to follow,You have the option to join our VIP program. I will assist you and provide you with accurate trading signals, enabling you to navigate the financial markets with greater confidence and potentially achieve optimal trading results.
Trading Strategy:
buy@75.0-76.0
TP:78.0-79.0

EIGEN/USDT – Falling Wedge Breakout Setup | 4H ChartEIGEN is currently showing a bullish falling wedge pattern near a strong horizontal demand zone, indicating a potential reversal move.
Technical Breakdown:
Entry Zone: $1.17 – $1.18 (current market price)
Stop-Loss: Below $1.14 (last wick low/invalidation of wedge)
Target Price: $1.74, $2.51 (+118%) from CMP
Resistance 1 (Minor): $1.33
Resistance 2 (Major Target): $1.74
Support Levels:
• $1.17 (Immediate support)
• $0.749 (Major demand zone if breakdown)
Target & Risk-Reward
Target Price: $1.74, $2.51 (+118%) from CMP
Stop-Loss: $1.14
Risk per token: ~$0.03
Potential Profit per token: ~$0.56
Risk:Reward Ratio: ~1:6.5
Potential Gain: +118% from entry
Indicators:
Falling wedge breakout looks imminent
RSI (14) at 39.5 — recovering from oversold zone
Demand zone previously triggered rallies — the probability of a bounce is high
Strategy:
Wait for a 4H candle close above the wedge trendline + volume confirmation to validate the breakout. Scaling in near support with a tight stop-loss can offer a strong risk-reward play.
Not Financial Advice – This is a technical view for educational purposes. Always DYOR & manage risk accordingly.
Like & follow if you found this useful!
#EIGEN #Altcoins #Breakout

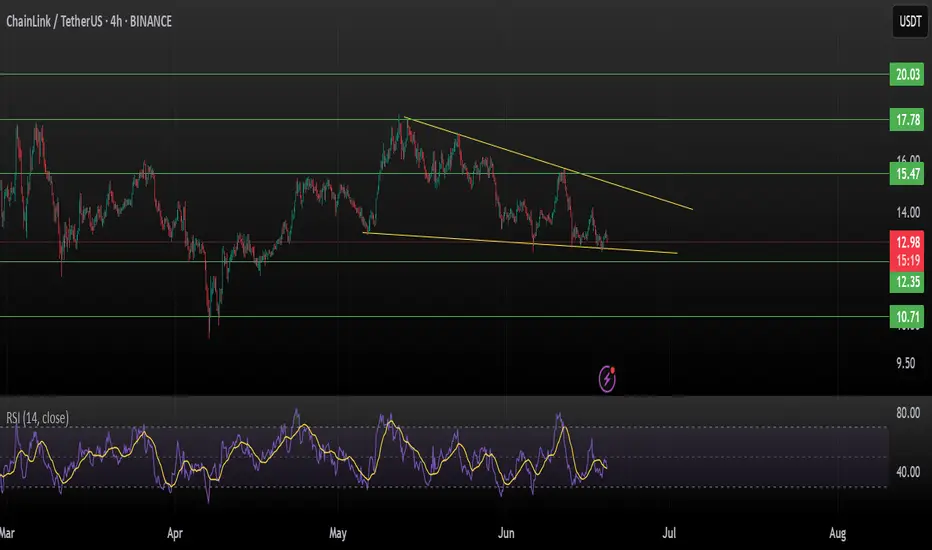
Chainlink (LINKUSDT) | Falling Wedge at Critical SupportChainlink is trading within a well-defined falling wedge pattern on the 4H chart, a typically bullish reversal setup. Price action indicates the coin is hovering just above key horizontal support around $12.35, making this a critical zone to watch.
Technical Breakdown:
Pattern: Falling Wedge (Bullish Bias)
Current Price: $12.98
Immediate Support: $12.35
Major Support: $10.71
Resistance 1: $13.80 (wedge upper trendline)
Breakout Targets:
$17.78 (major resistance)
$20.03 (macro level supply zone)
Indicators:
RSI (14) at ~42 → Weak but stabilizing, potential for reversal
Volume has been compressing — watch for a breakout with rising volume for confirmation
Strategy:
A 4H close above the wedge trendline with volume could trigger a breakout rally toward $17.78 or even $20.03.
Failure to hold $12.35 could send LINK back toward $10.71 support, caution below this level.
Setup Summary:
Long entry on breakout above $13.50 (trendline)
Stop-loss: Below $12.35
Target 1: $17.78
Target 2: $20.03
Risk: Reward Ratio: ~1:3+
Not financial advice. DYOR before entering trades.
If this analysis helps, like & comment your view.
Analysis of the Latest Market Trends of Gold's LowThe gold price experienced a sharp decline after a gap-up opening on Monday this week, followed by a doji doji bullish candle for sideways correction on Tuesday, and a generally range-bound trend on Wednesday. However, after the Federal Reserve's interest rate decision was announced on Wednesday, the gold price dipped to around 3,362, where the low point coincided with the support from the 10-day moving average. Technically, the role of the 10-day moving average support at 3,350 has now become a key focus. If this support holds effectively, the gold price is expected to maintain a consolidative pattern. In terms of upper resistance, the 5-day moving average currently at around 3,390 will act as a suppression for the gold price's upward movement, with further resistance contingent on the breakthrough of 3,405.
The 4-hour chart shows no significant changes either, as the lower Bollinger Band has not widened, indicating strong support at 3,360, which still suggests a bullish trend. Notably, however, during the consecutive rebounds, the gold price has failed to break through the resistance of the middle Bollinger Band, implying a relatively weak mid-term range-bound trend for gold. For intraday trading, a strategy of "shorting at highs and longing at lows" is recommended, pending a breakout from the trend momentum to create trading space. Intraday, long positions are favored above the support at 3,350.
you are currently struggling with losses,or are unsure which of the numerous trading strategies to follow,You have the option to join our VIP program. I will assist you and provide you with accurate trading signals, enabling you to navigate the financial markets with greater confidence and potentially achieve optimal trading results.
Trading Strategy:
buy@3350-3355
TP:3375-3380
sell@3375-3380
TP:3350-3355

Cardano- Polkadot, Cardano, or any other major cryptocurrencies all feel alike.
- Only the price is different.
- Find Resistance.
- Find Support.
- Master your emotions, learn and gamble at the good time.
Happy Tr4Ding !


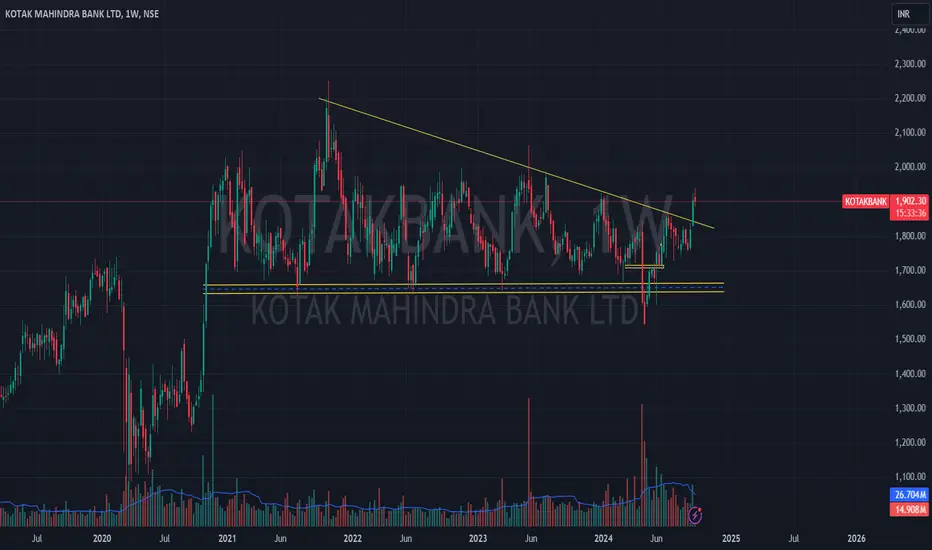
KOTAK BANK 1WKotak Mahindra Bank has recently experienced a bullish breakout, indicating a potential upward price movement. Based on technical analysis, the stock is projected to reach the 2400 price level in the near future
I'm not a SEBI-registered analyst. All posts and levels shared are just for educational purposes. I'm not responsible for any losses or profits. No claims, all rights reserved.

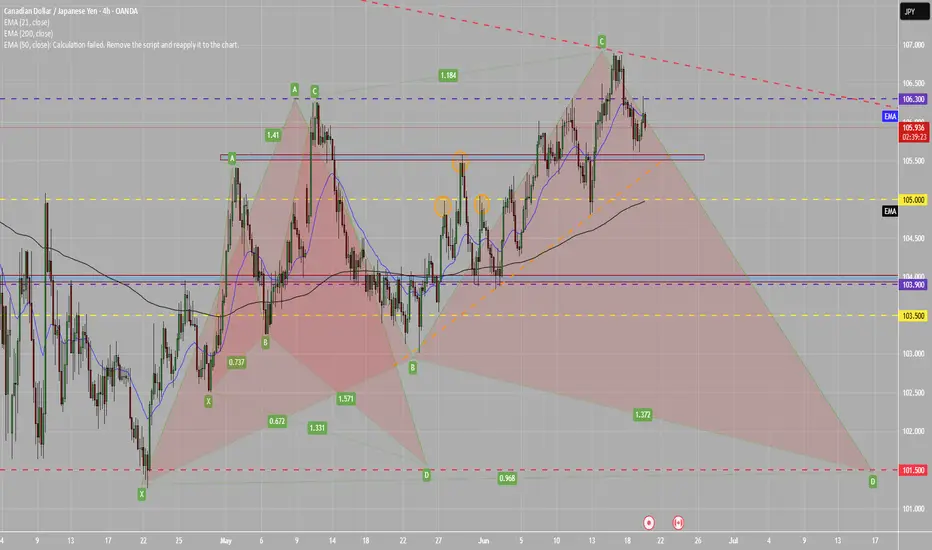
CJ 4H LOOOK INTO BEARISH C-D HARMONIC SHARK LEGThis is an inside look into the short C-D set up. Same idea keep an eye out for the price action.
Pepe update hello friends✋️
Considering the drop we had, you can see that the price was well supported in the specified area and buyers came in. Now in the return of the price, we can buy step by step in the specified support areas and move with it until the specified goals, of course, with the management of shame and risk...
*Trade safely with us*

Free signals: today (TRX)hello friends✋️
Considering the drop we had, you can see that the price was well supported in the specified area and buyers came in. Now in the return of the price, we can buy step by step in the specified support areas and move with it until the specified goals, of course, with the management of shame and risk...
*Trade safely with us*

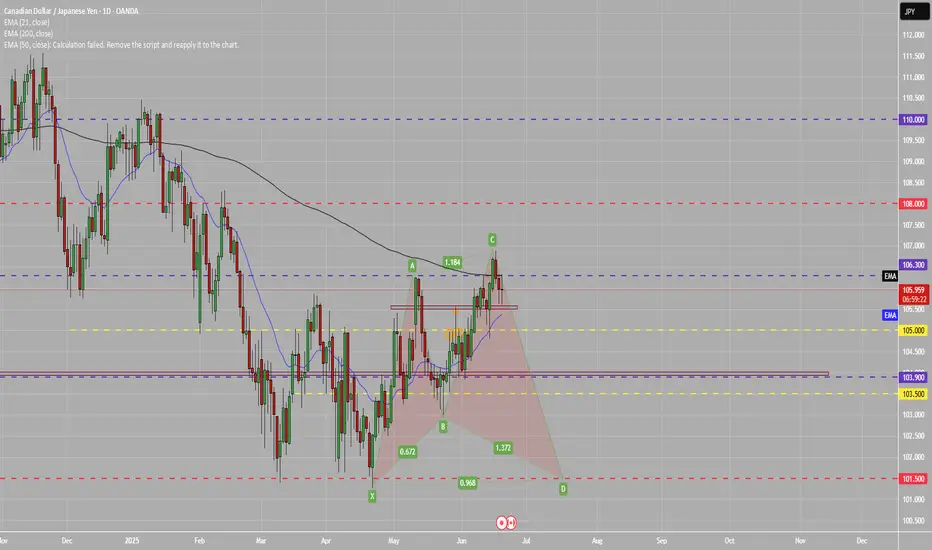
CJ BEARISH C-D SHARK HARMONIC PATTERN Price just tested strong resistance, due to a shark harmonic pattern forming and that overall daily trend is bearish market, will favor shorts. There will be an addtional 4h look into this. Price on daily TF should not trade above C level, as long as it holds I will look for shorts.
TAVHL2! It was a bit of a rushed and forced move, but I expect to see further downside action for a while.
Better to keep an eye on it.

EURUSD +3% Trade Recap 17th June 2025A short position taken on EURUSD for +3%, full explanation as to why I executed on this position and made the decision to manually close at the level I did.
Any questions you have just drop them below 👇

UC WAITING GAME Looking to see how price reacts to this recent bearish rally, trend is biased for shorts. However, we can possible start to see price climb, I have a target in mind which is the green resistance (weekly) would like to see break and retest of the Daily (red line) before price continues to the mentioned target.
Will gold continue to rise after adjusting to a low level?Gold trend analysis:
Gold opened high on Monday and then fell sharply. On Tuesday, it fluctuated and corrected with a cross-yang line. On Wednesday, the overall trend was also volatile. However, after the Fed’s interest rate decision was announced in the early hours of Wednesday, the gold price fell to around 3362. The low point of this decline was just supported by the 10-day moving average. From a technical point of view, the support of the 10-day moving average at 3350 is currently the key point. If this support can be effectively maintained, the gold price is expected to maintain a volatile pattern; once it breaks down, the short-selling force may be continued, and then it will be necessary to look at the support of the 20-day moving average near 3350. In terms of upper resistance, the 5-day moving average is currently near 3390, which will suppress the upward movement of gold prices. Further resistance depends on the gains and losses of 3405.
There is not much change in the 4-hour chart. The lower track has not opened. The support of 3360 is strong, and it is still a bullish trend. However, it is worth noting that in the continuous rebound, the Bollinger middle track suppression point has not been broken. Relatively speaking, gold is weak and volatile in the medium term. Under the trend today, if it continues to rise, we must pay attention to the gains and losses of the dense suppression point 3405. If it breaks 3405 and the trend strength comes out, we can see the high point of 3430. For intraday trading, we still maintain high-altitude and low-long, waiting for the trend strength to break through the space, and we are bullish above the support of 3350 during the day.
Gold operation strategy: It is recommended to short at 3385-3383 on the rebound, stop loss at 3390, and target at 3370-3365; go long at 3350-3352 when gold falls back, stop loss at 3340, and target at 3375-3385;

Can we look for longs in XAUUSD? Here's a multi-timeframe POVHello traders , here is the full multi time frame analysis for this pair, let me know in the comment section below if you have any questions , the entry will be taken only if all rules of the strategies will be satisfied. wait for more price action to develop before taking any position. I suggest you keep this pair on your watchlist and see if the rules of your strategy are satisfied.
🧠💡 Share your unique analysis, thoughts, and ideas in the comments section below. I'm excited to hear your perspective on this pair .
💭🔍 Don't hesitate to comment if you have any questions or queries regarding this analysis.

CHECK NUZUSD SIGNAL READ CAPTAINnuzusd buy now ✅
entry point (0.59740) (0.59700)
TAKE PROFIT 1: (0.59870)
TAKE PROFIT 2: (0.60040)
LAST TARGET (0.60200)
STOP LOSS (0.59550)

XAUUSD holding falling wedge towards 3330-3335H4 Timeframe Analysis
Gold is currently holding the falling wedge pattern on H4 and Range of 3330-3380 below structural resistance area.im expecting one more Drop then Upside move.
Bullish scanario:
3382-3385 is the optimal structural resistance and potential buyying area ,if The H4 & H1 candle closes above 3382-3385 I will took buy and my Targets will be 3408 then 3430.
Secondly if gold sustained with this falling wedge pattern with drop of Accumulation behaviour closes the H4 below the $3380 level, i will reassess my outlook towards 3345 then 3330.
Additional TIP : 3330-3335 will be instant optimal buying area.
#XAUUSD


CHECK AUDJPY SIGNAL READ CAPTAINaudjpy sell now ✅
entry point (94.080) (94.050)
TAKE PROFIT 1: (93.960)
TAKE PROFIT 2: (93.840)
LAST TARGET (93.720)
STOP LOSS (94.2100)

CHECK XAUAUD SIGNAL READ CAPTAINxauaud buy now ✅
entry point (5210) (5205)
TAKE PROFIT 1: (5225)
TAKE PROFIT 2: (5245)
LAST TARGET (4260)
STOP LOSS (5185)
