CHECK BTCUSD SIGNAL READ CAPTANbtcusd buy now ✅
entry point (105000) (104800)
TAKE PROFIT 1: (105.300)
TAKE PROFIT 2: (105.800)
LAST TARGET (106300)
STOP LOSS (104300)
Harmonic Patterns

EURUSD - Shifting from Bearish to Bullish Soon!Hello TradingView Family / Fellow Traders. This is Richard, also known as theSignalyst.
📈EURUSD has been overall bullish trading within the rising wedge marked in blue.
Moreover, the orange zone is a strong support!
🏹 Thus, the highlighted blue circle is a strong area to look for buy setups as it is the intersection of support and lower blue trendline acting as a non-horizontal support.
📚 As per my trading style:
As #EURUSD approaches the blue circle zone, I will be looking for bullish reversal setups (like a double bottom pattern, trendline break , and so on...)
📚 Always follow your trading plan regarding entry, risk management, and trade management.
Good luck!
All Strategies Are Good; If Managed Properly!
~Rich
Disclosure: I am part of Trade Nation's Influencer program and receive a monthly fee for using their TradingView charts in my analysis.


Uniswap (UNI): Buyers Showing Strong Dominance | Aiming at $8.50Uniswap is showing strong buyside momentum where recently near 100EMA we saw how dominant the buyers were, which is giving us a sign of possible further movement to local resistance area, so that's where we have set our targets as of now.
Now if we see any signs of weakenss then we will be shifting our view for Bearish CME.
Swallow Academy

FUNUSDT UPDATEPattern: Falling Wedge Breakout
Current Price: $0.004488
Target Price: $0.0088
Target % Gain: 115.04%
Technical Analysis: FUN has broken out of a falling wedge pattern on the 1D chart with strong bullish momentum and volume spike. Breakout is confirmed with daily close above resistance trendline.
Time Frame: 1D

SEIUSDT UPDATEPattern : Falling Wedge Breakout
Current Price: $0.1839
Target Price: $0.3590
Target % Gain: 95.76%
Technical Analysis: SEI has broken out of a falling wedge pattern on the 1D chart, indicating potential reversal. The breakout is supported by increasing bullish momentum. A sustained close above resistance confirms the move.
Time Frame: 1D

USOIL-– Bearish Reversal Toward $72.04Crude oil is showing signs of weakness after testing a significant resistance zone near $74.50 – $75.00. The price had previously broken out of a descending channel, triggering a bullish correction. However, it’s now approaching a critical resistance level which has been tested multiple times historically.
The bearish projection (shown in red) suggests a possible lower high formation, signaling exhaustion in bullish momentum. If the resistance holds, a drop toward the next target at $72.04 looks probable, aligning with previous support and the breakdown zone of the ascending move.
Key Levels:
Resistance Zone: $74.50 – $75.00
Support Zone: $68.00 – $70.00
Intermediate Target: $72.04
📉Bias: Bearish below $75.00
Confirmation: Watch for bearish candle patterns or rejection wicks near resistance.

#ASCM - Egyptian stock - great opportunity, high financial risk#ASCM time frame 1 DAY
Note : before technical analysis the financial position of the company isn't in the best condition , there isn't any cash flows from operations activity , in anther hand the company work in MINING so that may cost the company lot of expenses and time before achieving any Mining discovery .
We have here a great Gartley Bullish pattern with 2 positive diversions at MACD and RSI in addition the prices in critical point ( stop loss of the pattern ) so :
Entry level at 34.00 ( price now is 32.85 ) so we can wait to close daily over 34.00 or start from this point ( consult your account manager )
Stop loss 32.70 ( estimated loss -4% ) or estimated loss from this point is 0.50 %
First target at 37.50 ( estimated profit around 14% )
Second target 40.70 ( estimated profit around 23% )
Third target 42.70 ( estimated profit 30% )
NOTE : this data according to time frame I DAY , it`s may take period up to 3 months to achieve targets , you must study well the Alternative opportunities before invest in this stock .
Its not an advice for investing only my vision according to the data on chart
Please consult your account manager before investing
Thanks and good luck

XRPUSD tested the Support line 2.1215 👀 Possible scenario:
XRP tested support at $2.12 and is now consolidating below $2.20. The price briefly bounced above the 23.6% Fib level from the $2.335 swing high but remains under pressure.
Despite the dip, XRP's fundamentals remain strong. It’s widely recognized for fast, low-cost cross-border payments and gained major institutional interest—including from the UN. Regulatory clarity after Ripple’s legal win against the SEC boosted investor confidence. XRP has surged 330% in the past year, and analysts see a bullish flag pointing to a potential breakout above $3.50 this summer.
✅ Support and Resistance Levels
Support level is now located at 2.1215
Now, the resistance level is located at 2.3370.

ICDI - save your profits and capital#ICDI timeframe 4 hours and also 2 hours
Created a bearish Gartley pattern
Sell point around 3.72 ( prices now is 3.74 )
Stop loss / reentry 3.80 (estimated loss -2.00%)
First target at 3.53 (estimated profit 4.87%)
Second target 3.80 (estimated profit up to 9.24%)
Third target 3.20 (estimated profit up to 13.90%)
NOTE: this data according to timeframe 4 hours and also 2 hours.
It's not an advice for investing, only my vision according to the data on chart.
Please consult your account manager before investing.
Thanks and good luck.

ADRI - Egyptian stock market - good for medium term investing #ADRI timeframe 1 DAY
Created Gartley Bullish pattern.
Entry level at 1.08 ( price now 1.07)
Stop loss 1.02 ( loss may go to up -5.50% ) - support 1.05
First target at 1.24 ( with profit around 14.49% ) resistance 1.15
Second target 1.37 ( with profit around 26.60% ) resistance 1.28
Third target 1.52 ( with profit around 40.84% ) resistance 1.45
NOTE : this data according to time frame I DAY , so its may take time up to 3 months .
Its not an advice for investing only my vision according to the data on chart
Please consult your account manager before investing
Thanks and good luck

DAX Can today's 1D MA50 test start a new rally?Last time we looked at DAX (DE40) more than 2 months ago (April 04, see chart below), we took a long-term buy on the 1D MA200 (orange trend-line) and the bottom of the 2.5-year Channel Up, targeting 25400:
The price reacted favorably, rising almost instantly, almost hitting the top of the Channel Up on June 05. Since then it got rejected and pulled back to hit the 1D MA50 (blue trend-line) today.
Based on the previous Bullish Legs of the Channel Up, this seems to be a technical correction (blue ellipse patterns) that only served as a 1D MA50 test to accumulate more buyers and extend the uptrend.
If the current Bullish Leg rises as high as the previous one (+38%), we should be expecting 25900 by the end of Q3.
-------------------------------------------------------------------------------
** Please LIKE 👍, FOLLOW ✅, SHARE 🙌 and COMMENT ✍ if you enjoy this idea! Also share your ideas and charts in the comments section below! This is best way to keep it relevant, support us, keep the content here free and allow the idea to reach as many people as possible. **
-------------------------------------------------------------------------------
Disclosure: I am part of Trade Nation's Influencer program and receive a monthly fee for using their TradingView charts in my analysis.
💸💸💸💸💸💸
👇 👇 👇 👇 👇 👇

CHECK EURJPY SIGNAL READ CAPTAINeurjpy) sell zone
(trade satup)
entry point (167.000) to (167.050) 📊
first target (166.800)📊
2nd target (166.600) 📊
last target (166.400) 📊
stop loss (167.300)❌

CHECK EURUSD SIGNAL READ CAPTAIN(eurusd) buy zone
(trade satup)
entry point (1.14800) to (1.14700) 📊
first target (1.15000)📊
2nd target (1.15350) 📊
last target (1.15700) 📊
stop loss (1.14400)❌

$LDO PUMP TO $1.20📊 1. Trend Analysis
HTF (Higher Time Frame) Bullish: Long-term trendline shows sustained upside momentum with 3 clean touches, indicating trend strength.
LTF (Lower Time Frame) Bearish: Short-term structure broke down from the trendline but is now showing signs of reversal with a falling wedge breakout.
📈 2. Chart Pattern
Falling Wedge: Classic bullish reversal setup. Price has broken out with strong momentum.
OBV (On-Balance Volume) shows bullish divergence—volume is rising while price was falling, signaling accumulation during the downtrend.
🔄 Market Structure
Swing Highs and Lows are respected—showing healthy structure.
Recent swing low held near the demand zone.
Break and retest of key levels and trendlines indicate potential continuation to the upside.
🟪 Supply & Demand
Demand Zone (~$0.65): Provided strong support, origin of latest move.
Supply Zone (~$1.15): Likely to offer resistance; aligns with upper FVG and volume gap.
🔵 Fair Value Gaps (FVGs)
Filled/Partial Below: $0.65–$0.68 – already mitigated.
Unfilled Above: Around $0.98–$1.05 – may act as a magnet for price.
🧠 Psychological Levels
$0.90 and $1.00: Price magnets due to trader behavior. Expect increased reaction or consolidation at these levels.
🔴 Volume Profile
High Volume Node (HVN) around $0.85–$0.95: Indicates acceptance zone where price may consolidate.
Low Volume Gap above $1.10: If price clears this, a fast move to $1.20+ is likely.
✅ Bullish Confluences
Falling wedge breakout confirms reversal potential.
OBV divergence supports accumulation narrative.
Price bounced from demand zone and reclaimed broken structure.
Room to move into FVG and low-resistance areas above.
❌ Bearish Risks
Rejection at $1.00–$1.05 psychological/FVG level.
Breakdown below $0.86–$0.88 invalidates bullish setup.
Heavy supply at $1.20 could cap upside.
📌 Summary
Bias: Bullish. Expect move toward $1.00–$1.15.
Confirmation: Clean break and hold above $1.00.
Invalidation: Break back below $0.86 swing low.

$MPRC - Beware of the bears trap** EGX:MPRC - 1-Day Timeframe**
A highly complete bearish Gartley pattern is forming.
- **Sell Point:** Around 26.50
- **Stop Loss/Reentry:** 28.17 (estimated loss: -7.00%). A close above 28.17 would signal continued upward momentum.
- **First Target:** 23.70 (estimated profit: 10.40%)
- **Second Target:** 22.00 (estimated profit: up to 16.87%)
**Notes:**
- The RSI shows weakness but remains above 70, indicating strength. A close below 70 would signal a halt to the upward trend. Until then, the stock remains positive for the long term.
- This analysis is based on the 1-day timeframe.
**Disclaimer:** This is not investment advice—only my interpretation of the chart data. Consult your account manager before making any decisions. Good luck!

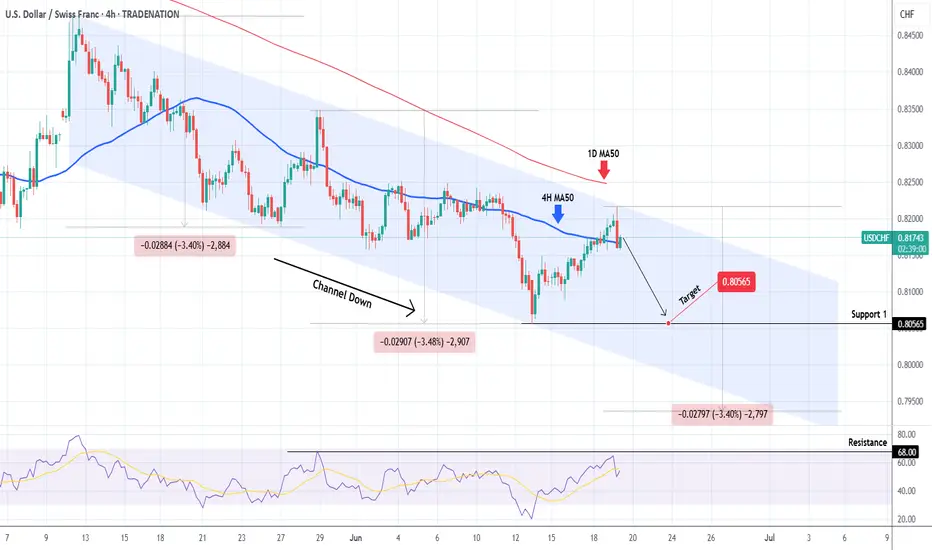
USDCHF Channel Down reached its top. Sell signal.The USDCHF pair has been trading within a Channel Down pattern since the May 12 High and today the price hit its top again. Trading above its 4H MA50 (blue trend-line) but still below the 1D MA50 (red trend-line), that maintains the medium-term bearish trend.
This is a strong bearish signal as it technically indicates that the new Bearish Leg is about to start. Support 1 at 0.80565 is a low risk Target. The previous 2 Bearish Legs have both gone for -3.40% declines, so technically the downside can be extended beyond Support 1.
-------------------------------------------------------------------------------
** Please LIKE 👍, FOLLOW ✅, SHARE 🙌 and COMMENT ✍ if you enjoy this idea! Also share your ideas and charts in the comments section below! This is best way to keep it relevant, support us, keep the content here free and allow the idea to reach as many people as possible. **
-------------------------------------------------------------------------------
Disclosure: I am part of Trade Nation's Influencer program and receive a monthly fee for using their TradingView charts in my analysis.
💸💸💸💸💸💸
👇 👇 👇 👇 👇 👇
#EAST - great fundamental - positive long term #EAST timeframe 1 hour
Created Bullish Gartley pattern, so we can see action price in this point .
Entry level around 30.20
Stop loss 29.70
First target at 31.65
Second target 32.50
Third target 33.20
NOTE : this data according to timeframe 1 hour.
Also MACD show positive diversion that may support our idea.
Its not an advice for investing only my vision according to the data on chart
Please consult your account manager before investing
Thanks and good luck

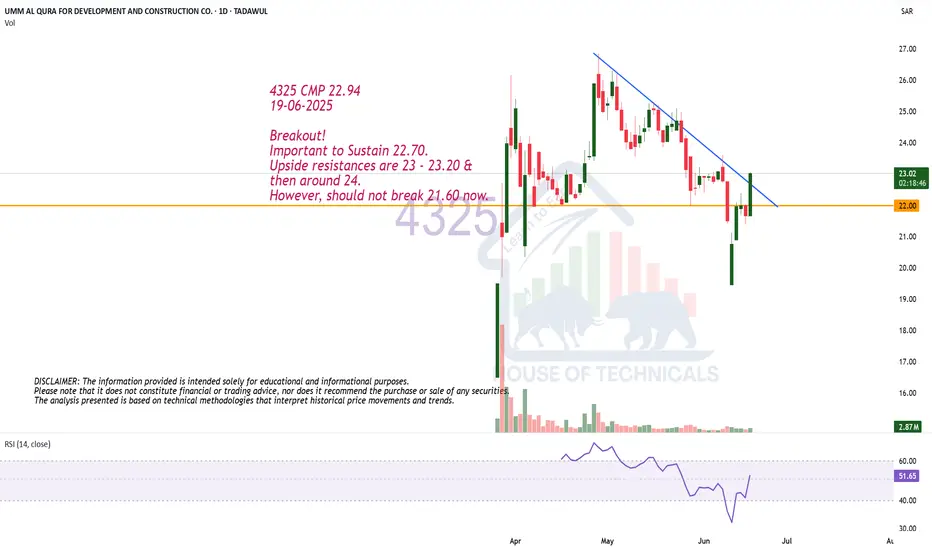
Breakout!4325 CMP 22.94
19-06-2025
Breakout!
Important to Sustain 22.70.
Upside resistances are 23 - 23.20 &
then around 24.
However, should not break 21.60 now.
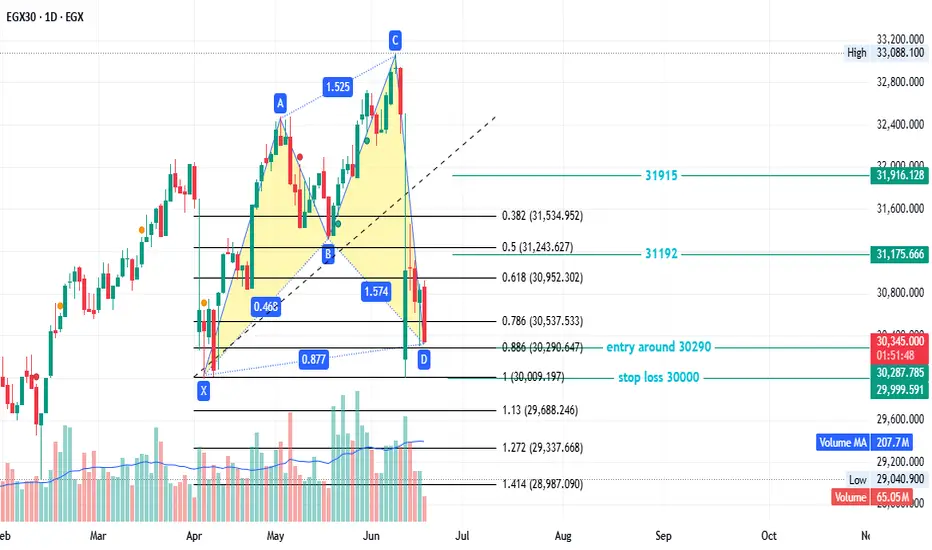
EGX30 - good newsEGX30 created a bullish pattern
entry around 30290
stop loss 30000
first target 31192
secund target 31915
This is not investment advice—only my analysis based on chart data. Consult your account manager before investing. Good luck!
ETHEREUM Battling to hold its 1D MA50.Ethereum (ETHUSD) has been trading within a 5-week Channel Up pattern and in the past 2 days almost tested its 1D MA50 (blue trend-line). So far this is holding, showcasing the strong presence of buyers in that price region, which also happens to be the bottom of that Channel Up.
Ahead of a 1D Golden Cross that may potentially be formed in a week or so, this is the strongest buy signal we get since the April 09 bottom. Given also that the price is trading close to the 0.5 Fibonacci retracement level from the December 16 2024 High, the upside potential is significant. The obvious medium-term Target is that High at 4100.
-------------------------------------------------------------------------------
** Please LIKE 👍, FOLLOW ✅, SHARE 🙌 and COMMENT ✍ if you enjoy this idea! Also share your ideas and charts in the comments section below! This is best way to keep it relevant, support us, keep the content here free and allow the idea to reach as many people as possible. **
-------------------------------------------------------------------------------
💸💸💸💸💸💸
👇 👇 👇 👇 👇 👇

Neiroeth ShortEntry 1 only if it retest the zone ill prefer entry 2
Enter only if bearish momentum formed.
DYOR

BTC/USDT–Technical Analaysis Setup#Bitcoin is currently forming a bearish harmonic pattern indicating a potential correction toward key support zones.
📉 The price action suggests the development of a Gartley pattern with projected downside targets around $103,679, $101,931, and possibly extending to $97,419.
A critical resistance zone between $105,000 and $106,000 will be pivotal for either confirming bullish momentum or triggering a bearish reversal.
If BTC fails to break through this resistance and confirms the bearish reversal signal, a deeper decline toward the aforementioned support levels becomes highly probable.
🎯 Target 1: $103,679
🎯 Target 2: $101,931
🎯 Target 3: $97,419
