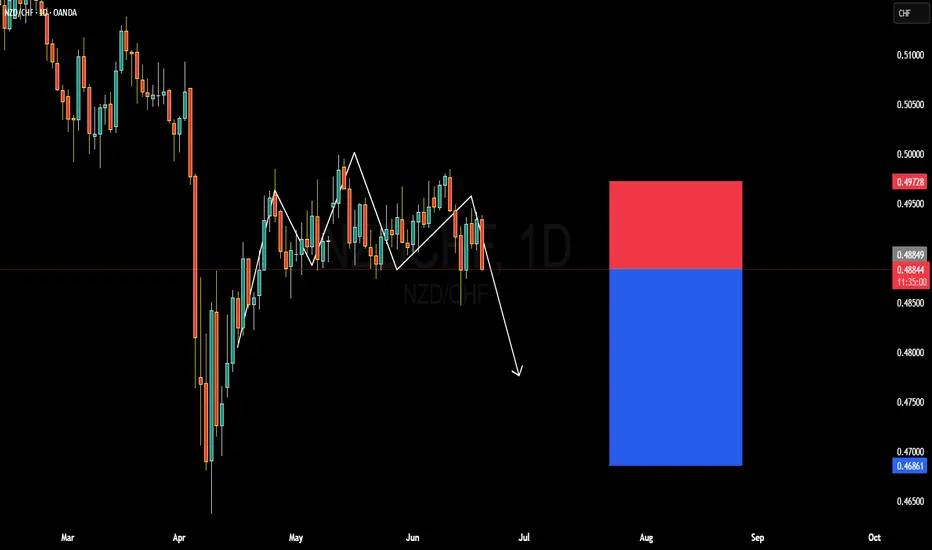
NZDCHF BULLISH OR BEARISH DETAILED ANALYSISNZDCHF is currently trading around the 0.4880–0.4900 zone, and on the daily timeframe, the pair appears to be completing an inverse head and shoulders pattern. However, unlike the typical bullish nature of this pattern, price has failed to break above the neckline and is showing early signs of bearish continuation. The right shoulder has already failed to create a higher high, and recent bearish candlesticks with strong wicks to the upside suggest rejection and downside momentum building. My short bias is supported by this structural weakness and loss of bullish steam.
From a fundamental perspective, the Swiss Franc remains strong due to its safe-haven demand amid lingering global risk aversion and slowing global growth expectations. The Reserve Bank of New Zealand, while on hold recently, has adopted a relatively dovish tone as domestic inflation trends soften. This diverging policy stance between the SNB and RBNZ provides a macroeconomic tailwind favoring CHF strength and NZD weakness. In today’s session, CHF also gained modestly following stronger-than-expected CPI revisions and cautious risk flows in the Asian and European sessions.
Technically, we’ve seen a clean break of the recent support zone near 0.4890, and the market structure has flipped bearish on both the daily and H4 charts. I expect further downside continuation toward the 0.4680–0.4700 range, especially if the current lower highs pattern persists. The bearish flag breakdown and consistent lower closes support continuation toward my 0.46 target. This offers a solid short setup with a favorable risk-reward ratio in play.
I’ll continue monitoring for any pullback toward the 0.4920–0.4950 area for potential re-entries on weakness. Momentum and volume indicators also point lower, aligning with the price action thesis. As long as we stay below 0.4970, the bearish scenario remains active, and I’m looking to capitalize on this developing bearish cycle in NZDCHF.
Harmonic Patterns
XAUUSD-Potential bearish drop off major support?The Gold (XAU/USD0 has broken out of the pivot which acts as an overlap support and could drop to the 1st support which has been identified as an overlap support.
Pivot: 3,374.04
1st Support: 3,341.44
1st Resistance: 3,398.38

#XVS/USDT#XVS
The price is moving within a descending channel on the 1-hour frame, adhering well to it, and is heading for a strong breakout and retest.
We are experiencing a rebound from the lower boundary of the descending channel, which is support at 5.60.
We are experiencing a downtrend on the RSI indicator that is about to be broken and retested, supporting the upward trend.
We are looking for stability above the 100 Moving Average.
Entry price: 5.70
First target: 5.86
Second target: 6.03
Third target: 6.32


#AUCTION/USDT#AUCTION
The price is moving within a descending channel on the 1-hour frame, adhering well to it, and is heading towards a strong breakout and retest.
We are experiencing a rebound from the lower boundary of the descending channel, which is support at 10.73.
We are experiencing a downtrend on the RSI indicator, which is about to break and retest, supporting the upward trend.
We are heading towards stability above the 100 Moving Average.
Entry price: 10.82
First target: 10.86
Second target: 11.02
Third target: 11.14

BITCOIN All boxes checked. Couldn't be more bullish than this!Bitcoin (BTCUSD) has filled numerous bullish conditions with the latest being holding the 1D MA50 (blue trend-line) as Support. This is basically the 3rd time testing and holding it since June 05. Even if that doesn't hold, we have the 1D MA200 (orange trend-line) directly below it as the ultimate long-term Support.
This trend-line just so happens to be exactly on the neckline of the Right Shoulder on the long-term Inverse Head and Shoulders (IH&S) pattern that has been in development since December 17 2024.
On top of all these, the market also formed a 1D Golden Cross a month ago, always a strong long-term bullish signal. IH&S patterns typically target their 2.0 Fibonacci extension, which sits at $168000.
Is that another indication that Bitcoin is going after 150k at least on its next run? Feel free to let us know in the comments section below!
-------------------------------------------------------------------------------
** Please LIKE 👍, FOLLOW ✅, SHARE 🙌 and COMMENT ✍ if you enjoy this idea! Also share your ideas and charts in the comments section below! This is best way to keep it relevant, support us, keep the content here free and allow the idea to reach as many people as possible. **
-------------------------------------------------------------------------------
💸💸💸💸💸💸
👇 👇 👇 👇 👇 👇

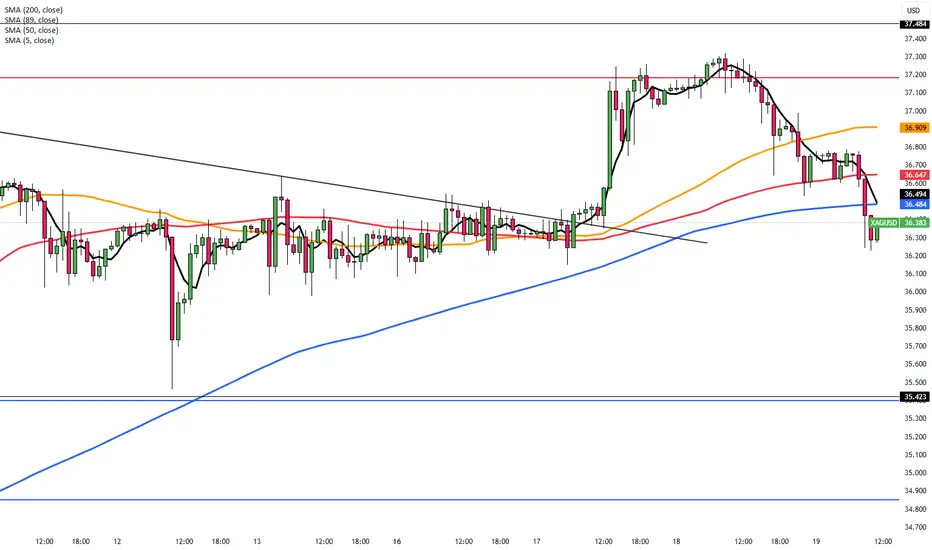
Silver Consolidates After Hitting Multi-Year HighSilver holds near $36.75 in Thursday’s Asian session, steady after a slight pullback from its highest level since February 2012. The trend remains bullish, suggesting more upside. A sustained move above $36.45–$36.50 confirmed a breakout from a descending channel, forming a bullish flag. The RSI has eased from overbought, and momentum indicators support a positive near-term outlook.
The first resistance is seen at 37.50, while the support starts at 35.40.
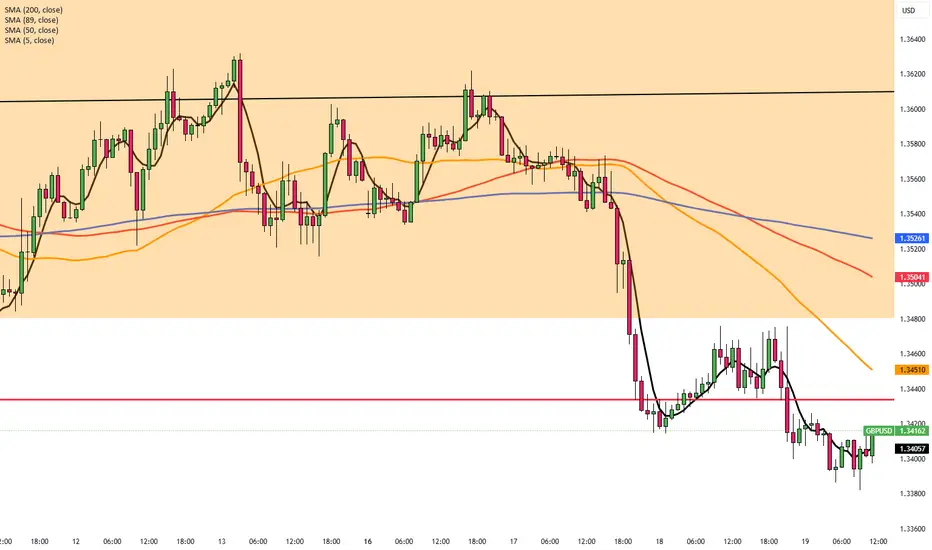
BoE in Focus as GBP/USD Nears 1.3410GBP/USD remains under pressure for a third day, trading near 1.3410 in Thursday’s Asian session, as safe-haven demand strengthens the US Dollar amid Israel-Iran tensions. The BoE is expected to hold rates at 4.25% today. UK inflation eased to 3.4% in May from 3.5%, in line with forecasts but still above the 2% target. Markets still price in about 48 basis points of BoE cuts by year-end.
Resistance is seen at 1.3440, while support holds at 1.3260.
EUR/USD Slips as Fed Stays HawkishEUR/USD fell toward 1.1465 in Thursday’s Asian session, pressured by a risk-off mood as Middle East tensions rise. The focus shifts to speeches from ECB officials Lagarde, Nagel, and de Guindos for further guidance.
On Wednesday, the Fed held rates at 4.25%–4.50% and signaled a slower pace of cuts, citing inflation risks from Trump’s new tariffs. The FOMC still projects two cuts in 2025
Bloomberg reported the US may strike Iran in the coming days, raising safe-haven demand for the dollar and adding pressure on the euro. ECB’s Lagarde said rate cuts are nearly done and that the ECB is well-positioned to manage current uncertainties.
Resistance is located at 1.1475, while support is seen at 1.1415

6.19 Will the volatile market end?6.19 Will the volatile market end?
The Federal Reserve kept the benchmark interest rate unchanged at 4.25%-4.50%, and remained unchanged for the fourth consecutive meeting, increasing the pressure on gold.
This week, the market opened high and closed low every day, which fully proved that the short-selling force was strong, but the price did not fall sharply, indicating that the buying power was also strong.
As of now, the lowest price was 3348 and then rebounded. If it can stand firmly in the 3360 area, it means that 3348 should be the last bottom in the near future.
On the contrary, if it cannot stand firmly in the 3360 area, it may break the short-term rising trend line downward and fall into the long-term rising trend line.
Today, you can go long with a light position below 3360, with a target of 3380. If it falls below 3344, stop loss immediately.
If it breaks through 3380, you can increase your position and continue to go long after waiting for a decline.
Thank you for your attention, and I hope my analysis can help you.

99K and 97.5K potential targetsMorning folks,
As you can see, not occasionally last time we chose only nearest 107K and 109K targets. Market indeed looks a bit heavy. Now short-term context turns bearish and we consider reaching of 99K target as rather high. Next potential target area is 97.K - butterfly target and daily Fib support.
Obviously now we do not consider any new longs and need some clear signs of sentiment changing, that we do not have by far. Let's see what will happen around support area

#VET/USDT#VET
The price is moving within a descending channel on the 1-hour frame, adhering well to it, and is heading towards a strong breakout and retest.
We are experiencing a rebound from the lower boundary of the descending channel. This support is at 0.02086.
We are experiencing a downtrend on the RSI indicator, which is about to break and retest, supporting the upward trend.
We are heading towards stability above the 100 Moving Average.
Entry price: 0.02160
First target: 0.02226
Second target: 0.02274
Third target: 0.02344

GBPUSD IS LOOKING WEAK FOR A HARD SELL OFF SWING TRADEOANDA:GBPUSD Has broken the bullish swing low on 4 Hour time frame with strong sell off bearish candles leaving behind a big bearish imbalances in price. Which extra confirm that price is extremely bearish on 4 Hour time frame.
Now that trend has shifted from bullish trend to a bearish one, am now bearish on GBPUSD.
Bearish shift in market structure that happened on OANDA:EURUSD EURUSD which is a correlating pair with GBPUSD extra confirm this bearish bias on GBPUSD.
likewise also, the Bullish Shift in Market Structure on OANDA:USDCAD USDCAD, which is an opposite correlating pair confirm this sell on GBPUSD.
So, my focus now is selling GBPUSD in every pullback or retest of key bearish levels.
I will update you as the trade develop.

USDCAD SWING TRADE LONG IDEA - MASSIVE BULLISH MOVE COMING?OANDA:USDCAD USDCAD has given a massive bullish break of structure on 4 Hour time frame after tapping to a strong key level on weekly time frame that is serving as support.
Now am bullish on USDCAD for a weekly income swing trading moves.
All I need right now to enter for a long to ride the move is a pull back to key level of support like old highs or imbalance levels.
That is when I will take a bullish long trade on USDCAD.
This is my A+ Trading Setup.
What do you see on your chart?

#SUSHI/USDT#SUSHI
The price is moving within a descending channel on the 1-hour frame and is expected to break and continue upward.
We have a trend to stabilize above the 100 moving average once again.
We have a downtrend on the RSI indicator, which supports the upward move by breaking it upward.
We have a support area at the lower limit of the channel at 0.616, acting as strong support from which the price can rebound.
Entry price: 0.621
First target: 0.634
Second target: 0.643
Third target: 0.654

XAU USD Enter point 3365 target 3375 stop Loss 3358Here's a breakdown of your XAU/USD (Gold vs. US Dollar) trade setup:
---
🟡 Trade Setup (Long/Buy Position)
Entry: 3365
Take Profit (TP): 3375
Stop Loss (SL): 3358
---
🔍 Trade Metrics
Risk (SL): 3365 - 3358 = 7 pips
Reward (TP): 3375 - 3365 = 10 pips
Risk-Reward Ratio: 10 / 7 ≈ 1.43:1
---
✅ Analysis
The risk-reward ratio is favorable (above 1), which is generally a good sign.
Tight SL (7 pips) and moderate TP (10 pips) suggest a scalping or intraday strategy.
Make sure market volatility and liquidity conditions at the time support such small pip movements (e.g., during major market hours or news releases).
---
⚠️ Key Tips
Spread: Ensure the spread on XAU/USD is tight enough to not eat into your SL.
Slippage: Fast market movements (especially during news) could cause your entry or SL to slip.
Confirmation: Use technical indicators (e.g., support/resistance, RSI, MACD) to confirm this level is a good entry.
Would you like help evaluating whether current market conditions support this trade idea? I can look it up for you.

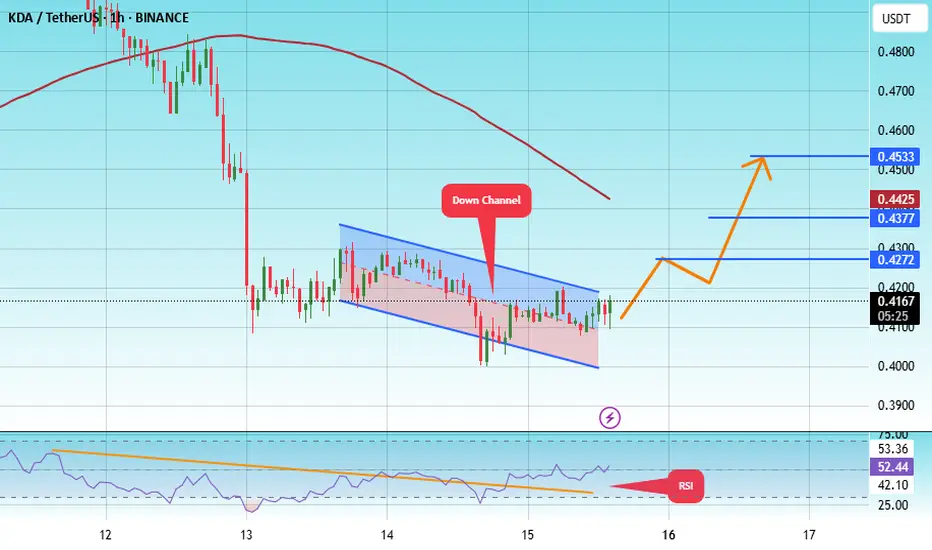
#KDA/USDT#KDA
The price is moving within a descending channel on the 1-hour frame, adhering well to it, and is heading toward a strong breakout and retest.
We are experiencing a rebound from the lower boundary of the descending channel. This support is at 0.4043.
We are experiencing a downtrend on the RSI indicator, which is about to break and retest, supporting the upward trend.
We are heading toward stability above the 100 Moving Average.
Entry price: 0.4167
First target: 0.4274
Second target: 0.4377
Third target: 0.4533
19.06.25 Morning ForecastPairs on Watch -
FX:EURGBP
FX:EURAUD
FX:AUDNZD
A short overview of the instruments I am looking at for today, multi-timeframe analysis down to what I will be looking at for an entry. Enjoy!

CHECK GBPJPY SIGNAL READ CAPTAINusdjpy sell now ✅
entry point (145.300) (145.200)
TAKE PROFIT 1: (144.850)
TAKE PROFIT 2: (144.400)
LAST TARGET (144.000)
STOP LOSS (145.800)

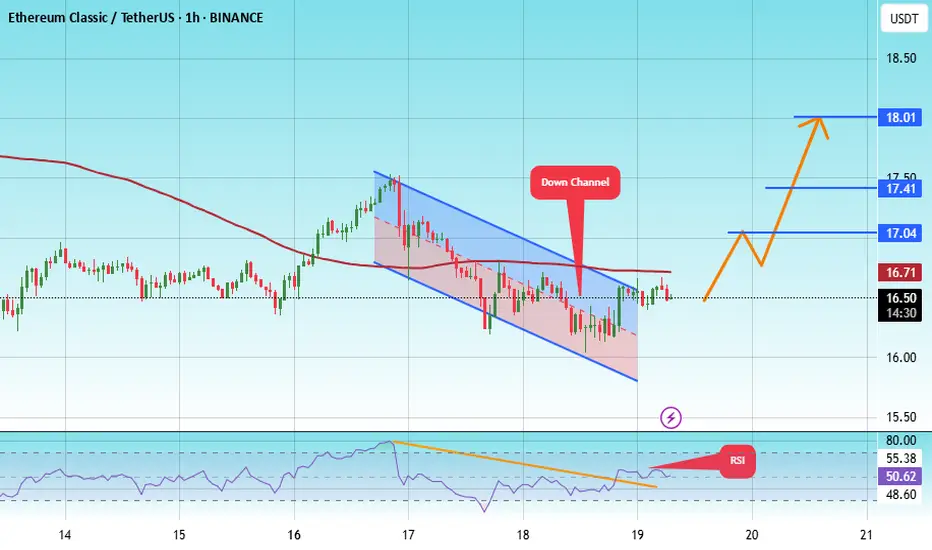
#ETC/USDT#ETC
The price is moving within a descending channel on the 1-hour frame, adhering well to it, and is heading towards a strong breakout and retest.
We are experiencing a rebound from the lower boundary of the descending channel. This support is at 16.
We are experiencing a downtrend on the RSI indicator, which is about to break and retest, supporting the upward trend.
We are heading for stability above the 100 moving average.
Entry price: 16.50
First target: 17
Second target: 17.50
Third target: 18
#GTC/USDT#GTC
The price is moving within a descending channel on the 1-hour frame, adhering well to it, and is heading towards a strong breakout and retest.
We are seeing a bounce from the lower boundary of the descending channel. This support is at 0.224.
We have a downtrend on the RSI indicator that is about to be broken and retested, which supports the upward trend.
We are looking for stability above the 100 moving average.
Entry price: 0.234
First target: 0.245
Second target: 0.255
Third target: 0.266

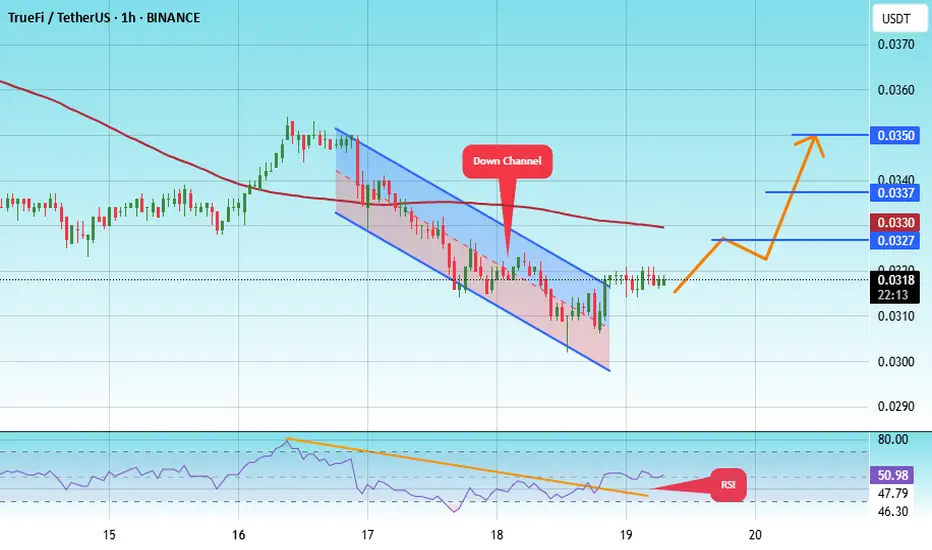
#TRU/USDT#TRU
The price is moving within a descending channel on the 1-hour frame, adhering well to it, and is heading towards a strong breakout and retest.
We are experiencing a rebound from the lower boundary of the descending channel. This support is at 0.0300.
We are experiencing a downtrend on the RSI indicator, which is about to break and retest, supporting the upward trend.
We are in a trend of consolidation above the 100 Moving Average.
Entry price: 0.0315
First target: 0.0327
Second target: 0.0337
Third target: 0.0350
CHECK GBPJPY SIGNAL READ CAPTAINgbpjpy buy now ✅
entry point (194.900) (194.800)
TAKE PROFIT 1: (195.200)
TAKE PROFIT 2: (195.600)
LAST TARGET (196.000)
STOP LOSS (194.400)
