Total shows a big big ult partyTotal besides the Bitcoin and usdt dominance, indicates that we can have a huge ult season. The probability is 60%
Harmonic Patterns

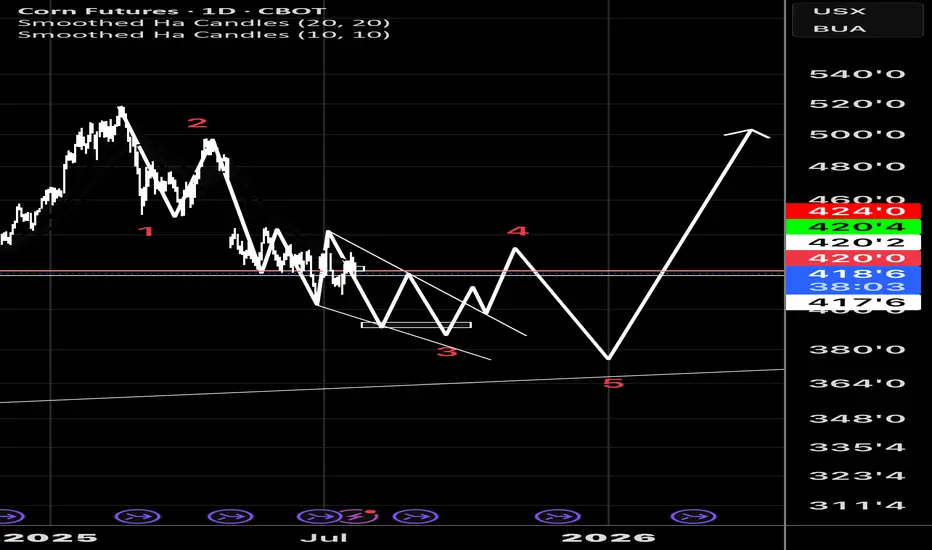
Christmas corn. Can we get under 4.00If the above scenario plays out, looks like we can grind down to 393 in c wave of an ending diagonal to finish a w5 of 3.
Nifty Metal: Heating Up or Just Polishing the Armor?After a healthy consolidation phase, the Nifty Metal Index is finally starting to flex some muscle. While it’s been behaving like a shy warrior at a dance-off, the structure now looks technically stronger and poised for a potential bullish breakout.
We’ve seen two failed breakout attempts (clearly marked with trendlines)—both classic cases of “all hype, no flight.” But this time, after a tight range consolidation between July 9th and July 18th, it has stepped out of its shell and is teasing a real move.
Next resistance around ₹9,675—and maybe even beyond, if momentum supports the story.
Until then, sitting tight, sharpening the filters, and scouting for individual metal stocks showing relative strength!!!

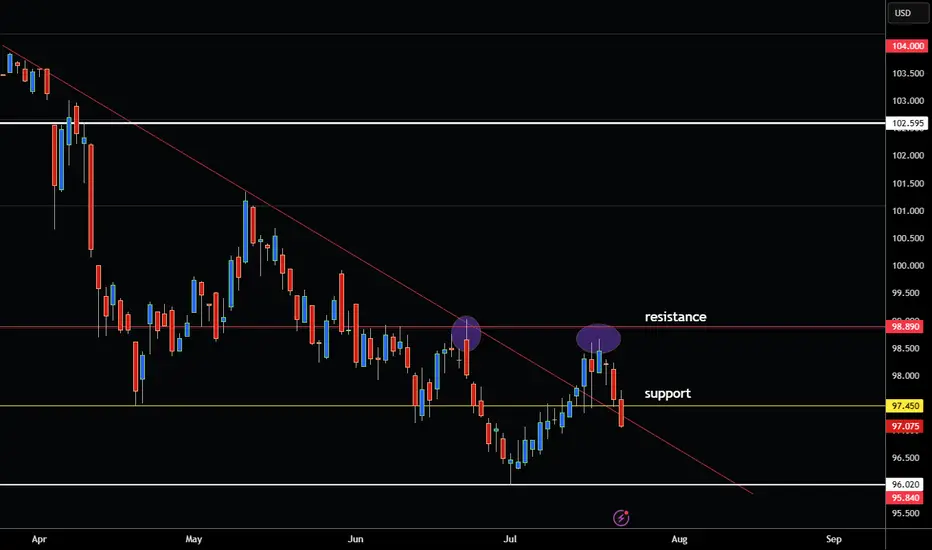
US DOLLAR INDEX BREAKING BELOW SUPPORT LEVEL RE-ENTER DOWNTREND! Hey Traders so today looking at the US Dollar Index or DX Market we can see that it has been in a solid downtrend since March. This is why alot of commodities and currencies have been getting stronger against it.
This is why I feel you don't need indicators to trade because price action shows you almost everything you need to be successful. A simple trendline and support and resistance is all you need to imo to see the story the market is trying to tell.
I'm not saying it's the holy grail of trading no one has a crystal ball we are all taking educated bets or guesses on where the market will go.
But most of the time it works! Key word there (most of the time)😁
Ok enough humor for today so getting down to it.
Now we see it is breaking below which is 97.45 from back in April. Also notice that 98.89 that got rejected twice once in June again last week. If market can get a daily close today below 97.45 this shows me that US Dollar Trend is still down. Now that it has re-entered under the downtrend line I would looks to sell rallies or buy markets against USD. Euro,Pound,Aussie,Gold, Commodities etc...
However if bullish USD I would wait for market to close above 98.89. That way you have true confirmation that the market wants to break higher because it will have formed a bottom formation!
Good Luck & Always use Risk Management!
(Just in we are wrong in our analysis most experts recommend never to risk more than 2% of your account equity on any given trade.)
Hope This Helps Your Trading 😃
Clifford
Market Overview/Trade RecapsKeep it simple guys keep learning keep getting better every single day find put what you need to become profitable

USDJPYDate:
July 22,2025
Session:
Tokyo and London session
Pair:
USDJPY
Bias:
Long
1. Clean liquidity pool left unswept from last week's NYC Open (Thursday).
Took this trade earlier today but looks like price wanted to consolidate in the liquid pool its currently in. I still hold the same idea and think the sweep will definitely take place sometime this week. Now looks like the perfect time to enter. If Asia session cant get it done its up to London and New York session.
Entry:147.534
Stop Loss:147.215
Target:148.768
RR:3.89

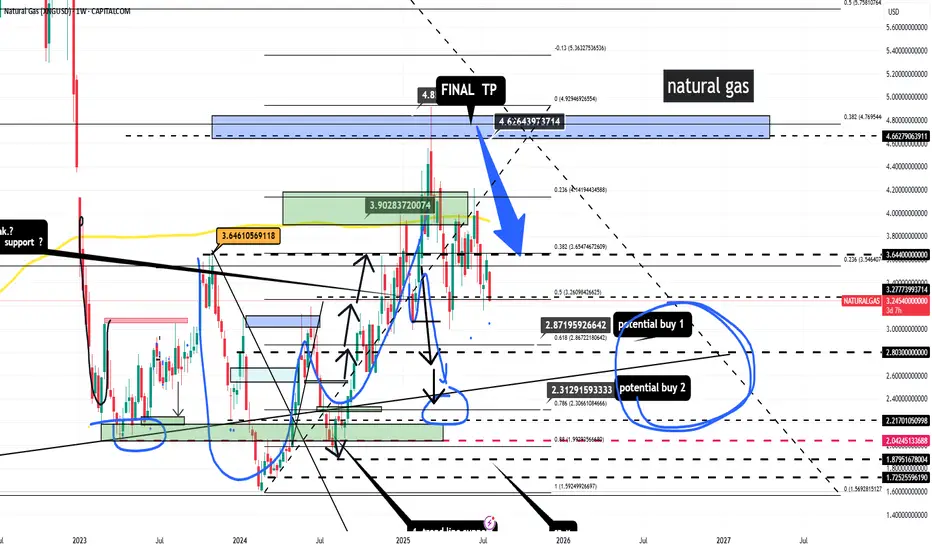
natural gas xngusd long point
2 buy zone marked on the chart with no stop loss
based on price action
COIN Weekly Bullish Options Setup (Jul 22, 2025)
🚀 NASDAQ:COIN Weekly Bullish Options Setup (Jul 22, 2025)
Institutional call flow is heavy. Momentum is fading — but not dead. Volume confirms bulls. This is a calculated strike before earnings zone noise.
⸻
📊 Trade Setup
• 🎯 Direction: CALL
• 📍 Strike: 410
• 💰 Entry: $14.70
• 🎯 Target: $17.00+
• 🛑 Stop: $11.60
• ⏰ Expiry: 07/25/2025 (3DTE)
• 📈 Confidence: 65%
• 📍 Entry Timing: Market open
⸻
🔍 Model Consensus (Multi-AI Synthesis)
• 🟢 3/5 models bullish: Grok, Llama, DeepSeek
• 🟡 1 neutral: Gemini (momentum divergence noted)
• 🔴 1 bearish: Claude (overbought RSI divergence risk)
• 📈 VIX < 22 = Green Light
• 🧠 Key Catalyst: PNC x Coinbase partnership + institutional volume surge
• 📉 Watch for RSI reversal > Weekly 83.5
⸻
📎 Trade Logic
• Options flow + volume = 🔥 institutional accumulation
• RSI high but manageable — expect momentum pockets, not full reversals
• Range target: $428–$444.65
• Stop loss = discipline, not fear
⸻
🧠 Risk Note:
• Momentum divergence is real.
• Avoid chasing if VIX > 22 or if open shows reversal.
• Size small. Let the volume do the work.
⸻
📢 Tagline (for virality)
“Snakes see a breakout, but bulls smell blood. NASDAQ:COIN loading calls on institutional flow. 3DTE scalp or breakout runner. Your move.” 🐂📈

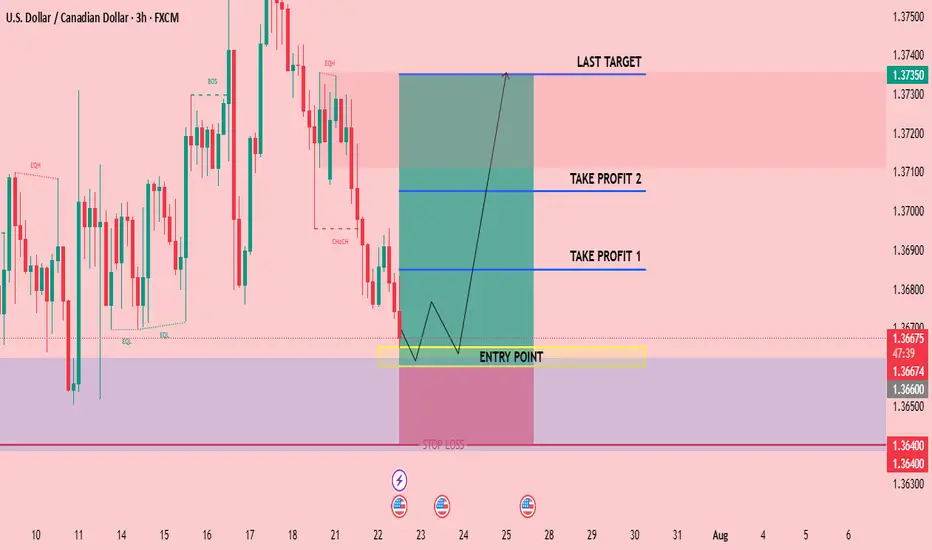
CHECK USDCAD SIGNAL READ THE CAPTAINEntry Point: Around 1.36650 1.36600
Stop Loss: Around 1.36400
🎯 Target Levels
Take Profit 1:
1.36850
Take Profit 2:
1.37050
last target
1.37350
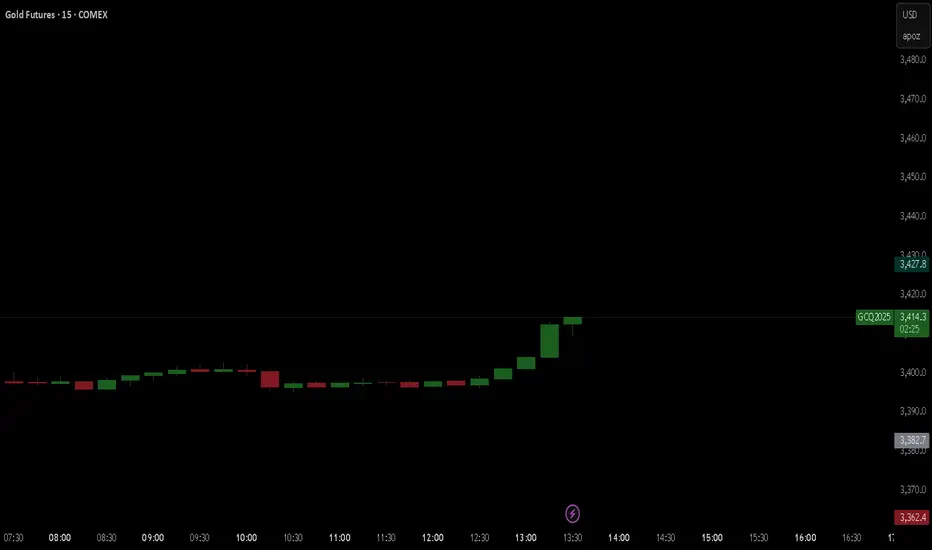
GOLD BULISHHello, I hope you are well today. Gold will likely rise. I advise you to buy into your positions.
$XRP SHORT POSITIONING 🚨 XRP Market Update – July 22, 2025
📉 Current Price: ~$3.49 USD
24H Range: $3.43 – $3.64
24H Volume: Over $10 Billion
Market Sentiment: Slight correction amid broader crypto market pullback.

Crypto total market seems to be heading to $10 TConsidering the current market movements reaching $10T for total market can be achievable as the channel top.

HUGE Cup & Handle On BTC/GOLDAre we in the same situation as in 2017? At that time, BTC followed with a 500% rally. Do you think history is repeating itself?
If we use the same percentages, we'll have a BTC/GOLD rally of 600%. This would mean that BTC could make 250%.

BTC Top-Down Analysis (Weekly, Daily, 4H)Weekly, Daily, and overall trend is bullish only 4H internal structure is short-term bearish with price trading inside a 4H demand zone.
From weekly timeframe:
- Inverse head & shoulders is forming showing trend continuation.
- ATH trendline (Nov 2021) has flipped from resistance to support — not retested yet.
- Major supports all align between 113K–109K including:
- CME Gap: 114380–115635
- Trendline: 113798
- Neckline: 112800
- Weekly Bullish OB: 110520
- Harmonic Bat PRZ: 109350
My Thoughts:
This 113K–109K zone is a high-confluence support area I’ll only consider buying BTC within this range.
This analysis remains valid as long as the weekly candle doesn’t close below the Bullish OB (105K) or above the ATH.

ankr short trade in my opinion this is a good trade with a good r/r hope hit the tp consider this is my trade not your trade and i just like to share my trades with world

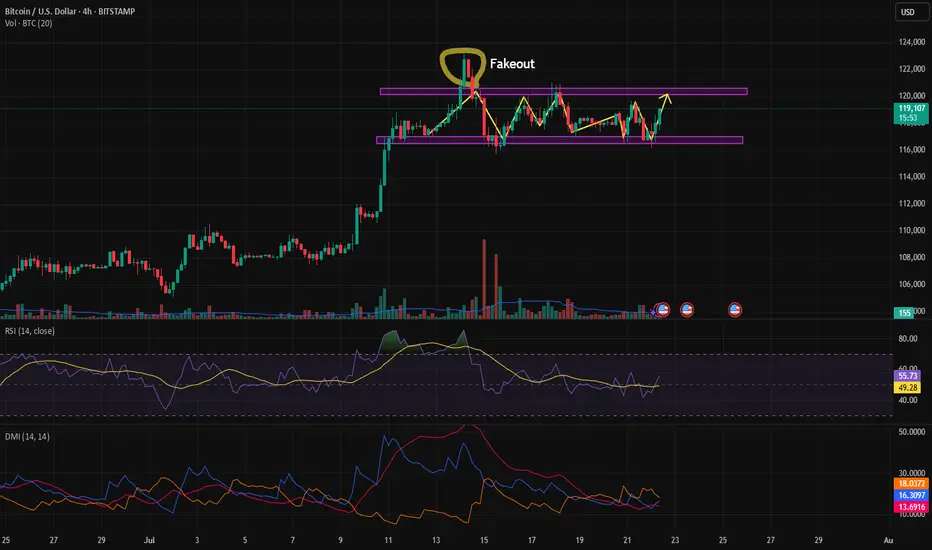
Range in BitcoinBitcoin has been ranging for nearly 12 days, and based on range-trading strategies, it's now possible to take a position. There's a high probability that the price will move toward the top of the range. For taking positions near the bottom of the range, we need to wait for a trigger since we're trading against the current direction. In case of a breakout above the range, we should be cautious of fakeouts.
BTC BITCOIN THE BTC 135K ZONE ON the ascending trend line will like happen ,as the structure never lies.
at the moment am looking at a retest into 124k and we either get a double top structure to sell on rejection or we keep buying into 135k and sell from the supply roof of the ascending bullish trendline .
trading is 100% probability ,trade with caution.
ANY KEY LEVEL CAN FAIL .

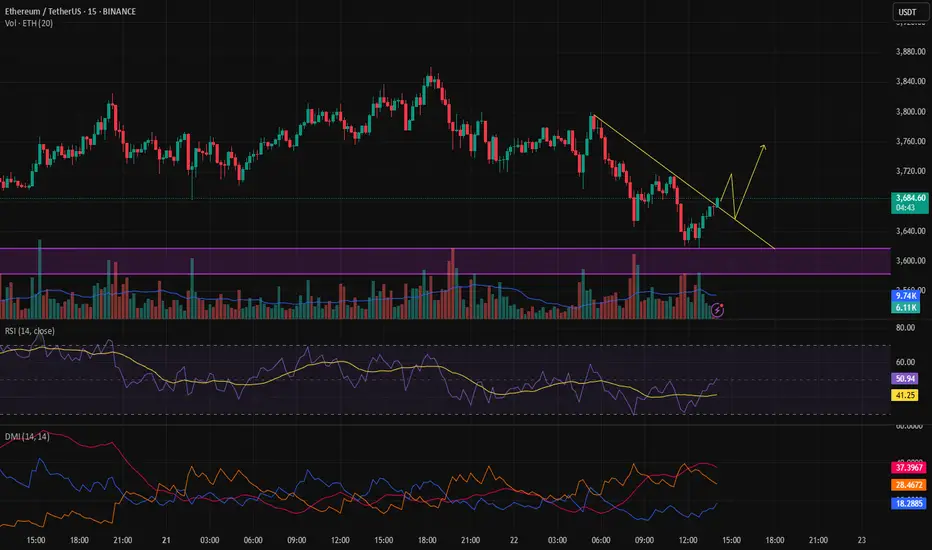
Ethereum 15m Analysis – Waiting for Bullish ConfirmationAfter a step up, Ethereum made a pullback, and a news event released today caused the correction to deepen.
So far, we haven’t received any bullish confirmation.
If the price pulls back to the marked level and gives confirmation on the 15-minute timeframe, we can look for a buy opportunity.
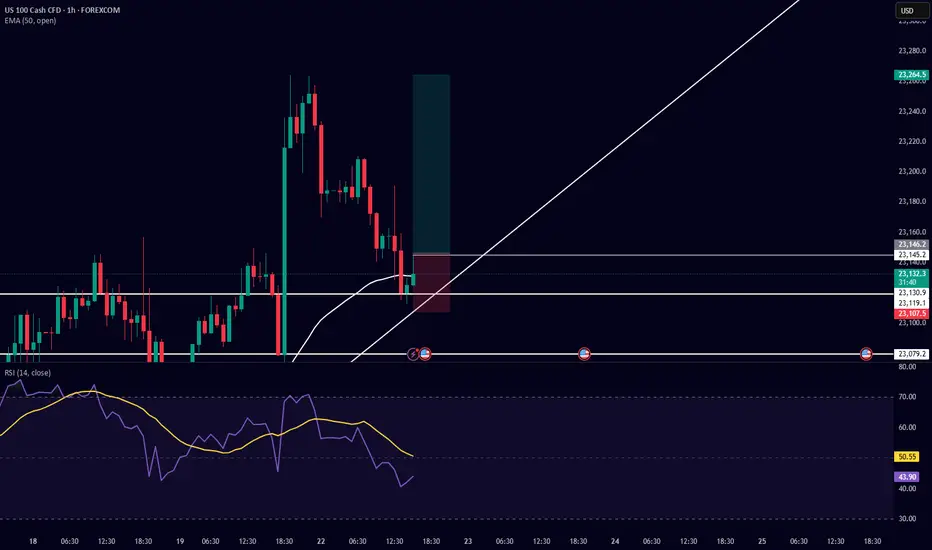
Trade Setup Description (Buy Side) – US100 (Nasdaq 100) 5-MinuteI am taking a buy-side trade on US100 based on the following confluences:
Support & Trendline Respect:
Price respected a horizontal support level near 23,079.2 and is currently bouncing from a rising trendline, showing potential for a bullish move.
Bullish Candlestick Reaction:
After testing the trendline, bullish candles formed, indicating buying interest at this zone.
EMA 50 Reclaim Potential:
Price is attempting to reclaim the 50 EMA (currently at 23,141.3). A successful break and hold above it would confirm bullish momentum.
RSI Confirmation:
RSI is currently around 47 and curving upwards, indicating a potential reversal from oversold/neutral territory. The RSI yellow moving average is also turning up.
Risk-Reward Ratio:
The setup has a favorable risk-to-reward ratio with the stop loss placed just below the trendline and recent wick low, and the target placed above the recent high around 23,264.5.
Total to 5T & BTC to...?Morning fellas,
No way BTC is stopping here. People are gonna get reckt shorting, and are not gonna believe where this price action is gonna stop.
TOTAL must reach anywhere between 4.5T & 5T, this spread across all Alts.
It has been a long time coming, and the party hasnt even started yet.
Hold your horses and trade thirsty, my friends!

idealistic trade of usdchfsharing my insights of the trade that im holding .....hopefull this will educate lot of people out the ....................

#RLC/USDT Pump Anticipated#RLC
The price is moving within a descending channel on the 1-hour frame, adhering well to it, and is on its way to breaking strongly upwards and retesting it.
We have support from the lower boundary of the descending channel, at 1.155.
We have a downtrend on the RSI indicator that is about to be broken and retested, supporting the upside.
There is a major support area in green at 1.143, which represents a strong basis for the upside.
Don't forget a simple thing: ease and capital.
When you reach the first target, save some money and then change your stop-loss order to an entry order.
For inquiries, please leave a comment.
We have a trend to hold above the 100 Moving Average.
Entry price: 1.170.
First target: 1.200.
Second target: 1.234.
Third target: 1.282.
Don't forget a simple thing: ease and capital.
When you reach your first target, save some money and then change your stop-loss order to an entry order.
For inquiries, please leave a comment.
Thank you.

#EDU/USDT#EDU
The price is moving within a descending channel on the 1-hour frame, adhering well to it, and is on its way to breaking strongly upwards and retesting it.
We have support from the lower boundary of the descending channel, at 0.1464.
We have a downtrend on the RSI indicator that is about to be broken and retested, supporting the upside.
There is a major support area in green at 0.1442, which represents a strong basis for the upside.
Don't forget a simple thing: ease and capital.
When you reach the first target, save some money and then change your stop-loss order to an entry order.
For inquiries, please leave a comment.
We have a trend to hold above the 100 Moving Average.
Entry price: 0.1487
First target: 0.1528
Second target: 0.1570
Third target: 0.1620
Don't forget a simple thing: ease and capital.
When you reach your first target, save some money and then change your stop-loss order to an entry order.
For inquiries, please leave a comment.
Thank you.
