BTCUSD NEW OUTLOOK BULLISH MOVES 19/6/2025buy 104.800
buy 104.300
take profit 105.300
take profit 105.800
take profit 106.500
Stop los 103.500
Harmonic Patterns
SOL! Would get a life again?SOL as said earlier, I cant post links due to policy, but the ones who know they know when i drew it and how its going, perfect!!!

XAU/USD NEW OUTLOOK BULLISH MOVES 19/6/2025Buy 3370
Limit 3367
take profit 3380
take profit 3390
take profit 3400
stop los 3360
SPKUSDT Long Opportunity | UT Bot Signal + Fib Extension PlaySPKUSDT showing a bullish setup after a UT Bot BUY signal at 0.0530–0.0535 zone.
Confirmation with:
📈 Volume breakout
✅ QQE MOD green spike
💹 EMA crossover
🎯 Targets:
TP1: 0.0560
TP2: 0.0578
TP3: 0.0600 (Fibonacci 1.618 extension)
🛡️ SL: 0.0518 (below swing low)
Risk-to-reward is favorable. As always, manage your risk.

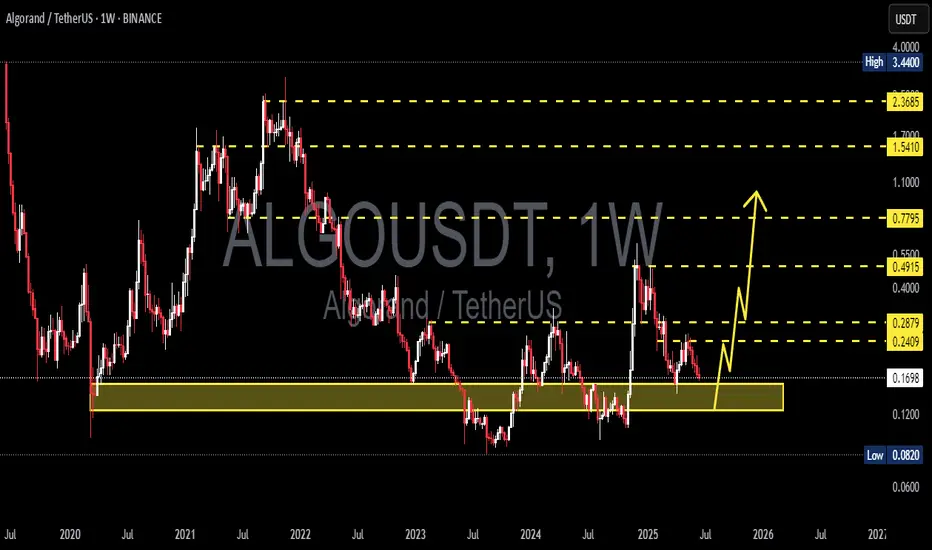
ALGOUSDT 1W AnalysisALGO ~ 1W Analysis
#ALGO Buy back gradually from here with a short-term target of at least 20%++.
TUSDT 1W AnalysisTUSDT ~ 1W Analysis
#TUSDT This trade is very high risk. Buy if you still have confidence in this coin with a short term target of at least 20%++

SPX Listed on Binance - 3$ Very SoonBinance to begin deposits of SPX tomorrow June 19, expect movement, this will be the #1 Memecoin this cycle! The following is too strong, all holders believe in something. I don’t see how it doesn’t touch $50-$100 this cycle

ACHUSDT 1W AnalysisACH ~ 1W Analysis
#ACH This trade is very high risk. Buy from here if you still have confidence in this coin with a short term target of 20%+.

BAKEUSDT 1W AnalysisBAKE ~ 1W Analysis
#BAKE Buy back gradually from here with a short term target of at least 20%+ from this support.

XAUUSD – Support Under Threat, Deeper Decline LoomsGold is stalling below the 3,444 USD resistance, forming a series of lower highs — a clear sign of weakening bullish momentum. The support area around 3,358 USD is under pressure, and a break below this level could trigger a drop toward 3,280 USD.
On the news front, the FOMC has reaffirmed its hawkish stance, making no mention of a rate cut despite signs of slowing economic growth. This has strengthened the USD, placing additional downward pressure on gold.
In summary, XAUUSD is on the verge of breaking its bullish structure. If current support fails, sellers may take full control of the market.
XAUUSD Trade Idea:
Position: SELL if price breaks below 3,358 USD
Target: 3,304 – 3,280 USD
Stop Loss: Above 3,400 USD

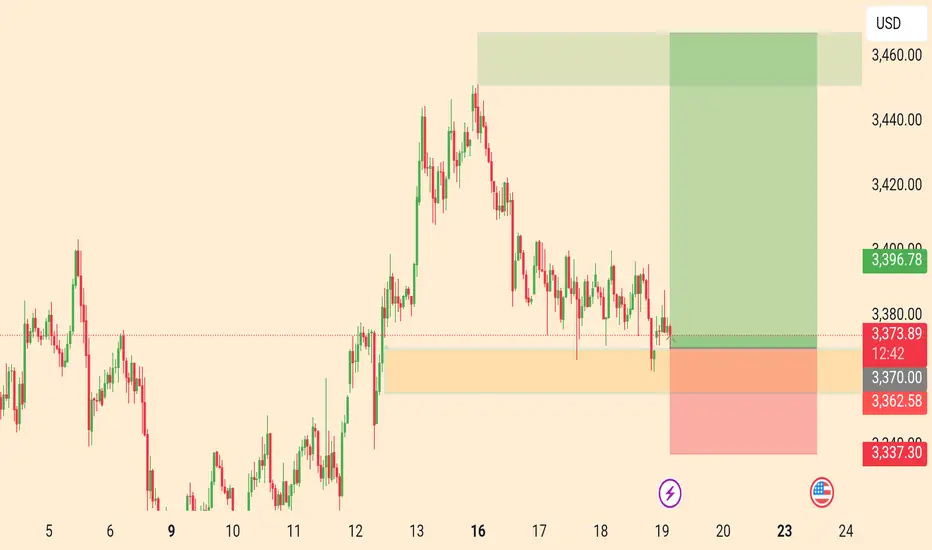
GBPUSD H4 I Bullish RiseBased on the H4 chart analysis, we can see that the price is trading near our buy entry at1.3373 -1.13396, which is a pullback support that aligns with the 50% Fib retracement.
Our take profit will be at 1.3466, which is an overlap resistance
The stop loss will be placed at 1.3320 which is a pullback support below the 61.8% Fib retracement.
High Risk Investment Warning
Trading Forex/CFDs on margin carries a high level of risk and may not be suitable for all investors. Leverage can work against you.
Stratos Markets Limited (tradu.com ):
CFDs are complex instruments and come with a high risk of losing money rapidly due to leverage. 63% of retail investor accounts lose money when trading CFDs with this provider. You should consider whether you understand how CFDs work and whether you can afford to take the high risk of losing your money.
Stratos Europe Ltd (tradu.com ):
CFDs are complex instruments and come with a high risk of losing money rapidly due to leverage. 63% of retail investor accounts lose money when trading CFDs with this provider. You should consider whether you understand how CFDs work and whether you can afford to take the high risk of losing your money.
Stratos Global LLC (tradu.com ):
Losses can exceed deposits.
Please be advised that the information presented on TradingView is provided to Tradu (‘Company’, ‘we’) by a third-party provider (‘TFA Global Pte Ltd’). Please be reminded that you are solely responsible for the trading decisions on your account. There is a very high degree of risk involved in trading. Any information and/or content is intended entirely for research, educational and informational purposes only and does not constitute investment or consultation advice or investment strategy. The information is not tailored to the investment needs of any specific person and therefore does not involve a consideration of any of the investment objectives, financial situation or needs of any viewer that may receive it. Kindly also note that past performance is not a reliable indicator of future results. Actual results may differ materially from those anticipated in forward-looking or past performance statements. We assume no liability as to the accuracy or completeness of any of the information and/or content provided herein and the Company cannot be held responsible for any omission, mistake nor for any loss or damage including without limitation to any loss of profit which may arise from reliance on any information supplied by TFA Global Pte Ltd.
The speaker(s) is neither an employee, agent nor representative of Tradu and is therefore acting independently. The opinions given are their own, constitute general market commentary, and do not constitute the opinion or advice of Tradu or any form of personal or investment advice. Tradu neither endorses nor guarantees offerings of third-party speakers, nor is Tradu responsible for the content, veracity or opinions of third-party speakers, presenters or participants.

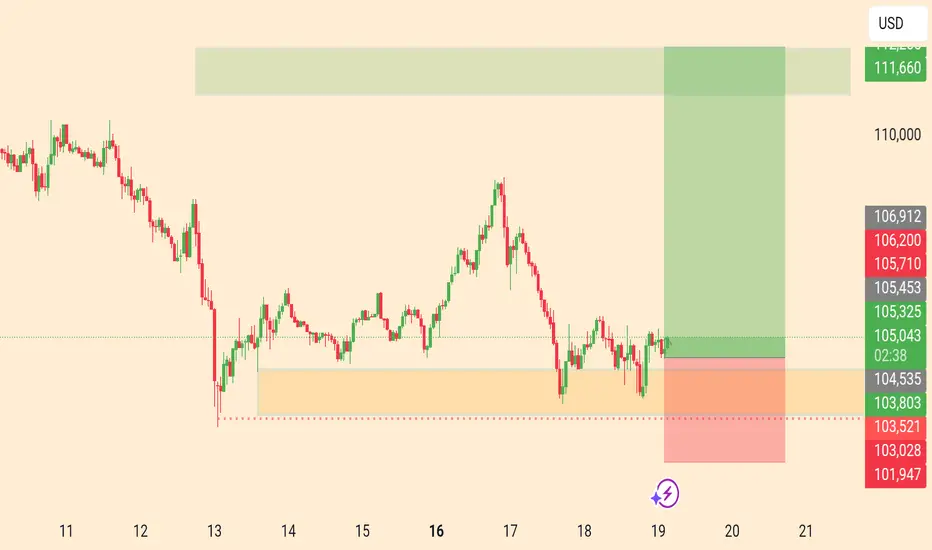
EURUSD H1 I Bullish Bounce Off Based on the H1 chart analysis, we can see that the price is trading near our buy entry at1.143-1.1454, which is a pullback support that aligns with the 78.6% Fib retracement and the 61.8% Fib projection, providing a significant level for a potential bullish reversal.
Our take profit will be at 1.1487, which is an overlap resistance
The stop loss will be placed at 1.1405, which is a multi-swing low support level.
High Risk Investment Warning
Trading Forex/CFDs on margin carries a high level of risk and may not be suitable for all investors. Leverage can work against you.
Stratos Markets Limited (tradu.com ):
CFDs are complex instruments and come with a high risk of losing money rapidly due to leverage. 63% of retail investor accounts lose money when trading CFDs with this provider. You should consider whether you understand how CFDs work and whether you can afford to take the high risk of losing your money.
Stratos Europe Ltd (tradu.com ):
CFDs are complex instruments and come with a high risk of losing money rapidly due to leverage. 63% of retail investor accounts lose money when trading CFDs with this provider. You should consider whether you understand how CFDs work and whether you can afford to take the high risk of losing your money.
Stratos Global LLC (tradu.com ):
Losses can exceed deposits.
Please be advised that the information presented on TradingView is provided to Tradu (‘Company’, ‘we’) by a third-party provider (‘TFA Global Pte Ltd’). Please be reminded that you are solely responsible for the trading decisions on your account. There is a very high degree of risk involved in trading. Any information and/or content is intended entirely for research, educational and informational purposes only and does not constitute investment or consultation advice or investment strategy. The information is not tailored to the investment needs of any specific person and therefore does not involve a consideration of any of the investment objectives, financial situation or needs of any viewer that may receive it. Kindly also note that past performance is not a reliable indicator of future results. Actual results may differ materially from those anticipated in forward-looking or past performance statements. We assume no liability as to the accuracy or completeness of any of the information and/or content provided herein and the Company cannot be held responsible for any omission, mistake nor for any loss or damage including without limitation to any loss of profit which may arise from reliance on any information supplied by TFA Global Pte Ltd.
The speaker(s) is neither an employee, agent nor representative of Tradu and is therefore acting independently. The opinions given are their own, constitute general market commentary, and do not constitute the opinion or advice of Tradu or any form of personal or investment advice. Tradu neither endorses nor guarantees offerings of third-party speakers, nor is Tradu responsible for the content, veracity or opinions of third-party speakers, presenters or participants.

EURAUD 1H is forming a Harmonic Reversal pattern
Price formed ABCD Harmonic Reversal pattern with a neckline as current Temporary Resistance.
• ✅ Entry is triggered only after no new lower low is formed and higher high and higher low is printed.
• Instant Buy
• Stop Loss is at the recent lower Low (safe and logical placement). A bit lower than D Point
• 🎯 Take Profit levels are based on measured move projections.
Trade Plan:
• Instant Buy = 1.76767
• Stop Loss = 1.76106
• Take Profit 1: 1.77428
• Take Profit 2: 1.78057
• Lot size : 1:2 Risk Reward Ratio
EURAUD is forming a Harmonic Reversal pattern.
Key Highlights:
• ✅ Pattern: ABCD
•⚠️ Confirmation: on PRZ price bounced + Bullish candle
• 🔄 Risk Management: Tight SL, 2 TP levels
• 🧩 Confluence: ABCD + Price bounced on D point

Technical Analaysis Setup – #BTC/USDTTechnical Analaysis Setup – #BTC/USDT
#Bitcoin is currently forming a bearish harmonic pattern indicating a potential correction toward key support zones.
📉 The price action suggests the development of a Gartley pattern with projected downside targets around $103,679, $101,931, and possibly extending to $97,419.
A critical resistance zone between $105,000 and $106,000 will be pivotal for either confirming bullish momentum or triggering a bearish reversal.
If BTC fails to break through this resistance and confirms the bearish reversal signal, a deeper decline toward the aforementioned support levels becomes highly probable.
🎯 Target 1: $103,679
🎯 Target 2: $101,931
🎯 Target 3: $97,419

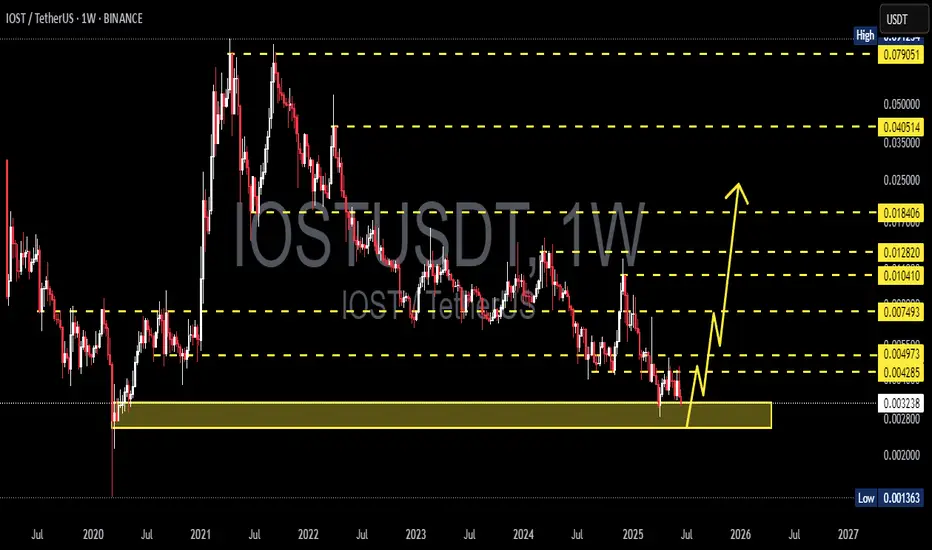
IOSTUSDT 1W AnalysisIOST ~ 1W Analysis
#IOST Buy back gradually from here with a short term target of at least 20%+ from this support.
HNTUSDT 5D AnalysisHNT ~ 5D Analysis
#HNT Buy back on retest of this support block with short term target of at least 20%+ from here.

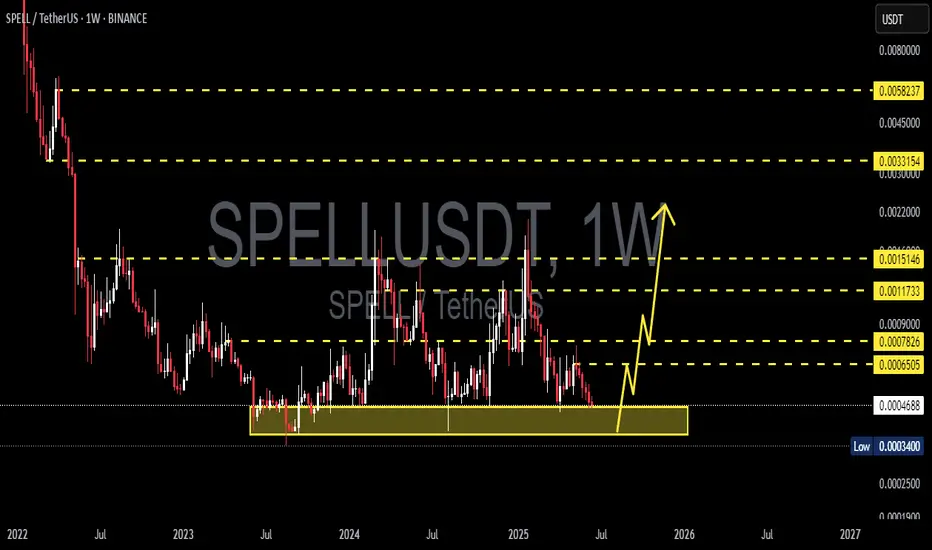
SPELLUSDT 1W AnalysisSPELL ~ 1W Analysis
#SPELL This is the lowest support for now. Buy from here if you still have faith in this coin with a short term target of at least 20%+.
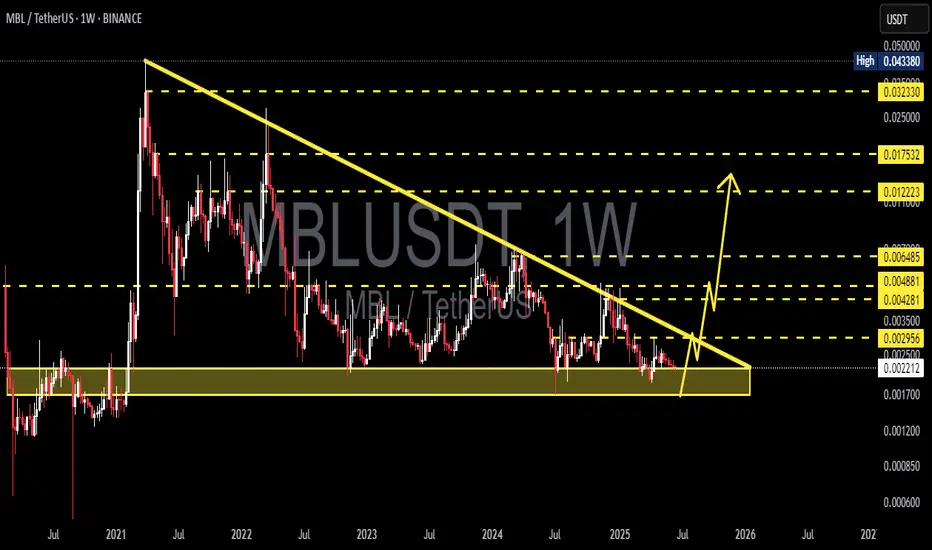
MBLUSDT 1W AnalysisMBL ~ 1W Analysis
#MBL This trade is very risky, buy if you still have confidence in this coin with a short term target of at least 20%+ from here.
ARPAUSDT 1W Analysis ARPA ~ 1W Analysis
#ARPA Buy back from here if you still have confidence in this coin with a short term target of at least 20%++.

DGBUSDT 1W AnalysisDGB ~ 1W Analysis
#DGB Buy back gradually from this support block with a short term target of at least 20%+ from here.

GBP/JPY H1 | Rising into an overlap resistanceGBP/JPY is rising towards an overlap resistance and could potentially reverse off this level to drop lower.
Sell entry is at 194.86 which is an overlap resistance.
Stop loss is at 195.43 which is a level that sits above the 38.2% Fibonacci retracement and a multi-swing-high resistance.
Take profit is at 193.95 which is a swing-low support.
High Risk Investment Warning
Trading Forex/CFDs on margin carries a high level of risk and may not be suitable for all investors. Leverage can work against you.
Stratos Markets Limited (tradu.com ):
CFDs are complex instruments and come with a high risk of losing money rapidly due to leverage. 63% of retail investor accounts lose money when trading CFDs with this provider. You should consider whether you understand how CFDs work and whether you can afford to take the high risk of losing your money.
Stratos Europe Ltd (tradu.com ):
CFDs are complex instruments and come with a high risk of losing money rapidly due to leverage. 63% of retail investor accounts lose money when trading CFDs with this provider. You should consider whether you understand how CFDs work and whether you can afford to take the high risk of losing your money.
Stratos Global LLC (tradu.com ):
Losses can exceed deposits.
Please be advised that the information presented on TradingView is provided to Tradu (‘Company’, ‘we’) by a third-party provider (‘TFA Global Pte Ltd’). Please be reminded that you are solely responsible for the trading decisions on your account. There is a very high degree of risk involved in trading. Any information and/or content is intended entirely for research, educational and informational purposes only and does not constitute investment or consultation advice or investment strategy. The information is not tailored to the investment needs of any specific person and therefore does not involve a consideration of any of the investment objectives, financial situation or needs of any viewer that may receive it. Kindly also note that past performance is not a reliable indicator of future results. Actual results may differ materially from those anticipated in forward-looking or past performance statements. We assume no liability as to the accuracy or completeness of any of the information and/or content provided herein and the Company cannot be held responsible for any omission, mistake nor for any loss or damage including without limitation to any loss of profit which may arise from reliance on any information supplied by TFA Global Pte Ltd.
The speaker(s) is neither an employee, agent nor representative of Tradu and is therefore acting independently. The opinions given are their own, constitute general market commentary, and do not constitute the opinion or advice of Tradu or any form of personal or investment advice. Tradu neither endorses nor guarantees offerings of third-party speakers, nor is Tradu responsible for the content, veracity or opinions of third-party speakers, presenters or participants.

Silver H1 | Overlap resistance at 38.2% Fibonacci retracementSilver (XAG/USD) is rising towards an overlap resistance and could potentially reverse off this level to drop lower.
Sell entry is at 36.83 which is an overlap resistance that aligns with the 38.2% Fibonacci retracement.
Stop loss is at 37.10 which is a level that sits above the 61.8% Fibonacci retracement and a pullback resistance.
Take profit is at 36.21 which is a multi-swing-low support that aligns closely with the 61.8% Fibonacci retracement.
High Risk Investment Warning
Trading Forex/CFDs on margin carries a high level of risk and may not be suitable for all investors. Leverage can work against you.
Stratos Markets Limited (tradu.com ):
CFDs are complex instruments and come with a high risk of losing money rapidly due to leverage. 63% of retail investor accounts lose money when trading CFDs with this provider. You should consider whether you understand how CFDs work and whether you can afford to take the high risk of losing your money.
Stratos Europe Ltd (tradu.com ):
CFDs are complex instruments and come with a high risk of losing money rapidly due to leverage. 63% of retail investor accounts lose money when trading CFDs with this provider. You should consider whether you understand how CFDs work and whether you can afford to take the high risk of losing your money.
Stratos Global LLC (tradu.com ):
Losses can exceed deposits.
Please be advised that the information presented on TradingView is provided to Tradu (‘Company’, ‘we’) by a third-party provider (‘TFA Global Pte Ltd’). Please be reminded that you are solely responsible for the trading decisions on your account. There is a very high degree of risk involved in trading. Any information and/or content is intended entirely for research, educational and informational purposes only and does not constitute investment or consultation advice or investment strategy. The information is not tailored to the investment needs of any specific person and therefore does not involve a consideration of any of the investment objectives, financial situation or needs of any viewer that may receive it. Kindly also note that past performance is not a reliable indicator of future results. Actual results may differ materially from those anticipated in forward-looking or past performance statements. We assume no liability as to the accuracy or completeness of any of the information and/or content provided herein and the Company cannot be held responsible for any omission, mistake nor for any loss or damage including without limitation to any loss of profit which may arise from reliance on any information supplied by TFA Global Pte Ltd.
The speaker(s) is neither an employee, agent nor representative of Tradu and is therefore acting independently. The opinions given are their own, constitute general market commentary, and do not constitute the opinion or advice of Tradu or any form of personal or investment advice. Tradu neither endorses nor guarantees offerings of third-party speakers, nor is Tradu responsible for the content, veracity or opinions of third-party speakers, presenters or participants.

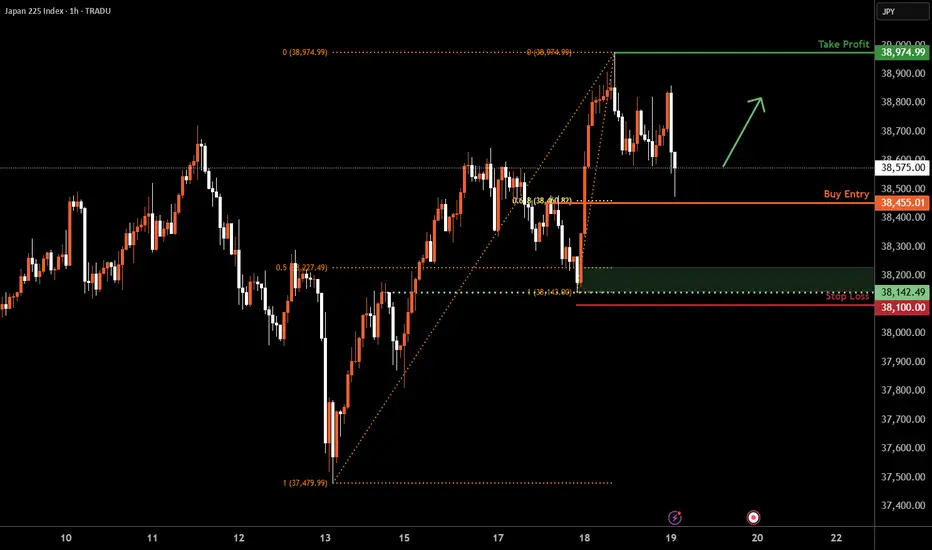
Nikkei 225 H1 | Pullback support at 61.8% Fibonacci retracementThe Nikkei 225 (JPN225) is falling towards a pullback support and could potentially bounce off this level to climb higher.
Buy entry is at 38,455.01 which is a pullback support that aligns with the 61.8% Fibonacci retracement.
Stop loss is at 38,100.00 which is a level that lies underneath an overlap support and the 50% Fibonacci retracement.
Take profit is at 38,974.99 which is a swing-high resistance.
High Risk Investment Warning
Trading Forex/CFDs on margin carries a high level of risk and may not be suitable for all investors. Leverage can work against you.
Stratos Markets Limited (tradu.com ):
CFDs are complex instruments and come with a high risk of losing money rapidly due to leverage. 63% of retail investor accounts lose money when trading CFDs with this provider. You should consider whether you understand how CFDs work and whether you can afford to take the high risk of losing your money.
Stratos Europe Ltd (tradu.com ):
CFDs are complex instruments and come with a high risk of losing money rapidly due to leverage. 63% of retail investor accounts lose money when trading CFDs with this provider. You should consider whether you understand how CFDs work and whether you can afford to take the high risk of losing your money.
Stratos Global LLC (tradu.com ):
Losses can exceed deposits.
Please be advised that the information presented on TradingView is provided to Tradu (‘Company’, ‘we’) by a third-party provider (‘TFA Global Pte Ltd’). Please be reminded that you are solely responsible for the trading decisions on your account. There is a very high degree of risk involved in trading. Any information and/or content is intended entirely for research, educational and informational purposes only and does not constitute investment or consultation advice or investment strategy. The information is not tailored to the investment needs of any specific person and therefore does not involve a consideration of any of the investment objectives, financial situation or needs of any viewer that may receive it. Kindly also note that past performance is not a reliable indicator of future results. Actual results may differ materially from those anticipated in forward-looking or past performance statements. We assume no liability as to the accuracy or completeness of any of the information and/or content provided herein and the Company cannot be held responsible for any omission, mistake nor for any loss or damage including without limitation to any loss of profit which may arise from reliance on any information supplied by TFA Global Pte Ltd.
The speaker(s) is neither an employee, agent nor representative of Tradu and is therefore acting independently. The opinions given are their own, constitute general market commentary, and do not constitute the opinion or advice of Tradu or any form of personal or investment advice. Tradu neither endorses nor guarantees offerings of third-party speakers, nor is Tradu responsible for the content, veracity or opinions of third-party speakers, presenters or participants.