How to Trade the Commitment of Traders Report Part 1Hey Traders so today I wanted to start a 3 part series on how to use the Commitment of Traders report to help you in your trading.
Enjoy!
Hope This Helps Your Trading 😃
Clifford
Harmonic Patterns

XRP at Critical Support After a DropXRP has declined 4.37% and is now trading at a major technical confluence zone near $0.209. This level includes the value area low, 200-day moving average, and a key daily support/resistance flip, making it a pivotal zone for short-term price action.
While the presence of strong support increases the probability of a bounce, it’s important to note that price has been consolidating at this level for some time. The more often a support is tested, the weaker it becomes — raising the risk of a potential breakdown. A loss of this zone would likely trigger a liquidity sweep, targeting lower levels unless quickly reclaimed.
For bulls, a clean defense of this level with volume and a move back above recent local highs would indicate a potential rotation toward the next resistance. For bears, a breakdown without a reclaim increases the likelihood of continuation to the downside.
This current zone is an inflection point, and traders should wait for confirmation — either a strong bounce or decisive breakdown — before taking positions.


where we go from hereVery likely taking a breather. However, as silver is very volatile, it could jump up to 38 or push through and back to 36 then even lower to 28 level. I would back up the truck if it goes back down to 28. Remember this is an industrial metal and everyone is talking about it on YouTube so this could be a bull trap right now as well. be careful. I know I said it was on fire yesterday but the situation has changed

PUT CALL GAVE A BUY SIGNAL TODAY I am looking for 6177/6183 The put/call model has given a buy signal that gives me a New record highsp500 and qqq how it has formed I am long calls at 50 % and 75 short OIL today best of trades WAVETIMER

XAUUSD Technical Analysis🟢 Current Market Overview
Price: $3,377.61
The market is currently trading within a defined range, showing consolidation above a strong support zone.
🔍 Key Technical Levels
Support Zone: $3,360 – $3,375
This level has been tested multiple times and held firmly, indicating strong buying interest 📈.
Resistance Zone: $3,435 – $3,455
Price has previously rejected this zone, suggesting active sellers in this area ⚠️.
🧠 Price Action Insight
The recent price structure shows a pullback into support after a strong bullish move.
The current consolidation suggests accumulation before a potential breakout.
A bullish reversal pattern seems to be forming near support, pointing toward a possible rally toward resistance.
📈 Projected Move
📍 Scenario: Bounce from support zone → Break toward resistance.
The marked projection curve suggests price may retest support, then rally to the $3,440–$3,455 resistance area.
🧾 Trading Outlook
Bias: Bullish (above $3,360)
Entry Zone: $3,365 – $3,375
Target: $3,440 – $3,455
Invalidation: Break and close below $3,355 (would indicate weakness) 🚫
📅 Fundamental Context
Multiple high-impact USD events are approaching 🇺🇸 (noted at the bottom of the chart). These could cause volatility and may act as catalysts for the breakout.
✅ Conclusion
The market is currently in a bullish accumulation phase above strong support. As long as this level holds, a move toward the resistance zone remains the high-probability scenario. Monitor closely for confirmation via bullish candlesticks or volume increase.

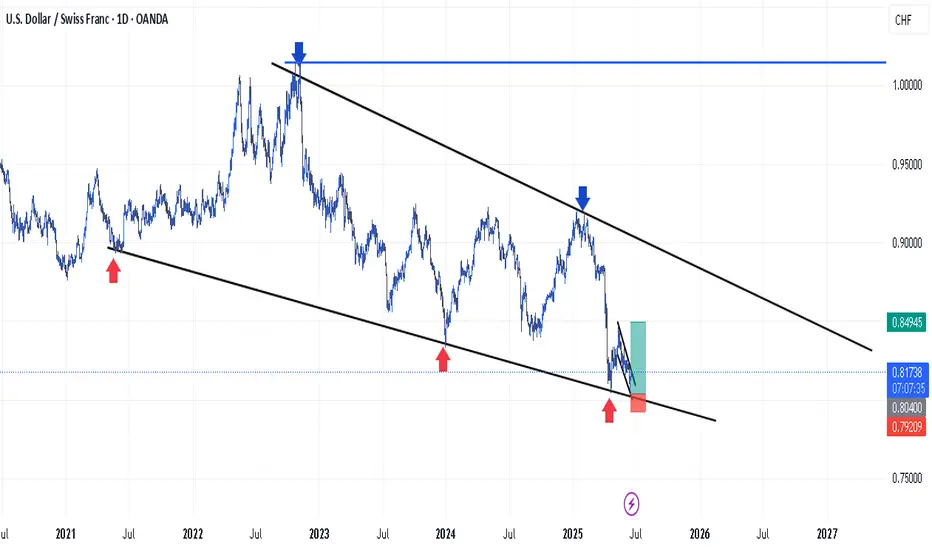
USDCHFIs USDCHF on the rise? 📈 Don't be fooled by the calm, this currency pair is keeping us all on edge. Keep a close watch and stay ahead of the game with these tips
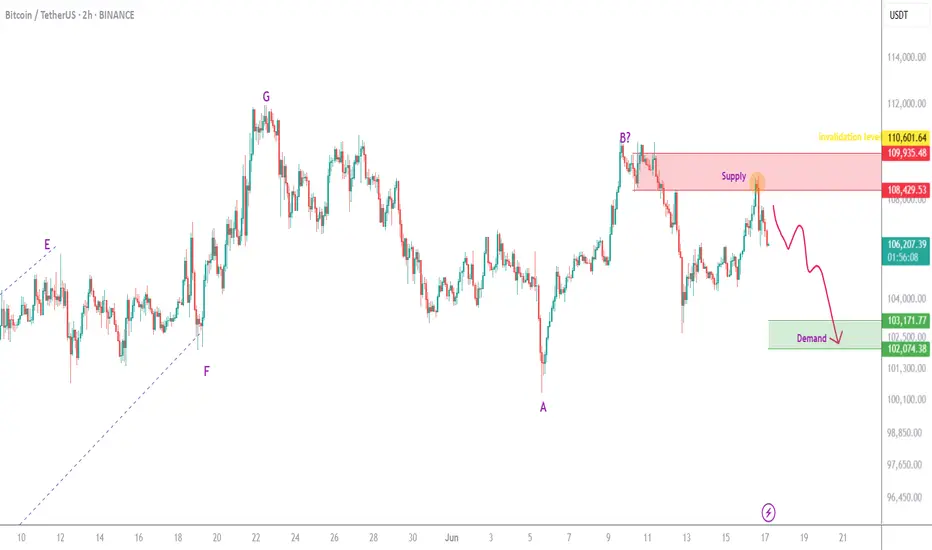
BTC is still bearishThe red zone seems to have had enough orders to reject the price downward. It is expected that the price will drop at least to the green zone below.
There will be some fluctuations along the way.
A daily candle closing above the invalidation level would invalidate this analysis.
Bullish Bat and Bullish Crab patternWe have added confluence on this long-term swing buy up to 1.37 and 1.38 area. Be Patient. Happy Trading.

XBRUSD is moving within the 65.95 - 76.55 range👀 Possible scenario:
Oil prices eased on June 18, with Brent trading near $75.15 per barrel, as traders awaited the U.S. Fed’s rate decision and monitored Iran-Israel tensions.
The Feed is expected to hold rates steady, but concerns over slowing global growth and Middle East instability could influence future cuts. Analysts warn that conflict-driven price spikes may fuel inflation, complicating policy moves. Markets are also watching the Strait of Hormuz, a key route for 20% of global oil. While a full Iranian export hell could be offset by OPEC+ spare capacity, a blockade would severely disrupt flows, especially to Asia. Despite risks, Commerzbank noted the market remains well supplied, with slow demand growth and rising OPEN+ output. However, ongoing trade disputes may weigh on future demand.
✅ Support and Resistance Levels
Now, the support level is located at 65.95.
Resistance levels are now located at 76.55 .

EURUSD broke the Support level 1.14865👀 Possible scenario:
The euro (EUR) rose 0.07% on June 16, supported by safe-haven flows as geopolitical tensions escalated. The move followed U.S. calls for evacuation from Tehran after intensified Israeli strikes, with former President Trump blaming Iran for rejecting a nuclear deal.
Markets now eye the Fed’s upcoming policy decision and June 17’s U.S. Retail Sales report at 12:30 p.m. UTC. Strong data may push EURUSD down toward 1.15000, while weaker numbers could lift it back to 1.16300. Peace talk updates between Israel and Iran may also impact sentiment.
✅ Support and Resistance Levels
Now, the support level is located at 1.14740
Resistance level is located at 1.16330

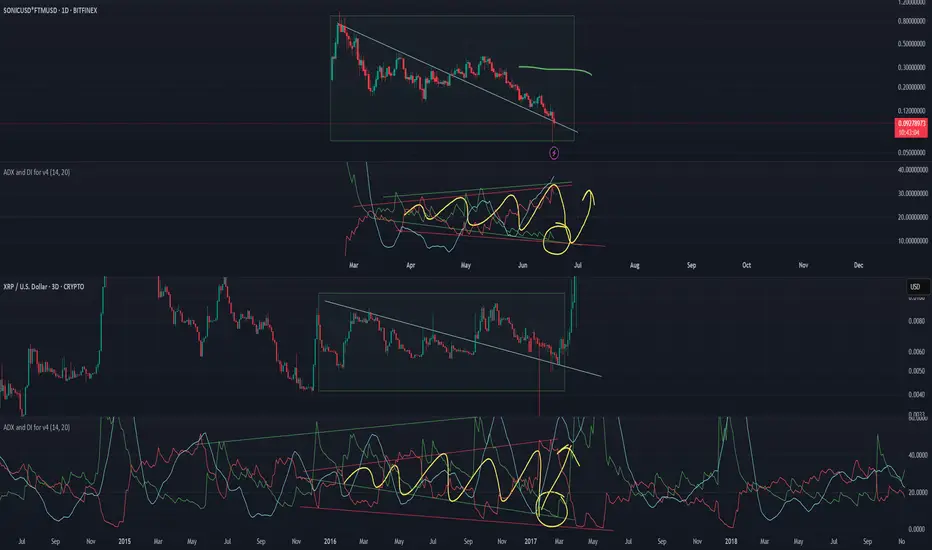
XRP folks, Sonic / Fantom is nextADX reading is identical, just on different frame. This is one of those alts that normally holds its price instead of doing classic dump.

FED RATES IMPACT ON XAUUSD FOMC Rate Cut:
The U.S. Federal Reserve might cut interest rates TONIGHT.
Weaker DXY (Dollar Index):
If the rate cut happens, the value of the U.S. Dollar (USD) might fall.
A weaker dollar is usually good for the U.S. economy and for exports.
Impact on Other Assets:
If the USD weakens:
The Euro (EURUSD) and British Pound (GBPUSD) will likely go up
Gold (XAUUSD) will also likely rise
War Risk & Safe Haven:
Because of ongoing war tensions, people still see the U.S. Dollar as a safe place to invest. So, even if USD goes down short-term, it may bounce back later (good for buying again).
WHAT POSSIBLE SCENARIO WE HAVE TODAY?
Market is moving in Rangbound 3375-3405.
If H4 CLOSES above 3405 then buy upto 3430.
If H4 CLOSES below 3370 then sell towards 3350.
#XAUUSD

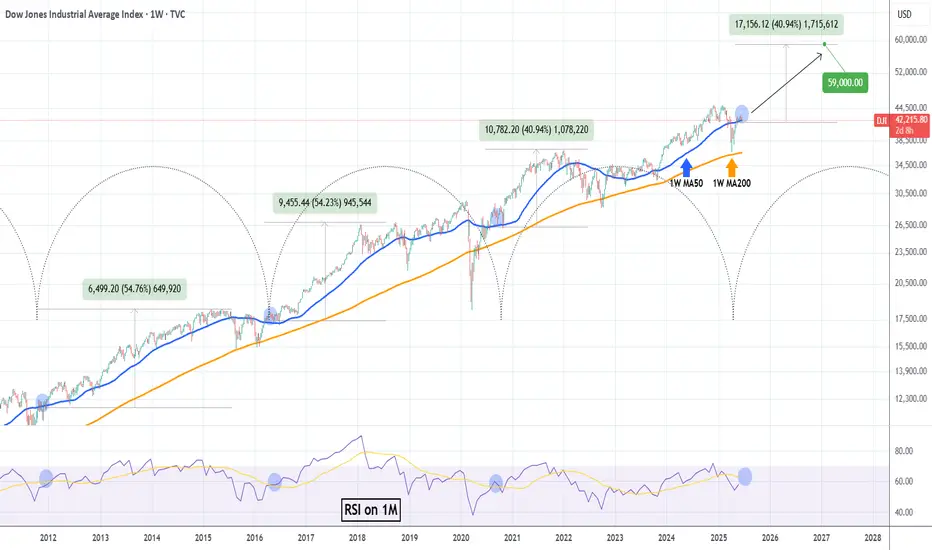
DOW JONES 15 year Cycles are coming to play.Dow Jones (DJI) is consolidating on its 1W MA50 (blue trend-line) for the past month. Based on a remarkable cyclical frequency as the Time Cycles show, every time this 1W MA50 consolidation takes place since October 2011, it turned into the long-term Support that supported rallies of at least +40.94%.
As their 1M RSI readings also sync, we can expect the current consolidation to end soon and drive the market to at least a +40.94% rise from the 1W MA50. Our long-term Target on this is 59000.
-------------------------------------------------------------------------------
** Please LIKE 👍, FOLLOW ✅, SHARE 🙌 and COMMENT ✍ if you enjoy this idea! Also share your ideas and charts in the comments section below! This is best way to keep it relevant, support us, keep the content here free and allow the idea to reach as many people as possible. **
-------------------------------------------------------------------------------
💸💸💸💸💸💸
👇 👇 👇 👇 👇 👇
Monthly Closing above 122000 will be a +ve sign.KSE100 Closed at 122143.57 on 13-06-2025
Monthly Closing above 122000 will be a +ve sign.
However, if the Index Stays above 122700, we may
witness upside again.
Breaking 118600 would bring more selling pressure.
& then Important Support would be around 112000 - 113000
and then around 110000.

MAGICUSDT Forming Falling WedgeMAGICUSDT is currently showing a highly promising technical setup with the formation of a falling wedge pattern, a historically reliable bullish reversal signal. This pattern, defined by converging trendlines sloping downward, typically signals a pause in a larger bullish trend and sets the stage for a significant upward breakout. MAGICUSDT appears to be nearing the breakout zone, and volume activity has started to increase, signaling growing accumulation and investor interest in this project.
The falling wedge is not just a visual pattern but a psychological reflection of reduced selling pressure and the potential for strong buyer interest once resistance levels are broken. With price compression occurring and the wedge tightening, MAGICUSDT could be poised for an explosive move. Historical breakouts from similar setups have often led to price increases ranging from 90% to 100%, making this a very attractive risk-reward trade for swing and position traders alike.
Beyond the technicals, market sentiment for MAGICUSDT is strengthening. The project continues to draw attention from retail traders and analysts across social media and trading platforms. This renewed focus could act as a catalyst for price momentum, especially as breakout traders and algorithmic systems begin to identify the wedge formation and position themselves accordingly.
In conclusion, MAGICUSDT offers a compelling opportunity for those watching for technically sound breakouts with strong upside potential. With volume confirming the pattern and price action pressing against the upper resistance, the setup suggests a breakout may be imminent. Keep this pair on your radar as it could be preparing for a major rally in the days ahead.
✅ Show your support by hitting the like button and
✅ Leaving a comment below! (What is You opinion about this Coin)
Your feedback and engagement keep me inspired to share more insightful market analysis with you!

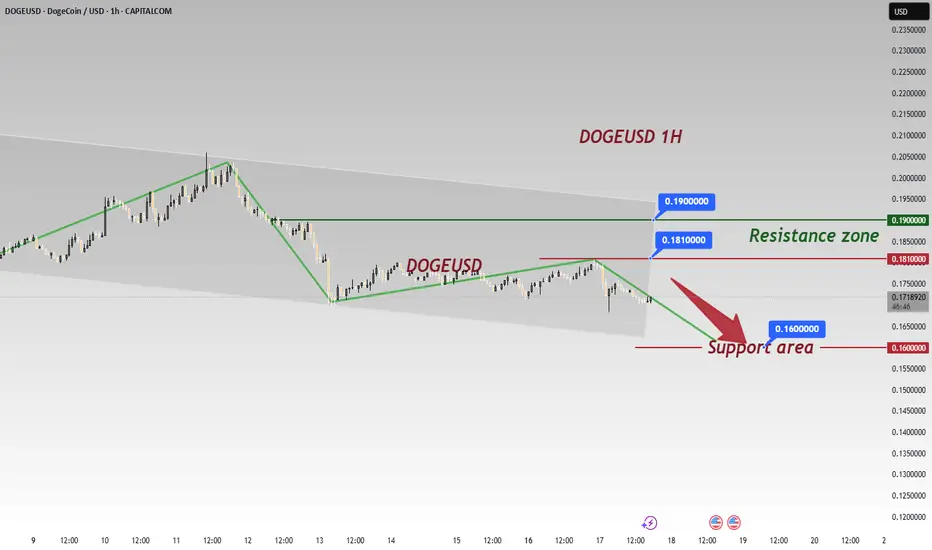
DOGEUSD 1H Technical AnalysisTrend & Key Levels 🎯
DOGEUSD is in a downtrend after breaking the short - term uptrend line.
Resistance: 0.1810 - 0.1900 zone (previous suppression, 👀 watch for pullback risks if price rebounds here).
Support: 0.1600 (critical level; a break could deepen declines 💣).
Signals 📡
Trend Break: The broken uptrend line confirms bearish control 🐻; failing to reclaim it on a rebound keeps the downtrend.
Price Action: Dominant bearish candles (with implied heavy selling 💰💨) show strong downside momentum.
Range Play: Price is testing 0.1600 support. A hold may spark a bounce 🚀; a break opens further downside (check larger timeframes for prior lows 🔍).
⚡️⚡️⚡️ BTCUSD ⚡️⚡️⚡️
🚀 Sell@ 0.17500 - 0.17000
🚀 TP 0.16500 - 0.16000
Accurate signals are updated every day 📈 If you encounter any problems during trading, these signals can serve as your reliable guide 🧭 Feel free to refer to them! I sincerely hope they'll be of great help to you 🌟 👇
ALTUSDT Forming Falling WedgeALTUSDT has recently completed a breakout from a well-formed falling wedge pattern, a strong bullish technical signal that often precedes significant upward momentum. The wedge breakout is backed by a noticeable spike in trading volume, adding credibility to the move and indicating growing market participation. This classic reversal pattern suggests that a major trend shift could be underway, and price projections indicate a potential gain in the range of 70% to 80%, aligning with historical performance of such breakouts.
What makes this setup more compelling is the structure of the wedge itself—tight, consistent, and with clear lower highs and lower lows, followed by a strong bullish candle cutting through resistance. This is a textbook example of a bullish breakout where the price decisively exits the consolidation zone and starts trending upward. With volume confirming the breakout, many traders see this as an early-stage rally signal with room to grow.
Investor sentiment around ALTUSDT is gaining strength, particularly on social platforms and trading communities. This surge in attention could fuel further buying pressure, particularly as the breakout becomes more visible to retail and technical traders. ALTUSDT has shown the ability to move sharply during bullish phases, and this breakout could signal the beginning of a new leg higher, especially if it maintains momentum over the next few daily closes.
With strong technical structure, increasing investor interest, and supportive volume, ALTUSDT is shaping up to be one of the stronger bullish breakout candidates in the current market environment. Traders looking for high-reward setups may find this an ideal entry point with a well-defined technical framework and attractive upside potential.
✅ Show your support by hitting the like button and
✅ Leaving a comment below! (What is You opinion about this Coin)
Your feedback and engagement keep me inspired to share more insightful market analysis with you!

SELL NZDCHFNZDCHF displays a bearish pennant. Sell now at 0,4935
Take Profit 0,49012
Stop Loss 0,49311

BTC/USD H1 CHART ANNALSIS 18/6/2025
Trading Setup and Strategy Explanation:
Buy at:1042.000
Resistance at:103700
Important Note:
Resistance should be above the current price, not below. If 105,700 is below 106,800, it typically indicates support, not resistance.
**Corrected Interpretation:**
Here's how your setup likely looks:
- Buy Entry:** 104.200
Support (not resistance) 103700
Target 1:108.000
Target 2: 110.000
Level Type:
- 105,700 Support (Stop-loss zone)
- 104.200 Entry
- 10.7000Target 1
Trade Notes:
- If BTC holds above 104200, your long position is technically supported.
- A break below 105,700 might invalidate the bullish setup — consider a stop-loss below that.
- Momentum toward 110K–112K is possible if the market breaks out of short-term consolidation or reacts positively to macro news.
**Strategy Preference:**
Would you like a chart or confirmation based on technical indicators (RSI, trendlines, volume, etc.)?

Strong support at 3365/3350In recent years, following the easing of high inflation pressures in the U.S., the Federal Reserve has maintained a high-interest-rate policy, a decision that has significantly impacted gold and U.S. dollar markets: high rates have boosted the U.S. dollar while suppressing gold demand 📉.
This week, gold prices defied market expectations: fueled by geopolitical conflicts, gold surged last Friday and opened higher on Monday, only to trend lower thereafter ⬇️. The hourly chart shows a series of lower lows, with 3,400 emerging as short-term resistance, while gold currently oscillates around 3,380 🔄. With key economic data pending release, gold may still rebound (the initial jobless claims data was advanced to Wednesday) ⏰.
Technically, gold remains in a unilateral uptrend on the daily chart, with strong support at 3,365/3,350 from the 5-day and 10-day moving averages—though not yet in an extremely strong trend 📈. Key resistances lie at 3,430/3,450: a break above 3,450 could pave the way for a challenge to the previous high of 3,500 🏔️!
⚡️⚡️⚡️ XAUUSD ⚡️⚡️⚡️
🚀 Buy@ 3365 - 3375
🚀 TP 3395 - 3405
Accurate signals are updated every day 📈 If you encounter any problems during trading, these signals can serve as your reliable guide 🧭 Feel free to refer to them! I sincerely hope they'll be of great help to you 🌟 👇

XAUUSD-Bearish Outlook and Price StructureA bearish outlook for gold (XAUUSD) on the 1-hour timeframe, with a bias toward the 3,100 area, targeting the highlighted demand zones.
Price-Movement Structure
We observe a three-wave corrective pattern that appears complete at the 3,494.98 high. Key observations:
- **Wave (A)** : Initial correction from the major low.
- **Wave (B)** : Complex sideways consolidation.
- **Wave (C)** : Extension to new highs, creating liquidity.
The current price action suggests potential institutional distribution at the highs. I am expecting a drop to approximately 3,349.94.
However, fundamentals such as interest rates, dollar strength, and geopolitical risks remain key drivers of bullish optimism.
