The window for buying Bitcoin has opened.Macro perspective: Expectation of interest rate cut returns + Negative news is digested, liquidity marginally improves
In December, the expectation of the Fed's interest rate cut showed a "V-shaped reversal" - although it dropped below 50% at the beginning of the month due to the hawkish remarks of officials, the CME FedWatch data on November 28th indicated that the probability of a 25 basis point interest rate cut in December had risen to 86.9%. The core demand for loose liquidity from the market remained unchanged. More importantly, during the process where Bitcoin dropped from $84,000 to $83,000 on December 1st - 2nd, the three major negative factors that had previously suppressed the market (Fed's hawkish expectations, intensified regulatory measures in China, and the withdrawal of $20 billion in liquidity from TGA accounts) had been concentratedly released, forming the basis for a "technical recovery after the exhaustion of negative news". Cross-asset linkage also provided support. The correlation between Bitcoin and the Nasdaq 100 Index rose to 46%, and the stabilization of US tech stocks led to the restoration of risk appetite, with funds beginning to flow back from safe-haven assets to high-flexibility assets.
Bitcoin trading strategy
buy:91500-92500
tp:93500-95000
sl:90500
Harmonic Patterns

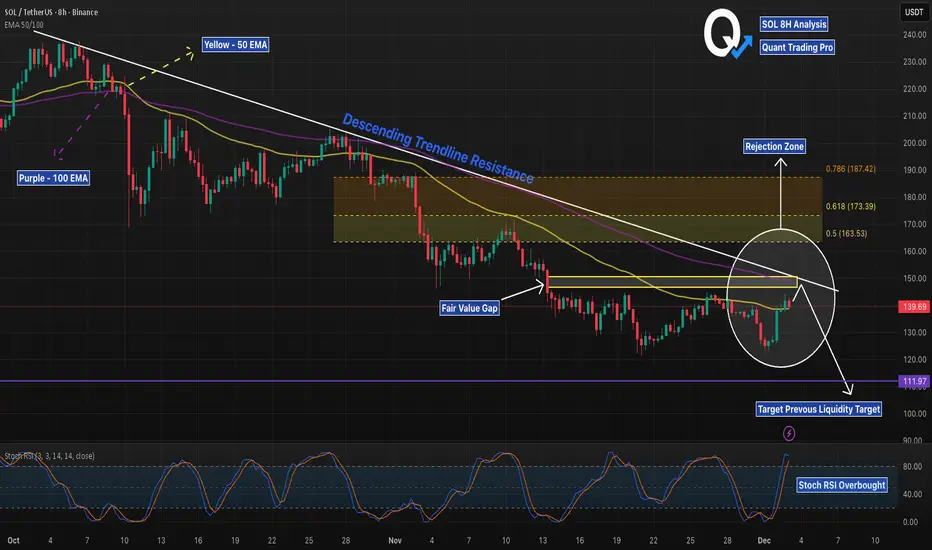
SOL 8H – FVG + EMA Rejection, Liquidity Next?SOL has tapped a clean multi-confluence rejection zone: the descending trendline, the 50/100 EMA cluster, and a filled Fair Value Gap all stack at the same price level. This area has acted as a strong pivot throughout November, and today’s reaction is consistent with prior trendline rejections.
The Stoch RSI is already in overbought territory on the 8H, adding momentum exhaustion to the setup. Bears will watch for continuation toward the major liquidity level around $111.97, which remains untested below.
For bulls to regain control, price must break and hold above the EMA cluster and FVG, flipping the trendline into support. Until then, the path of least resistance remains down toward liquidity.
XRP 4H – Trendline Test, But Is Liquidity Next?XRP is testing a clean descending trendline that has been rejecting price since early November. Today’s move taps that same trendline while also running directly into the 50 EMA and 100 EMA — creating a tight confluence zone that historically produces strong reactions. Price is also sitting inside the 0.5–0.618 Fibonacci band, with the 0.786 level acting as the upper cap of the current retracement.
Below, the $1.8476 level remains a clear liquidity target from the November sweep, and the Stoch RSI is already stretched into overbought territory. Bulls need a decisive breakout and retest above the trendline to invalidate the downside liquidity draw. Bears are watching for another clean rejection into a move toward the purple liquidity line.
Expect volatility as XRP decides between breakout continuation or a liquidity-seeking reversal.


buy iex for investment IEX looks good for pure investment.
CMP 148.00 Rs
No stoploss in investment.
its Monopoly and debt free company.


GOLD: Breakout Structure Points to New High TargetsGOLD: Breakout Structure Points to New High Targets
Gold continues to push higher after breaking out of the consolidation triangle. Price retested the breakout zone and is now trading above 4230, holding firmly above the key structure.
The chances are higher that gold may continue to rise further. The bullish movement began on Thursday without any notable news, and I do not expect anything significant to further drive it up.
For now gold remains only bullish. A possible correction may happen before it moves more.
Key Levels:
• 4150
• 4230
• 4290
• 4360
As long as price holds above 42.., buyers remain in control. A pullback into the support zone could provide continuation toward 4290, and a stronger breakout opens the path to 4360.
You may find more details in the chart!
Thank you and Good Luck!
❤️PS: Please support with a like or comment if you find this analysis useful for your trading day❤️
Previous analysis:
Previous analysis:

BUY SIGNAL – XAUUSD (GOLD)BUY SIGNAL – XAUUSD (GOLD)
Signal: BUY
Entry Zone: 4210–4215
Bias: Bullish continuation from demand zone
Reasoning:
Price has tapped the highlighted buy zone, showing rejection with bullish candles and increasing volume. Structure suggests a potential continuation to the upside toward the previous high.
Description:
Gold is reacting strongly from a fresh demand zone. A bullish reversal pattern has formed, indicating buyers are stepping in. Buying within the 4210–4215 zone offers a favorable risk-to-reward opportunity toward higher resistance levels.

STRATEGY Mirror crash with 2022 to $60 has started.Michael Saylor won't like this. But the chart is what it is and that's an objective dynamic.
** The 5-year Channel Up and Bear Cycle **
Strategy (MSTR) has been trading within almost a 5-year Channel Up since the February 2021 Top of its previous Cycle. Within this lines, it has had its latest top (Higher High) on the week of November 18 2024 and since then it has been on a structured strong decline.
This decline has gotten even stronger once the price broke below its 1W MA50 (blue trend-line). So far, the 2025 correction is mirroring the 2021 one, which was the start of a 2-year (2021/21) Bear Cycle.
** The three Stages **
Based on that, we have valid reasons to expect that 2026 will also mirror the past Bear Cycle. What stands out on this analysis is that we have classified the whole Bear Cycle into three Stages. Based on that, we have now already entered Stage 2 as the price has broken below its 1W MA50 (and should stay as the Resistance for the remainder of the Cycle) and almost touched its 1W MA200 (orange trend-line). When that happened in January 2022, the market rebounded towards the 1W MA50 where it was rejected and when it broke below the 1W MA200 as well, Stage 3 started. This Stage made the Bear Cycle bottom on the 1M MA250 (red trend-line) after a -90% decline in total. It was completed when the price broke above the 1W MA50 again, essentially confirming the start of the new Bull Cycle.
** Where is the bottom now? **
As a result, we may now see a short-term rebound, limited by the 1W MA50, which after it gets rejected and breaks below the 1W MA200, Stage 3 may start. If this Bear Cycle also crashes by -90%, we should then be expecting a bottom at $60 (at least), supported by the 1M MA250 again.
Notice also the striking symmetry among the 1W RSI patterns of the two Cycle fractals. The 1W RSI has currently hit the 30.00 oversold barrier (similar to Jan 2022) and it was a second break and then a Higher Lows Bullish Divergence that confirmed the bottom of the Bear Cycle, essentially turning Strategy Inc. into a long-term buy opportunity again.
---
** Please LIKE 👍, FOLLOW ✅, SHARE 🙌 and COMMENT ✍ if you enjoy this idea! Also share your ideas and charts in the comments section below! This is best way to keep it relevant, support us, keep the content here free and allow the idea to reach as many people as possible. **
---
💸💸💸💸💸💸
👇 👇 👇 👇 👇 👇

NZDUSD - buy nowNZDUSD was in a recent downtrend for the last few weeks and struggled to stay bullish, but recently it has just broken a strong resistance trend line which it tested several times and failed to break through. NZDUSD is very likely to hit the next major resistance zone which is market as the "TAKE PROFIT" LEVEL. There are many clear signs of new bullish movements. BUY NZDUSD now..

AUDUSD - great buy trade opportunity AUDUSD was in a recent downtrend for the last few weeks and struggled to stay bullish, but recently it has just broken a strong resistance trend line which it tested several times and failed to break through. AUDUSD is very likely to hit the next major resistance zone which is market as the "TAKE PROFIT" LEVEL. There are many clear signs of new bullish movements. BUY AUDUSD now

GBPUSD - time to buy nowGBPUSD was in a recent downtrend for the last few weeks and struggled to stay bullish, but recently it has just broken a strong resistance trend line which it tested several times and failed to break through. GBPUSD is very likely to hit the next major resistance zone which is market as the "TAKE PROFIT" LEVEL. There are many clear signs of new bullish movements. BUY GBPUSD

EURUSD is ready to sky rocket - buy nowEURUSD was in a recent downtrend for the last few weeks and struggled to stay bullish, but recently it has just broken a strong resistance trend line which it tested several times and failed to break through. EURUSD is very likely to hit the next major resistance zone which is market as the "TAKE PROFIT" LEVEL. There are many clear signs of new bullish movements. BUY EURUSD

Gold Trade Plan 03/12/2025Dear traders,
The market is ranging around the 4200 zone without any news of a Russia–Ukraine agreement or reduced tensions between the U.S. and Venezuela. The buy zone is very risky, but as long as no agreement is announced, the price is likely to move upward given the weakness of the dollar. With the first news of a peace agreement, I expect a sharp move on gold.
Regards,
Alireza!

XRP USDT - HARMONIC GARTLEYI am observing Harmonic Gartley for XRP USDT on a weekly chart.
If it crosses death valley, it seems possible to reach 2 USDT by mid-October.
Of course, this is not investment advice , it is my personal analysis.
Good luck.

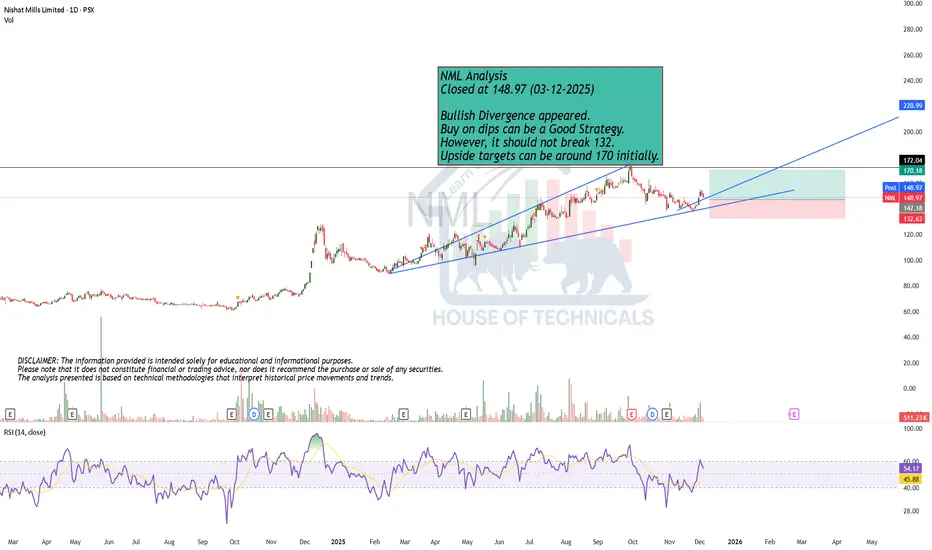
Bullish Divergence appeared. NML Analysis
Closed at 148.97 (03-12-2025)
Bullish Divergence appeared.
Buy on dips can be a Good Strategy.
However, it should not break 132.
Upside targets can be around 170 initially.
56 - 57 is the resistance for now.BBFL
Closed at 53.81 (03-12-2025)
56 - 57 is the resistance for now.
Crossing & Sustaining this level may lead it towards 65 - 68.
However, breaking 47 this time may bring more selling pressure.

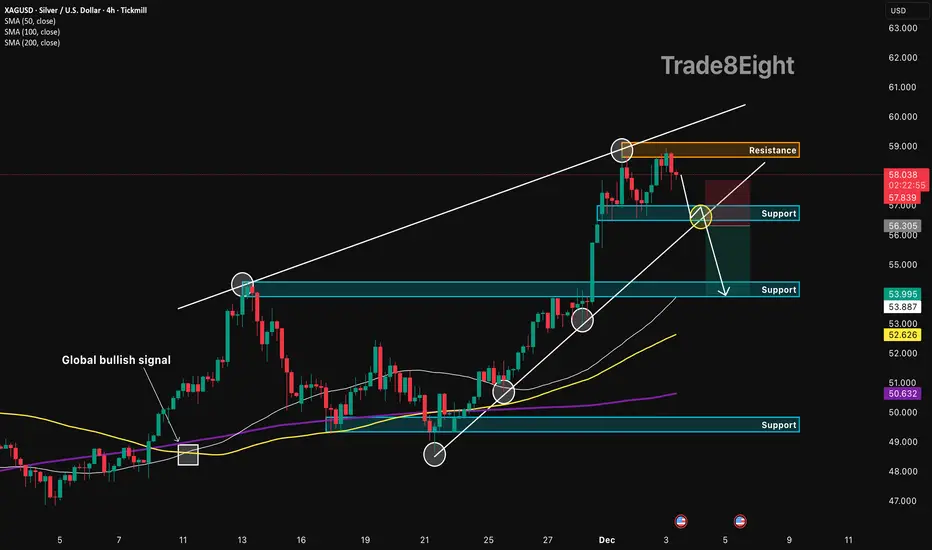
XAGUSD: reversal from resistance🛠 Technical Analysis: On the 4-hour timeframe, silver (XAGUSD) rebounded from the important resistance level of 59.00, signaling a potential bearish reversal. Currently, the price is likely to test the nearest support at 56.30, a confirmed break of which would provide a potential sell entry. The trading setup suggests a correction toward the demand zone at 54.00, which coincides with the support area marked on the chart.
❗️ Trade Parameters (SELL) ❗️
➡️ Entry Point: Sell on breakdown of support (approx. 56.30)
🎯 Take Profit: 53.90 – 54.00 (Support Zone)
🔴 Stop Loss: Above local resistance structure (approx. 57.85)
⚠️ Disclaimer: This is a potential trade idea based on current analysis; market conditions and price direction are subject to change based on news factors and volatility.
XLMUSD can drop another -50% before it bottoms.Stellar (XLMUSD) is in the middle of its Bear Cycle and currently consolidating within its 1W MA50 (blue trend-line) - 1W MA200 (orange trend-line) in anticipating of Phase 2 of the Cycle's structure.
As you can see, the dominant pattern since the January 2018 High has been a Triangle, with the recent Cycle Top making direct contact with the Lower Highs trend-line and the bottom with the Higher Lows trend-line.
There is a very high degree of symmetry among those Cycles. Fine example is the 1W RSI, which every time it hit 38.50, the price had always tested the 1W MA200 while on its Bear Cycle and always after breaking below the initial (dashed) Triangle, which is the first pattern post the Bull Cycle Top.
As far as the bottom is concerned, there is obviously the Higher Lows trend-line to consider but at the same time, the 0.786 Fibonacci retracement level can also assist as the previous two Cycle bottoms were priced just above it.
As a result we estimate that this Bear Cycle may bottom around 0.13000 before XLM turns into a long-term buy opportunity again.
---
** Please LIKE 👍, FOLLOW ✅, SHARE 🙌 and COMMENT ✍ if you enjoy this idea! Also share your ideas and charts in the comments section below! This is best way to keep it relevant, support us, keep the content here free and allow the idea to reach as many people as possible. **
---
💸💸💸💸💸💸
👇 👇 👇 👇 👇 👇

XAUUSD M30 TIME FRAME CHART ANALYSIS 📌 Pair & Timeframe
XAUUSD (Gold)
30-minute chart (30m)
Current price around 4198.95
📉 Your Position Setup
From the chart shading:
Red zone = Stop-Loss area (above 4198–4223)
Green zone = Take-Profit area (down toward ~4116)


USDCHF H4 | Bearish Drop In PlayMomentum: Bullish
The price has reacted off the sell entry and is trading below the descending trendline and the Ichimoku cloud.
Sell entry: 0.8026
Pullback resistance.
Stop loss: 0.8063
Pullback resistance.
Take profit: 0.7970
Pullback support
Slightly above the 61.8% Fibonacci retracement.
High Risk Investment Warning
Stratos Markets Limited (tradu.com ), Stratos Europe Ltd (tradu.com ):
CFDs are complex instruments and come with a high risk of losing money rapidly due to leverage. 70% of retail investor accounts lose money when trading CFDs with this provider. You should consider whether you understand how CFDs work and whether you can afford to take the high risk of losing your money.
Stratos Global LLC (tradu.com ): Losses can exceed deposits.
Please be advised that the information presented on TradingView is provided to Tradu (‘Company’, ‘we’) by a third-party provider (‘TFA Global Pte Ltd’). Please be reminded that you are solely responsible for the trading decisions on your account. Any information and/or content is intended entirely for research, educational and informational purposes only and does not constitute investment or consultation advice or investment strategy. The information is not tailored to the investment needs of any specific person and therefore does not involve a consideration of any of the investment objectives, financial situation or needs of any viewer that may receive it. Past performance is not a reliable indicator of future results. Actual results may differ materially from those anticipated in forward-looking or past performance statements. We assume no liability as to the accuracy or completeness of any of the information and/or content provided herein and the Company cannot be held responsible for any omission, mistake nor for any loss or damage including without limitation to any loss of profit which may arise from reliance on any information supplied by TFA Global Pte Ltd.
Update idea
Add note
Tradu
Disclaimer
The information and publications are not meant to be, and do not constitute, financial, investment, trading, or other types of advice or recommendations supplied or endorsed by
