baby baby KAVAlook how lovely this triangle is! I longed the dip near the trendline! lets see whats gonna happen! big gainssssss
Harmonic Patterns

Tricky USDCAD . let the market decide - we follow Hello traders , here is the full multi time frame analysis for this pair, let me know in the comment section below if you have any questions , the entry will be taken only if all rules of the strategies will be satisfied. wait for more price action to develop before taking any position. I suggest you keep this pair on your watchlist and see if the rules of your strategy are satisfied.
🧠💡 Share your unique analysis, thoughts, and ideas in the comments section below. I'm excited to hear your perspective on this pair .
💭🔍 Don't hesitate to comment if you have any questions or queries regarding this analysis.

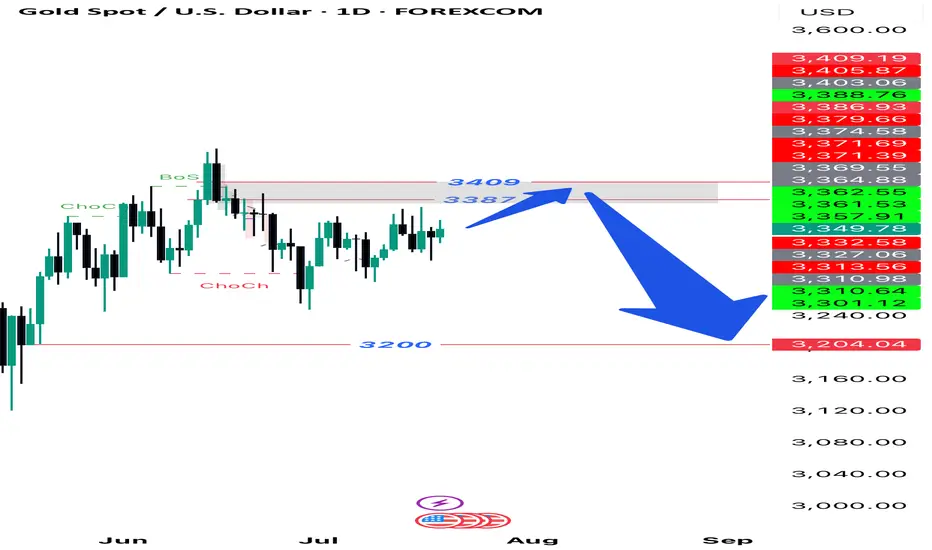
XAUUSD MULTI TIME FRAME ANALYSISHello traders , here is the full multi time frame analysis for this pair, let me know in the comment section below if you have any questions , the entry will be taken only if all rules of the strategies will be satisfied. wait for more price action to develop before taking any position. I suggest you keep this pair on your watchlist and see if the rules of your strategy are satisfied.
🧠💡 Share your unique analysis, thoughts, and ideas in the comments section below. I'm excited to hear your perspective on this pair .
💭🔍 Don't hesitate to comment if you have any questions or queries regarding this analysis.

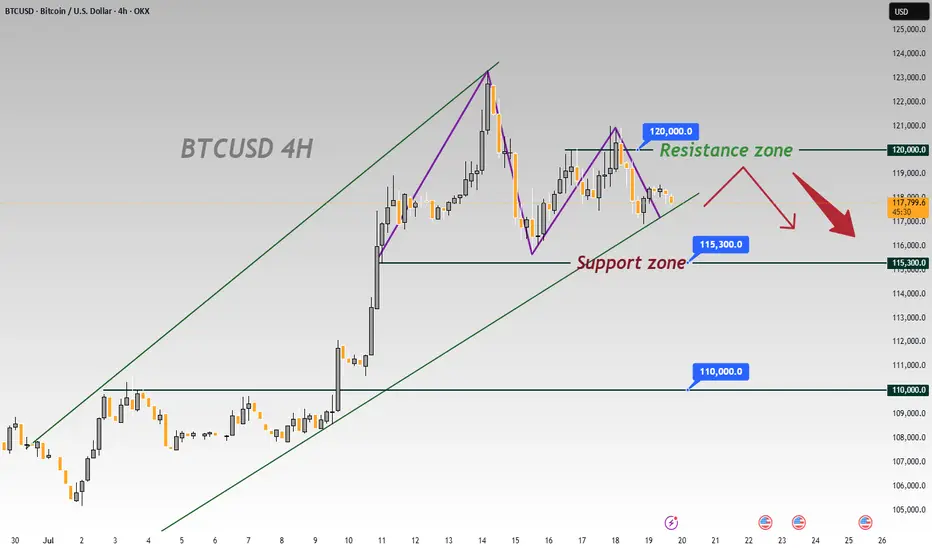
BTCUSD 4-Hour Chart Analysis: Range-Bound Trends & Key LevelsFrom the 4-hour chart of BTCUSD, the recent price movement shows obvious range-bound characteristics 📊. The upper zone around 120000 forms a key resistance level 🛑, where the bullish momentum has waned after encountering resistance 💨.
The lower level of 115300 is a significant support zone 🛡️. Previously, there was some buying support when the price retraced to this zone 👀. However, as the current price is pulling back from the resistance zone ↘️, if the bearish force takes the lead subsequently 🐻, the possibility of breaking below the 115300 support will increase ⬆️. Once it breaks below effectively 💥, the next key support level of 110000 will most likely become the target for the price to decline towards 🎯.
In terms of the short-term trend 📈, due to the obvious suppression from the resistance zone 🚧, the price will most likely continue the rhythm of testing the support downwards 🔽. In operation, one can pay attention to the breakdown situation of the support zone and layout trades accordingly 📝. Meanwhile, be alert to the possibility of a rebound after the price finds support in the support zone 🚀, and further confirmation of the direction needs to be combined with real-time K-line patterns 📊, trading volume 📈
🚀 Sell @119500 - 118500
🚀 TP 116500 - 115500
Accurate signals are updated every day 📈 If you encounter any problems during trading, these signals can serve as your reliable guide 🧭 Feel free to refer to them! I sincerely hope they'll be of great help to you 🌟 👇
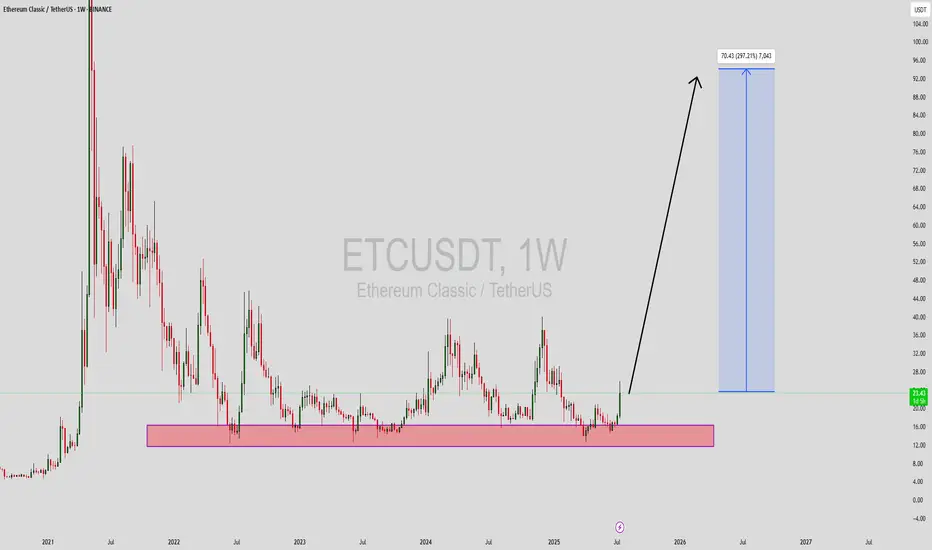
ETCUSDT Forming Strong Bullish PotentialEthereum Classic (ETCUSDT) is currently showing strong bullish potential as it emerges from a long-term accumulation zone. The weekly chart highlights a clearly defined support range where ETC has consistently rebounded in past cycles, and recent price action suggests another powerful move to the upside is brewing. With increased volume and momentum forming around the $15–$17 range, the price has broken out with significant strength, targeting an impressive 240% to 250% rally in the mid to long term.
Technically, ETC has printed a long-term rounded bottom pattern, signaling a possible trend reversal. Such formations often lead to explosive upside moves once the neckline resistance is broken, and ETC appears to be in that breakout phase now. A projected target near $80–$95 aligns well with historical resistance zones from previous bull runs. This is an ideal setup for position traders looking for a high-risk, high-reward opportunity.
Investor sentiment around Ethereum Classic is turning bullish again, driven by renewed interest in proof-of-work (PoW) assets and a potential alternative to Ethereum following its full transition to proof-of-stake. With Ethereum Classic maintaining its original blockchain structure, it continues to attract a niche set of supporters and miners. Growing community support and speculative demand could be key drivers behind this expected price surge.
✅ Show your support by hitting the like button and
✅ Leaving a comment below! (What is You opinion about this Coin)
Your feedback and engagement keep me inspired to share more insightful market analysis with you!
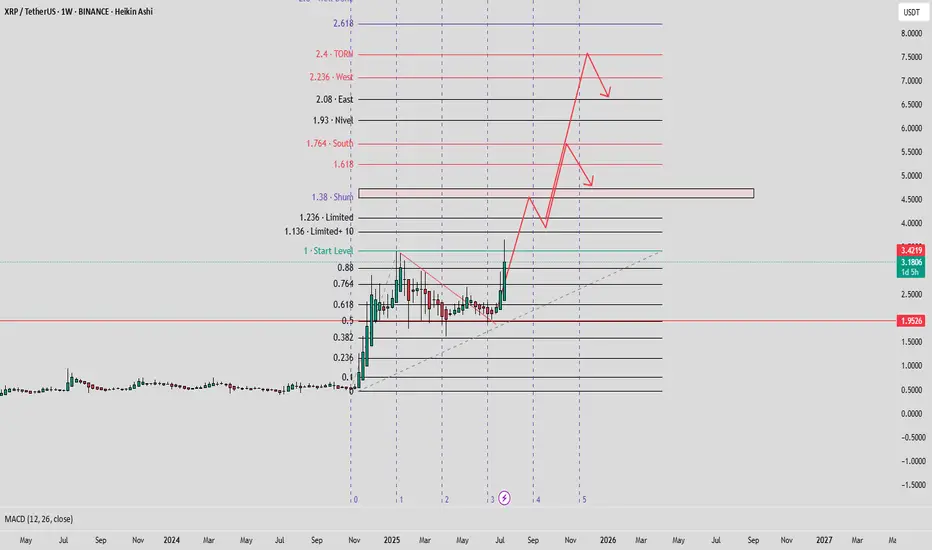
#XRP ALMAZOV PROJECTION#XRPUSD ALMAZOV PROJECTION WEEKLY
Price projection according to Almazov's theory, Bitcoin should at least touch $1.3, before pulling back or continuing to go long if its dimensionality decreases.

Gold Strategy: Long in 3320-3330 & TargetsDuring Friday’s (July 18th) US trading session, spot gold traded in a narrow range with a downward bias 😔, currently hovering around 3350.05. Thursday saw spot gold stage a heart-stopping "deep V" move 😲! Driven by the dual catalysts of the US June retail sales surging 0.6% (beating expectations) and initial jobless claims dropping to 221,000, the US Dollar Index once spiked to a monthly high of 98.95, instantly slamming spot gold to an intraday low of 3309.82. Surprisingly, however, gold prices then staged a strong rebound, closing at 3338.86 with a mere 0.25% decline.
This "fake dip" pattern reveals a deep-seated contradiction in the current market – while economic data temporarily supports dollar strength, investors’ inflation concerns triggered by tariffs are forming an "invisible buying force" for gold 💪. The concurrent rise in the dollar and US Treasury yields has indeed weighed on gold prices, yet robust buying interest emerges at every dip window. Behind this phenomenon lies shrewd capital quietly positioning itself. When the 10-year US Treasury yield climbed to a monthly high of 4.495%, gold refused to fall further – this divergence signals significant market 分歧 over the Federal Reserve’s policy trajectory 😕.
Gold Trend Analysis:
Gold remains in a bullish trend 👍. From the daily chart perspective, gold continued its strong upward momentum today, closing with a positive candle. Technically, the MACD bullish energy bars have started to expand, and the KDJ is in a golden cross heading upward, indicating that the overall price is in a strong phase. As long as gold doesn’t break below 3320, the market is expected to continue its upward trajectory, potentially targeting 3375-3400. If it fails to break through, gold may see a minor short-term pullback. If the pullback doesn’t break 3330, gold is likely to gather momentum again to attack 3375; a break below would shift focus to the 3310 support level. As long as 3310 holds, gold remains in a bullish rebound structure. Next week’s broad range is expected to be 3375-3310.
On the 4-hour chart, the KDJ indicator, after being oversold, has started to turn upward and is now in a golden cross. Notably, this upward move has been accompanied by clear medium bullish candles, making KDJ a more reliable indicator here – the potential for continued bullish candles remains high 😃. The MACD fast line is turning upward at a high level, on the verge of another golden cross, with green energy bars continuing to contract and poised to turn red by inertia. Overall, gold’s current trend is either consolidating or rising. Given the clear bullish bias, we can consider firmly going long first, and only observe the possibility of shorting when KDJ approaches the upper 100 level and the MACD fast/slow lines are about to cross.
Focus on buying on pullbacks. The short-term support levels lie at 3330-3320 – as long as these levels hold, they present buying opportunities. If gold rises during the US session, watch whether 3365 and 3375 are broken; a failure to break through could bring pullback space, offering opportunities for short-term short positions.
Gold Trading Strategy 😎: Go long decisively once on the first pullback to the 3320-3330 range 😏, with targets looking at the 3350-3360 range – just wait for profits to roll in 💰!
🚀 Buy @3320 - 3330
🚀 TP 3340 - 3350
Accurate signals are updated every day 📈 If you encounter any problems during trading, these signals can serve as your reliable guide 🧭 Feel free to refer to them! I sincerely hope they'll be of great help to you 🌟 👇

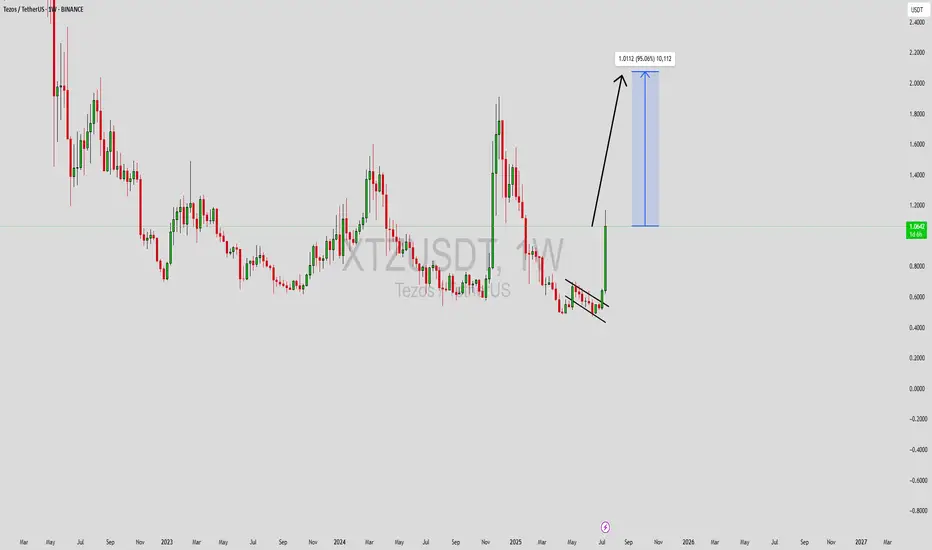
XTZUSDT Forming Falling WedgeXTZUSDT has recently formed a classic falling wedge pattern on the daily timeframe, a setup often associated with bullish reversals. This technical formation, marked by converging downward sloping trendlines, is showing early signs of a breakout. With volume steadily building, a breakout confirmation above resistance could signal the beginning of a major bullish rally. Historically, falling wedge breakouts result in strong upside moves, and in this case, we are looking at a potential gain of 80% to 90% in the coming weeks.
Tezos (XTZ) has consistently positioned itself as a strong contender in the smart contract and decentralized applications (dApp) sector. With its self-amending blockchain and focus on governance, it continues to attract attention from developers and institutional players alike. As the broader crypto market shows signs of recovery, coins like XTZ that offer real-world utility and technical strength tend to lead the charge.
From a market sentiment perspective, interest in XTZ has been rising across social platforms and trading communities. The combination of technical alignment and positive fundamentals suggests that bulls are preparing for a strong move. Traders should keep an eye on breakout levels and monitor volume spikes as confirmation of momentum. A successful wedge breakout could bring XTZUSDT back to previous highs or even beyond.
✅ Show your support by hitting the like button and
✅ Leaving a comment below! (What is You opinion about this Coin)
Your feedback and engagement keep me inspired to share more insightful market analysis with you!
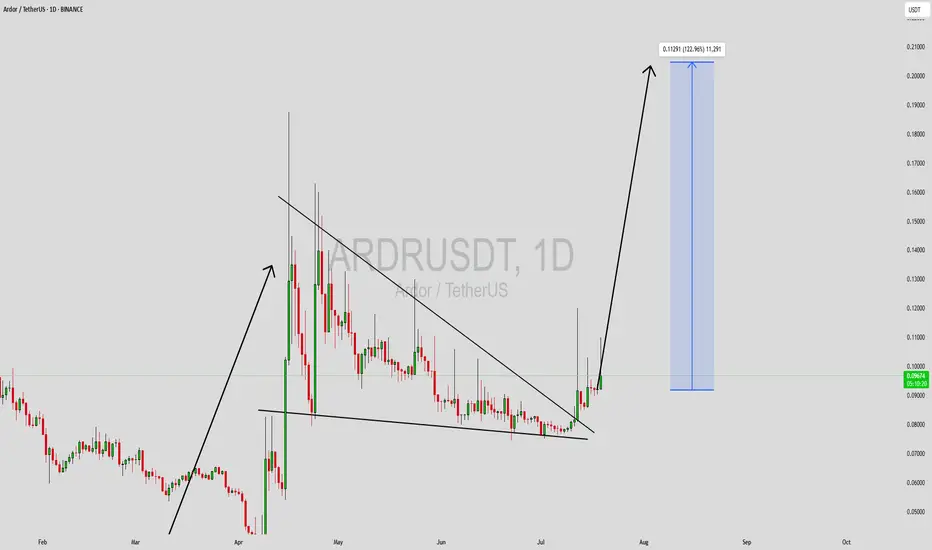
ARDRUSDT Forming Bullish WaveARDRUSDT is currently demonstrating a strong bullish wave pattern, indicating a powerful shift in market momentum. After a period of accumulation, the price has begun to trend upward with higher highs and higher lows forming on the chart. This bullish structure, supported by healthy trading volume, points to increasing confidence among traders and investors. If the pattern continues to hold, we can expect a significant breakout, with potential gains estimated between 90% to 100% in the near term.
The Ardor platform is gaining renewed attention in the blockchain space due to its unique multi-chain architecture and real-world applications, especially in enterprise solutions. As interest in scalable and interoperable blockchain ecosystems grows, ARDR is beginning to surface on more investors’ radars. The technical breakout is aligning well with this growing fundamental support, providing added conviction for bullish traders.
From a trading perspective, the current breakout offers a solid entry opportunity, especially if the price consolidates above recent resistance levels. Traders should watch for volume surges and continuation candles as confirmation of the bullish trend. With strong technical indicators aligning with positive sentiment, ARDRUSDT could become one of the leading performers in the upcoming altcoin rally.
✅ Show your support by hitting the like button and
✅ Leaving a comment below! (What is You opinion about this Coin)
Your feedback and engagement keep me inspired to share more insightful market analysis with you!
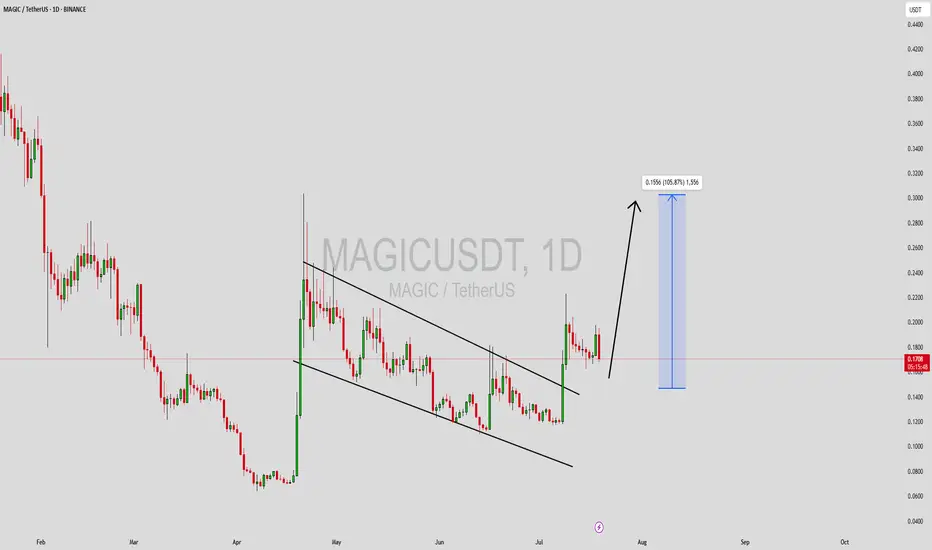
MAGICUSDT Forming Falling WedgeMAGICUSDT is currently showing a promising technical structure as it breaks out of a classic falling wedge pattern on the daily chart. This pattern is widely recognized for its bullish implications, especially when accompanied by increased volume, as seen in recent trading sessions. The falling wedge breakout suggests a potential reversal from the previous downtrend, with a projected gain of 90% to 100%+ in the coming weeks if momentum continues to build.
The Magic ecosystem, built around gaming and decentralized metaverse infrastructure, continues to attract investor interest due to its unique positioning in the Web3 and NFT sectors. With new partnerships and platform developments emerging, the fundamentals are aligning with the technicals for a potential significant rally. The current price action reflects a growing accumulation phase, indicating strong hands entering at lower levels.
As altcoin recovery gains traction across the broader market, MAGIC is positioned to benefit from both renewed retail attention and institutional curiosity. A breakout above the wedge resistance line can serve as a confirmation trigger for long entries, with a clear risk-to-reward setup. Traders should keep an eye on volume confirmation and short-term resistance levels for scaling out opportunities as the price climbs.
✅ Show your support by hitting the like button and
✅ Leaving a comment below! (What is You opinion about this Coin)
Your feedback and engagement keep me inspired to share more insightful market analysis with you!
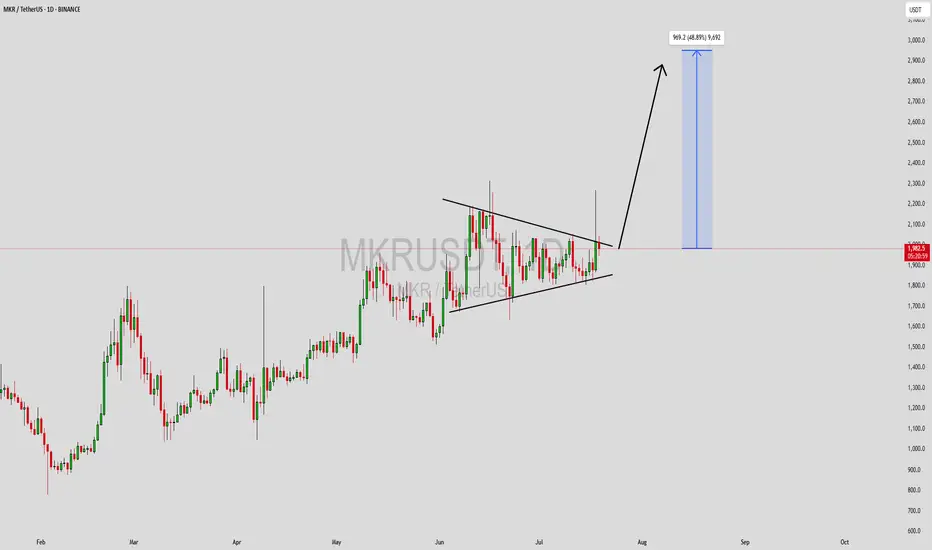
MKRUSDT Forming Symmetrical TriangleMKRUSDT has formed a textbook symmetrical triangle pattern on the daily chart, a classic consolidation structure that often precedes a strong breakout. The price is currently pressing against the upper resistance line, and a breakout above this range could trigger a bullish continuation toward the $2,900 level, suggesting a potential gain of 30% to 40%+. The rising volume on the recent candles confirms that traders are positioning themselves ahead of a possible move, making this setup highly watchable for swing traders.
Maker (MKR), being a major governance token in the DeFi ecosystem, continues to attract interest due to its role in the MakerDAO protocol and its connection to the DAI stablecoin. As DeFi fundamentals remain strong and institutional capital slowly returns to decentralized finance platforms, MKR is likely to benefit from renewed attention. This breakout could be a reflection of that growing confidence.
The bullish sentiment is further supported by strong fundamentals and technical indicators aligning in favor of upside momentum. With crypto market sentiment gradually improving and altcoins showing signs of strength, MKR could outperform many peers in the coming weeks. Watch for confirmation above the triangle resistance and monitor volume spikes to validate a strong entry.
✅ Show your support by hitting the like button and
✅ Leaving a comment below! (What is You opinion about this Coin)
Your feedback and engagement keep me inspired to share more insightful market analysis with you!
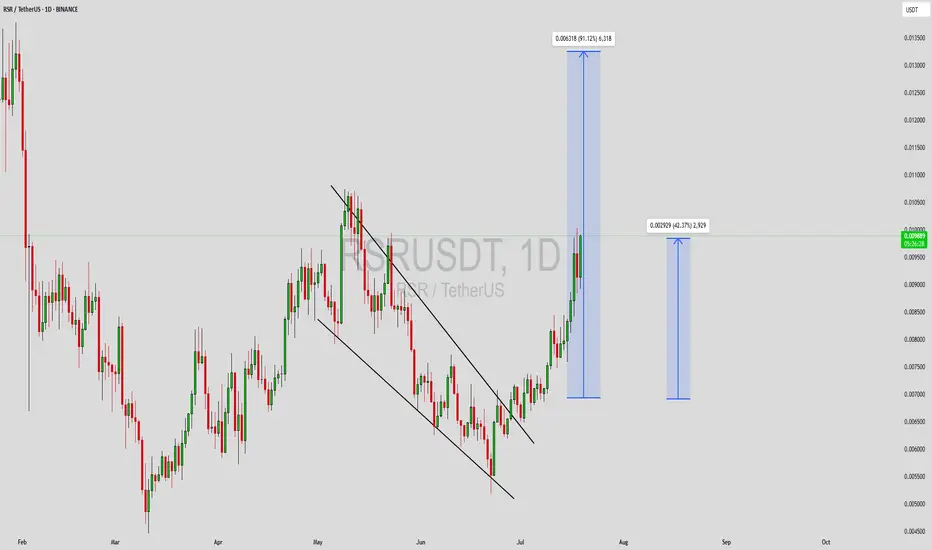
RSRUSDT Forming Bullish WaveRSRUSDT is exhibiting a clear bullish wave pattern on the daily chart, breaking out of its previous downtrend channel with strong momentum. This kind of technical setup often precedes a continuation rally, especially when paired with rising volume. The current breakout is supported by a steady increase in trading activity, indicating strong market interest and confidence from buyers. Based on this chart, there is potential for an 80% to 90% gain if the bullish structure continues to unfold as expected.
Reserve Rights (RSR) is a token with a unique use case, focused on stabilizing digital economies and supporting low-volatility assets. As crypto adoption grows in emerging markets, utility tokens like RSR are becoming increasingly relevant. This could be one of the reasons why investor sentiment is turning positive again, especially after a period of price consolidation and accumulation. If RSR can maintain its momentum, it may retest its previous highs or even reach new local peaks.
Traders and investors should watch key resistance levels closely while considering support re-tests for potential entries. The risk-to-reward ratio in setups like this tends to be favorable if volume remains elevated and broader market sentiment supports the move. Technical indicators such as RSI and MACD may also confirm the bullish bias in the coming sessions, further strengthening this setup’s credibility.
✅ Show your support by hitting the like button and
✅ Leaving a comment below! (What is You opinion about this Coin)
Your feedback and engagement keep me inspired to share more insightful market analysis with you!
FUNUSDT Forming Bullish WaveFUNUSDT is currently showcasing a bullish wave pattern, signaling the potential continuation of its upward momentum. This type of pattern often indicates growing market interest and renewed buyer activity. As seen in the recent chart movements, the price has begun forming higher lows and higher highs, a key structural sign of bullish strength. The presence of good volume further validates the ongoing buying pressure, making this setup appealing to short-term traders and swing investors.
FUNToken, designed for the online gaming and gambling ecosystem, is gaining traction due to the increasing adoption of decentralized applications in these sectors. As regulatory clarity improves and user interest rises, utility-based tokens like FUN often see renewed demand. The project’s low market cap and strong community engagement create a favorable environment for speculative rallies, particularly during altcoin market uptrends.
With expectations of a 20% to 30% gain, FUNUSDT offers a moderate yet promising short-term opportunity. The bullish wave pattern suggests room for continued price expansion, especially if key resistance levels are broken with momentum. Traders should keep an eye on breakout confirmations and ensure risk is managed effectively, as low-cap tokens often experience higher volatility.
✅ Show your support by hitting the like button and
✅ Leaving a comment below! (What is You opinion about this Coin)
Your feedback and engagement keep me inspired to share more insightful market analysis with you!

buy bch midterm"🌟 Welcome to Golden Candle! 🌟
We're a team of 📈 passionate traders 📉 who love sharing our 🔍 technical analysis insights 🔎 with the TradingView community. 🌎
Our goal is to provide 💡 valuable perspectives 💡 on market trends and patterns, but 🚫 please note that our analyses are not intended as buy or sell recommendations. 🚫
Instead, they reflect our own 💭 personal attitudes and thoughts. 💭
Follow along and 📚 learn 📚 from our analyses! 📊💡"

LINKUSDT Forming Falling Wedge LINKUSDT is currently forming a classic falling wedge pattern, a bullish reversal setup that often signals the end of a downtrend and the beginning of a strong upward move. The recent price action within the wedge shows decreasing volatility and tightening price levels, suggesting accumulation is underway. This setup, combined with increasing volume, indicates that a breakout to the upside could be imminent.
Chainlink (LINK) continues to draw investor interest due to its critical role in the decentralized oracle network ecosystem, which bridges blockchain smart contracts with real-world data. The project has maintained relevance in both DeFi and traditional enterprise solutions, and its consistent development activity keeps it on the radar of long-term crypto investors and short-term traders alike. With current market sentiment shifting more favorably toward altcoins, LINK’s technical and fundamental setup makes it a top watch.
The expectation for a 60% to 70% gain is well-supported by previous price performance following similar wedge breakouts. Traders are advised to monitor for a strong volume breakout above resistance lines, as this would confirm the move and likely initiate a new upward trend. If broader market conditions remain positive, LINKUSDT could move swiftly toward higher levels, fueled by both technical momentum and renewed investor confidence.
✅ Show your support by hitting the like button and
✅ Leaving a comment below! (What is You opinion about this Coin)
Your feedback and engagement keep me inspired to share more insightful market analysis with you!


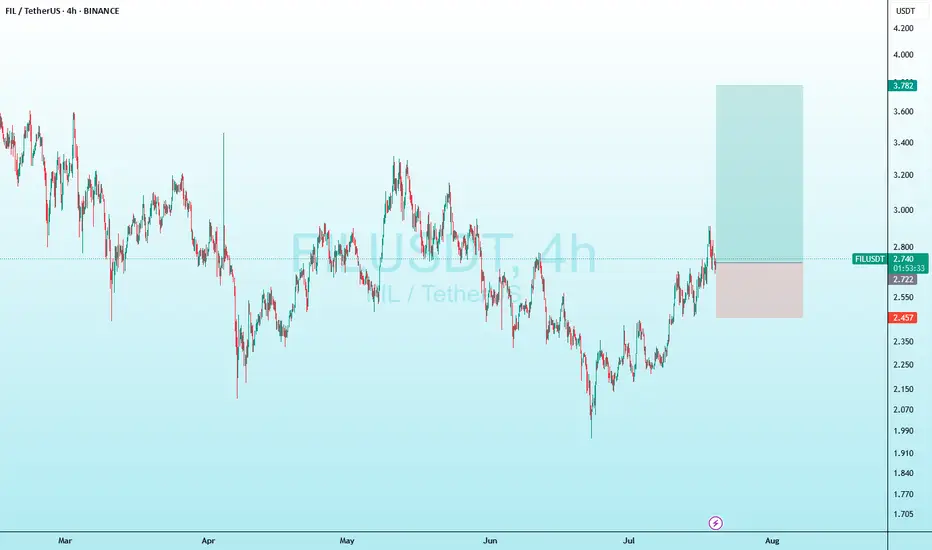
filusdt is in uptrend i think it will be a very good trade and its a good point to risk my money
consider your own decision
it is just my own trade not your trade
hope it will hit the tp
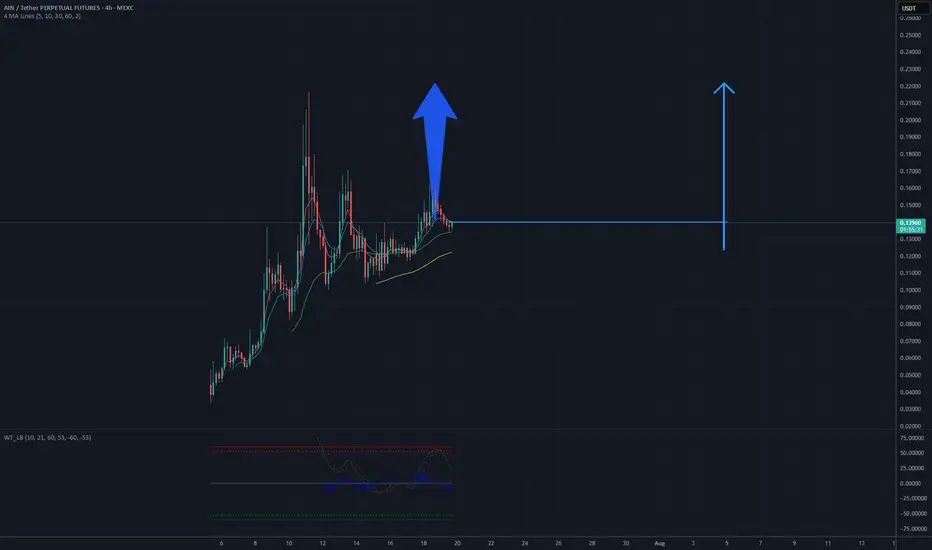
It's a time for AINUSDT! 0.22 USD will be soonAnalysis of the AINUSDT chart on a 4-hour timeframe suggests potential for an upward move. The current price is near a support level around 0.13 USD, where consolidation is observed after a previous decline. The upward price movement from the lows, supported by an ascending trendline and a break above resistance near 0.15 USD, indicates a possible continuation of the trend. If buying pressure holds, the price could test the resistance level around 0.22 USD, which would align with a projected increase of approximately 69% from the current level. Key support to monitor is 0.13 USD, with a break below potentially invalidating this scenario.
Potential TP: 0.22 $
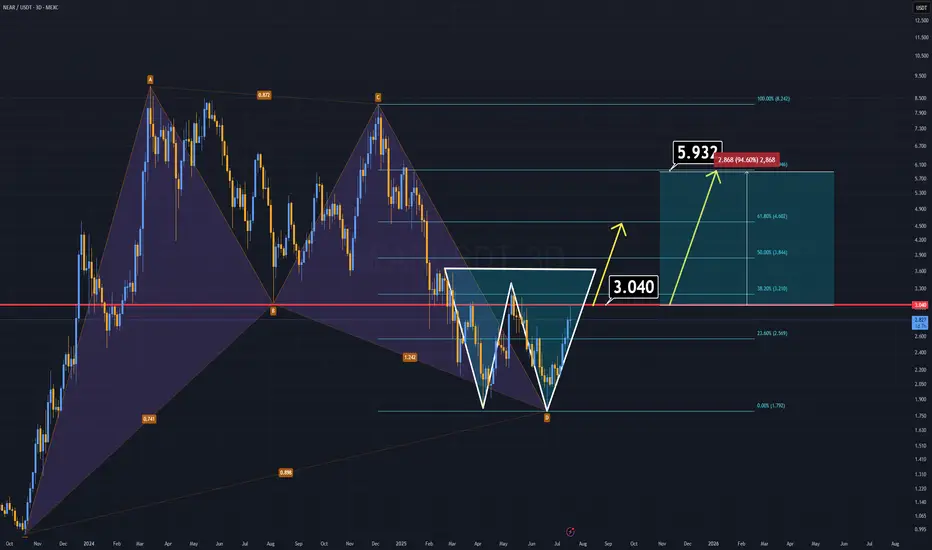
NEAR ANALYSIS (3D)NEAR Protocol has formed two strong bullish patterns and looks ready to climb, especially with the highly anticipated altseason on the horizon.
🔹 A harmonic structure from the previous cycle remains intact.
🔹 A double bottom formation is now clearly developing.
If NEAR manages to close a daily candle above the $3 level, we could see the price double in the short term.
On the fundamental side, NEAR is preparing for a vote to reduce its inflation rate. If the proposal passes, the circulating supply will decrease, potentially triggering a strong bullish run. As a leading AI-focused project, NEAR could spearhead the next wave of AI-related gains in the market.
(Read here for details):
www.near.org
All technical and fundamental signs point upward.
Thanks for reading.
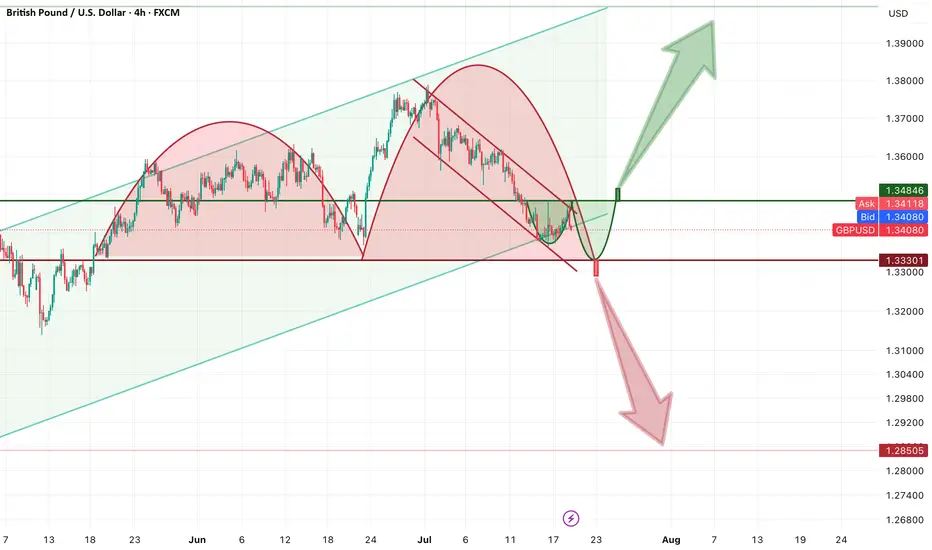
GBPUSD — We Stand at the Rubicon. Major Breakout Is Brewing. FRLThe GBPUSD chart is presenting a rare moment of confluence and clarity — the perfect environment for a high-probability reversal. The market is pressed against a crucial decision point, and the coming breakout will define the next major trend.
Let’s get into the structure:
Key Structure: Double Bottom or Continuation?
We are currently inside a local corrective downtrend, nested within a much larger bullish channel. According to Fractal Reversal Law (FRL), this correction is showing signs of exhaustion and is likely to terminate with a reversal pattern — a double bottom is forming right now.
The neckline of this potential pattern lies at 1.3485, which also marks the origin of the last impulse wave. This is the Rubicon — a horizontal barrier that separates indecision from trend reversal.
✅ Why I Lean Long (Strong Bias for Reversal)
The local downtrend is weaker than the larger trend it counteracts — it’s corrective by nature.
FRL structure (Double Bottom) is clean and supported by price behavior near dynamic support.
100MA on the Daily sits just beneath, providing key confluence as price reacts.
MACD bullish divergence on H4 is developing right as the second bottom takes shape — classic timing.
Fundamentally, the USD still lacks momentum for a sustained rally — macro pressure leans against the bearish case.
🔴 Bearish Alternative?
Yes, we must acknowledge the possibility of a broader double top forming on the Daily timeframe. But for now, it’s only potential — not confirmed — and lacks structural symmetry and conviction. This is not the scenario I prioritize.
Execution Plan — No Emotion in the Uncertainty Zone
We won’t act emotionally inside the chop zone between 1.3300 and 1.3480.
We trade confirmation only:
A clean H1 close above 1.3485 activates the long setup — reversal confirmed by neckline break.
Alternatively, a Daily close below 1.3300 may validate the bearish breakdown.
Until then, we observe. But structurally, I believe the path of least resistance is up.
🔺 Target Zones:
If confirmed, this breakout has legs toward 1.3700–1.3900, based on the measured move from the base to neckline.
Stop-loss logic aligns naturally under 1.3300 — outside the pattern and below 100MA support.
Final Words
Markets rarely give such structured signals — and when they do, it pays to be patient.
Everything points to the potential completion of a local bearish phase.
All that’s left is the trigger — and then, the phase shift begins.

TRB : FREE SIGNALHello friends🙌
📈Given the price reaching its bottom and the buyers supporting it, you can see that a classic head and shoulders pattern has formed and buyers have entered. For this reason, you can buy with capital and risk management and move with it to the specified targets.
🔥Follow us for more signals🔥
*Trade safely with us*
