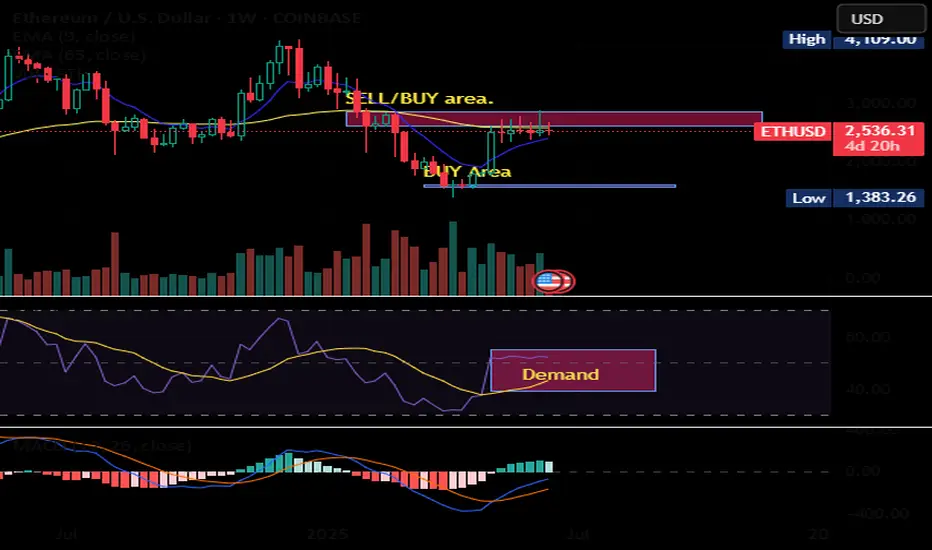
Ethereum (ETH/USDT) – Breakdown From Ascending TriangleEthereum failed to hold above the crucial resistance of $2,849 and has broken down from the ascending triangle on the 4H timeframe — invalidating the bullish breakout structure.
It seems to be consolidating and moving sideways in the range. The move is possible only if we break the channel either upside or downside.
Key Observations:
Ascending triangle fakeout followed by sharp rejection
RSI dropped from overbought (~70) to neutral zone (~46), showing weakening momentum
Current price: $2,537, testing local support at $2,384.90
Next major support zones: $2,242.98 and $1,852.48
Watch for further weakness below $2,384 — could accelerate downside toward $2,242 or lower.
Caution advised: Wait for the structure to rebuild before positioning it long.
This is not financial advice, please do your research before investing, as we are not responsible for any of your losses or profits.
Please like, share, and comment on this idea if you liked it.
#ETH #Ethereum #ETHUSDT
Harmonic Patterns

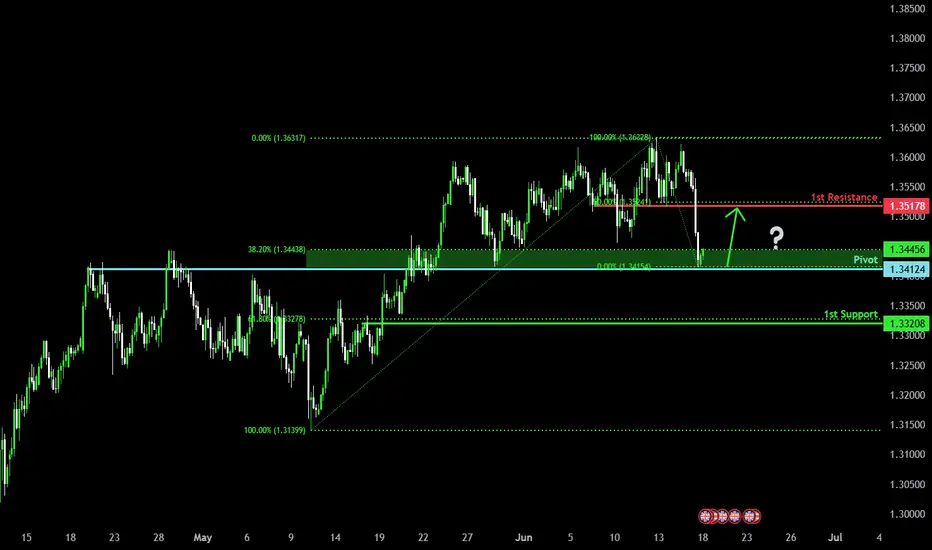
Bearish reversal off pullback resistance?The Loonie (USD/CAD) is rising towards the pivot which is a pullback resistance that aligns with the 50% Fibonacci retracement and could reverse to the 1st support.
Pivot: 1.3706
1st Support: 1.3599
1st Resistance: 1.3793
Risk Warning:
Trading Forex and CFDs carries a high level of risk to your capital and you should only trade with money you can afford to lose. Trading Forex and CFDs may not be suitable for all investors, so please ensure that you fully understand the risks involved and seek independent advice if necessary.
Disclaimer:
The above opinions given constitute general market commentary, and do not constitute the opinion or advice of IC Markets or any form of personal or investment advice.
Any opinions, news, research, analyses, prices, other information, or links to third-party sites contained on this website are provided on an "as-is" basis, are intended only to be informative, is not an advice nor a recommendation, nor research, or a record of our trading prices, or an offer of, or solicitation for a transaction in any financial instrument and thus should not be treated as such. The information provided does not involve any specific investment objectives, financial situation and needs of any specific person who may receive it. Please be aware, that past performance is not a reliable indicator of future performance and/or results. Past Performance or Forward-looking scenarios based upon the reasonable beliefs of the third-party provider are not a guarantee of future performance. Actual results may differ materially from those anticipated in forward-looking or past performance statements. IC Markets makes no representation or warranty and assumes no liability as to the accuracy or completeness of the information provided, nor any loss arising from any investment based on a recommendation, forecast or any information supplied by any third-party.

Small Farts - No Smell Gurantee!Okay so farts this is a small move you can take in conisderation to be taken in the near times! Idle scenario and stances marked!

GBPUSD is bearishFrom the chart, you will see that gbpusd is a long term bearish trade.
Reason;
1, In the bigger picture of the chart, you can an uptrend confirmation after the third touch
2, in the smaller picture you will see an ascending triangle
Wait for second trendline breakout for more confirmation and entry
Could the price bounce from here?USD/JPY is falling towards the pivot which is an overlap support and could bounce to the 1st resistance which which acts as a pullback resistance.
Pivot: 144.34
1st Support: 142.98
1st Resistance: 146.15
Risk Warning:
Trading Forex and CFDs carries a high level of risk to your capital and you should only trade with money you can afford to lose. Trading Forex and CFDs may not be suitable for all investors, so please ensure that you fully understand the risks involved and seek independent advice if necessary.
Disclaimer:
The above opinions given constitute general market commentary, and do not constitute the opinion or advice of IC Markets or any form of personal or investment advice.
Any opinions, news, research, analyses, prices, other information, or links to third-party sites contained on this website are provided on an "as-is" basis, are intended only to be informative, is not an advice nor a recommendation, nor research, or a record of our trading prices, or an offer of, or solicitation for a transaction in any financial instrument and thus should not be treated as such. The information provided does not involve any specific investment objectives, financial situation and needs of any specific person who may receive it. Please be aware, that past performance is not a reliable indicator of future performance and/or results. Past Performance or Forward-looking scenarios based upon the reasonable beliefs of the third-party provider are not a guarantee of future performance. Actual results may differ materially from those anticipated in forward-looking or past performance statements. IC Markets makes no representation or warranty and assumes no liability as to the accuracy or completeness of the information provided, nor any loss arising from any investment based on a recommendation, forecast or any information supplied by any third-party.

Audusd setup Here's a bullish analysis on AUD/USD (generic and adaptable to most timeframes; if you want it based on a specific chart or timeframe, let me know):
---
📈 AUD/USD Bullish Analysis
1. Support Zone Holding Strong:
AUD/USD has established a firm support level around where price has bounced multiple times.
Recent price action shows a double bottom or rounded base formation, indicating demand buildup.
2. Bullish Trendline Formation:
A new higher low structure is forming, suggesting a shift in momentum.
Price is respecting a short-term ascending trendline, signaling continued buying interest.
3. Breakout Confirmation:
A bullish breakout above the 0.6650 resistance opens room for an upward move.
Next target levels: 0.6700 and 0.6780.
4. RSI & Momentum Indicators:
RSI trending above 50, showing strength.
Bullish divergence on momentum indicators confirms possible upside continuation.
5. Fundamentals (Optional Context):
AUD supported by improving risk sentiment and commodity strength (especially iron ore and gold).
USD weakening slightly due to lower rate hike expectations from the Fed.
---
🎯 Bullish Targets:
Entry zone: 0.6620–0.6640
Target 1: 0.6700
Target 2: 0.6780
Stop-loss: Below support

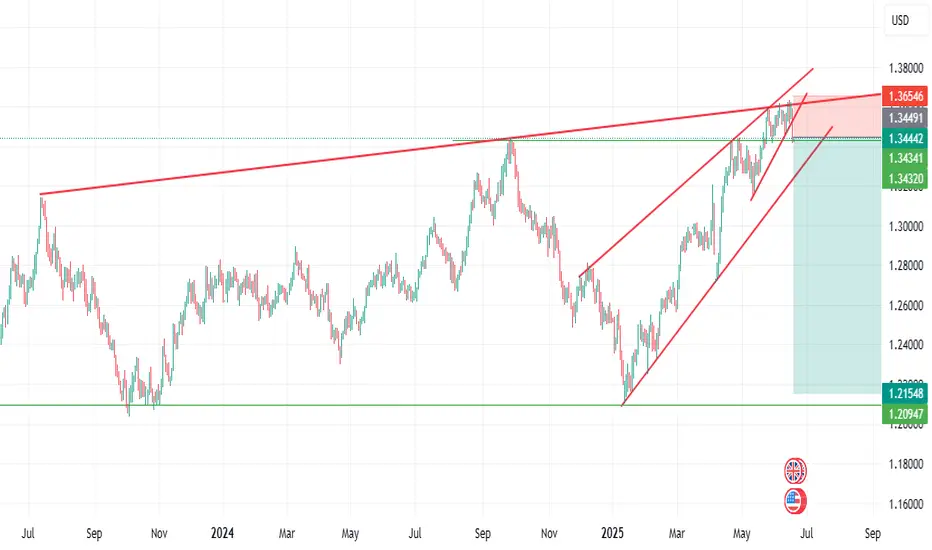
Bullish reversal off overlap support?The Cable (GBP/USD) has bounced off the pivot and could rise to the 50% Fibonacci resistance.
Pivot: 1.3412
1st Support: 1.3320
1st Resistance: 1.3517
Risk Warning:
Trading Forex and CFDs carries a high level of risk to your capital and you should only trade with money you can afford to lose. Trading Forex and CFDs may not be suitable for all investors, so please ensure that you fully understand the risks involved and seek independent advice if necessary.
Disclaimer:
The above opinions given constitute general market commentary, and do not constitute the opinion or advice of IC Markets or any form of personal or investment advice.
Any opinions, news, research, analyses, prices, other information, or links to third-party sites contained on this website are provided on an "as-is" basis, are intended only to be informative, is not an advice nor a recommendation, nor research, or a record of our trading prices, or an offer of, or solicitation for a transaction in any financial instrument and thus should not be treated as such. The information provided does not involve any specific investment objectives, financial situation and needs of any specific person who may receive it. Please be aware, that past performance is not a reliable indicator of future performance and/or results. Past Performance or Forward-looking scenarios based upon the reasonable beliefs of the third-party provider are not a guarantee of future performance. Actual results may differ materially from those anticipated in forward-looking or past performance statements. IC Markets makes no representation or warranty and assumes no liability as to the accuracy or completeness of the information provided, nor any loss arising from any investment based on a recommendation, forecast or any information supplied by any third-party.
Bullish bounce?The Fiber (EUR/USD) is falling towards the pivot and could bounce to the 1st resistance.
Pivot: 1.1451
1st Support: 1.1342
1st Resistance: 1.1614
Risk Warning:
Trading Forex and CFDs carries a high level of risk to your capital and you should only trade with money you can afford to lose. Trading Forex and CFDs may not be suitable for all investors, so please ensure that you fully understand the risks involved and seek independent advice if necessary.
Disclaimer:
The above opinions given constitute general market commentary, and do not constitute the opinion or advice of IC Markets or any form of personal or investment advice.
Any opinions, news, research, analyses, prices, other information, or links to third-party sites contained on this website are provided on an "as-is" basis, are intended only to be informative, is not an advice nor a recommendation, nor research, or a record of our trading prices, or an offer of, or solicitation for a transaction in any financial instrument and thus should not be treated as such. The information provided does not involve any specific investment objectives, financial situation and needs of any specific person who may receive it. Please be aware, that past performance is not a reliable indicator of future performance and/or results. Past Performance or Forward-looking scenarios based upon the reasonable beliefs of the third-party provider are not a guarantee of future performance. Actual results may differ materially from those anticipated in forward-looking or past performance statements. IC Markets makes no representation or warranty and assumes no liability as to the accuracy or completeness of the information provided, nor any loss arising from any investment based on a recommendation, forecast or any information supplied by any third-party.

$ETHAs stablecoins gain real-world adoption, CRYPTOCAP:ETH demand might explode.
Why? Most stablecoins are backed or run on Ethereum.
People can spend stablecoins while keeping ETH locked not sold.
This creates real utility for ETH… and tightens its supply.
#Ethereum #ETH #Stablecoins #DeFi #Crypto
Bearish reversal?US Dollar Index (DXY) has reacted off the pivot and could drop to the 1st support.
Pivot: 98.89
1st Support: 98.29
1st Resistance: 99.60
Risk Warning:
Trading Forex and CFDs carries a high level of risk to your capital and you should only trade with money you can afford to lose. Trading Forex and CFDs may not be suitable for all investors, so please ensure that you fully understand the risks involved and seek independent advice if necessary.
Disclaimer:
The above opinions given constitute general market commentary, and do not constitute the opinion or advice of IC Markets or any form of personal or investment advice.
Any opinions, news, research, analyses, prices, other information, or links to third-party sites contained on this website are provided on an "as-is" basis, are intended only to be informative, is not an advice nor a recommendation, nor research, or a record of our trading prices, or an offer of, or solicitation for a transaction in any financial instrument and thus should not be treated as such. The information provided does not involve any specific investment objectives, financial situation and needs of any specific person who may receive it. Please be aware, that past performance is not a reliable indicator of future performance and/or results. Past Performance or Forward-looking scenarios based upon the reasonable beliefs of the third-party provider are not a guarantee of future performance. Actual results may differ materially from those anticipated in forward-looking or past performance statements. IC Markets makes no representation or warranty and assumes no liability as to the accuracy or completeness of the information provided, nor any loss arising from any investment based on a recommendation, forecast or any information supplied by any third-party.

Bullish on All Time Frames.MERIT Closed at 13.95 (13-06-2025)
Bullish on All Time Frames.
Immediate Support lies around 13 - 13.20 &
then around 12 - 12.20
However, 11 - 11.10 may be re-tested in extreme
pressure.
On the flip side, once 14.20 is Sustained, we may
witness upside towards 16 - 17 & then 19 -20

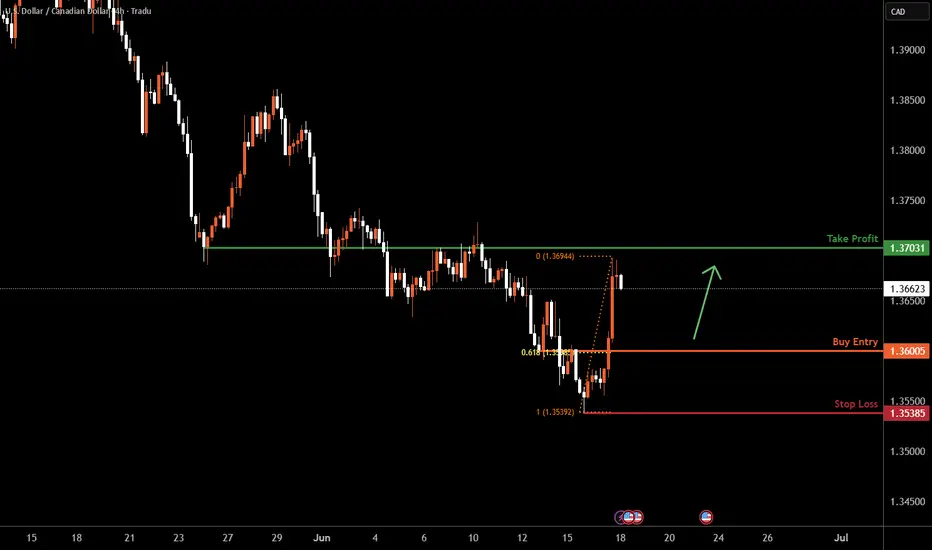
USDCAD H4 I Bullish Bounce Off the supportBased on the H4 chart analysis, the price is falling toward our buy entry level at 1.3600, a pullback support that aligns with the 61.8% Fib retracement.
Our take profit is set at 1.3703, a pullback resistance.
The stop loss is placed at 1.3500, a swing low
High Risk Investment Warning
Trading Forex/CFDs on margin carries a high level of risk and may not be suitable for all investors. Leverage can work against you.
Stratos Markets Limited (tradu.com ):
CFDs are complex instruments and come with a high risk of losing money rapidly due to leverage. 63% of retail investor accounts lose money when trading CFDs with this provider. You should consider whether you understand how CFDs work and whether you can afford to take the high risk of losing your money.
Stratos Europe Ltd (tradu.com ):
CFDs are complex instruments and come with a high risk of losing money rapidly due to leverage. 63% of retail investor accounts lose money when trading CFDs with this provider. You should consider whether you understand how CFDs work and whether you can afford to take the high risk of losing your money.
Stratos Global LLC (tradu.com ):
Losses can exceed deposits.
Please be advised that the information presented on TradingView is provided to Tradu (‘Company’, ‘we’) by a third-party provider (‘TFA Global Pte Ltd’). Please be reminded that you are solely responsible for the trading decisions on your account. There is a very high degree of risk involved in trading. Any information and/or content is intended entirely for research, educational and informational purposes only and does not constitute investment or consultation advice or investment strategy. The information is not tailored to the investment needs of any specific person and therefore does not involve a consideration of any of the investment objectives, financial situation or needs of any viewer that may receive it. Kindly also note that past performance is not a reliable indicator of future results. Actual results may differ materially from those anticipated in forward-looking or past performance statements. We assume no liability as to the accuracy or completeness of any of the information and/or content provided herein and the Company cannot be held responsible for any omission, mistake nor for any loss or damage including without limitation to any loss of profit which may arise from reliance on any information supplied by TFA Global Pte Ltd.
The speaker(s) is neither an employee, agent nor representative of Tradu and is therefore acting independently. The opinions given are their own, constitute general market commentary, and do not constitute the opinion or advice of Tradu or any form of personal or investment advice. Tradu neither endorses nor guarantees offerings of third-party speakers, nor is Tradu responsible for the content, veracity or opinions of third-party speakers, presenters or participants.
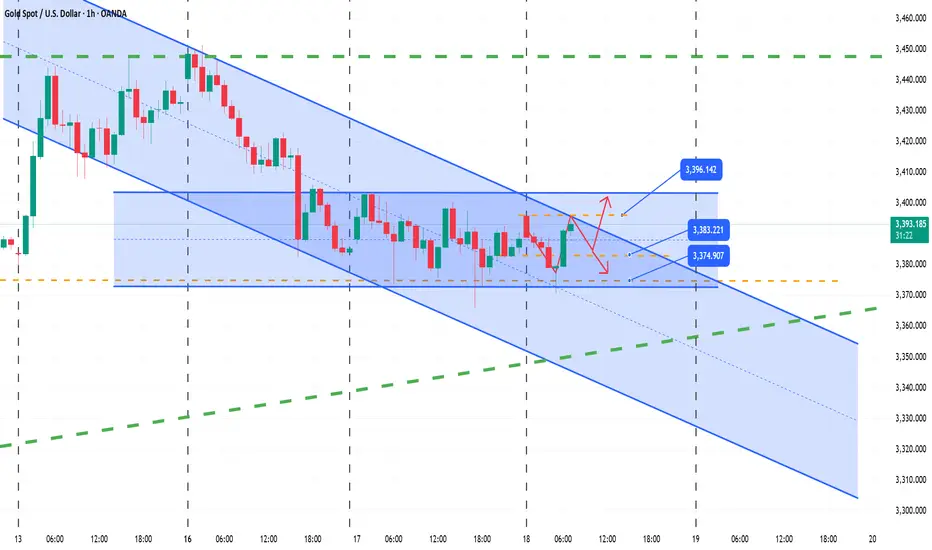
XAUUSD H1 I Bearish Reversal Off the 50% FibBased on the H1 chart, the price is approaching our sell entry level at 3408.11, a pullback resistance that aligns with the 50% Fib retracement.
Our take profit is set at 3375, an overlap support that aligns with the 50% Fib retracement.
The stop loss is set at 3441.66, a multi swing high resistance.
High Risk Investment Warning
Trading Forex/CFDs on margin carries a high level of risk and may not be suitable for all investors. Leverage can work against you.
Stratos Markets Limited (tradu.com ):
CFDs are complex instruments and come with a high risk of losing money rapidly due to leverage. 63% of retail investor accounts lose money when trading CFDs with this provider. You should consider whether you understand how CFDs work and whether you can afford to take the high risk of losing your money.
Stratos Europe Ltd (tradu.com ):
CFDs are complex instruments and come with a high risk of losing money rapidly due to leverage. 63% of retail investor accounts lose money when trading CFDs with this provider. You should consider whether you understand how CFDs work and whether you can afford to take the high risk of losing your money.
Stratos Global LLC (tradu.com ):
Losses can exceed deposits.
Please be advised that the information presented on TradingView is provided to Tradu (‘Company’, ‘we’) by a third-party provider (‘TFA Global Pte Ltd’). Please be reminded that you are solely responsible for the trading decisions on your account. There is a very high degree of risk involved in trading. Any information and/or content is intended entirely for research, educational and informational purposes only and does not constitute investment or consultation advice or investment strategy. The information is not tailored to the investment needs of any specific person and therefore does not involve a consideration of any of the investment objectives, financial situation or needs of any viewer that may receive it. Kindly also note that past performance is not a reliable indicator of future results. Actual results may differ materially from those anticipated in forward-looking or past performance statements. We assume no liability as to the accuracy or completeness of any of the information and/or content provided herein and the Company cannot be held responsible for any omission, mistake nor for any loss or damage including without limitation to any loss of profit which may arise from reliance on any information supplied by TFA Global Pte Ltd.
The speaker(s) is neither an employee, agent nor representative of Tradu and is therefore acting independently. The opinions given are their own, constitute general market commentary, and do not constitute the opinion or advice of Tradu or any form of personal or investment advice. Tradu neither endorses nor guarantees offerings of third-party speakers, nor is Tradu responsible for the content, veracity or opinions of third-party speakers, presenters or participants.

XAU/USD Bullish Reversal Toward 3,449XAU/USD Technical Analysis (30-Minute Chart)
This chart shows a bullish breakout setup for Gold (XAU/USD) based on recent price action and technical indicators:
---
🔻 Support Zone & Trend Line:
A descending support trend line has been drawn from earlier lows, showing a falling wedge structure.
The key support zone between 3,367.825 and 3,388.370 has held firmly, confirming demand in this range.
📈 Bullish Reversal Formation:
Price bounced off the support zone, suggesting a potential reversal.
A breakout above the horizontal resistance near 3,388.370 is projected, with bullish momentum forming.
🎯 Target Levels:
Immediate resistance: Around 3,388.370, which price is currently testing.
Primary target: The yellow resistance zone near 3,449.485—if broken, it may confirm a strong upward trend.
📊 Volume Profile:
Volume bars on the right show higher trading activity above 3,400, indicating potential resistance in that region.
📝 Summary: Gold is showing signs of a bullish reversal from the support trend line and key demand zone. A sustained move above 3,388.370 may lead to a rally toward the 3,449.485 resistance area.

GBPUSD H4 I Bearish Reversal Based on the H4 chart, the price is rising toward our sell entry level at 1.3519 - 1.3533, a pullback resistance that aligns closely with the 50% Fib retracement.
Our take profit is set at 1.3427, a swing low support.
The stop loss is set at 1.3631, a swing high resistance.
High Risk Investment Warning
Trading Forex/CFDs on margin carries a high level of risk and may not be suitable for all investors. Leverage can work against you.
Stratos Markets Limited (tradu.com ):
CFDs are complex instruments and come with a high risk of losing money rapidly due to leverage. 63% of retail investor accounts lose money when trading CFDs with this provider. You should consider whether you understand how CFDs work and whether you can afford to take the high risk of losing your money.
Stratos Europe Ltd (tradu.com ):
CFDs are complex instruments and come with a high risk of losing money rapidly due to leverage. 63% of retail investor accounts lose money when trading CFDs with this provider. You should consider whether you understand how CFDs work and whether you can afford to take the high risk of losing your money.
Stratos Global LLC (tradu.com ):
Losses can exceed deposits.
Please be advised that the information presented on TradingView is provided to Tradu (‘Company’, ‘we’) by a third-party provider (‘TFA Global Pte Ltd’). Please be reminded that you are solely responsible for the trading decisions on your account. There is a very high degree of risk involved in trading. Any information and/or content is intended entirely for research, educational and informational purposes only and does not constitute investment or consultation advice or investment strategy. The information is not tailored to the investment needs of any specific person and therefore does not involve a consideration of any of the investment objectives, financial situation or needs of any viewer that may receive it. Kindly also note that past performance is not a reliable indicator of future results. Actual results may differ materially from those anticipated in forward-looking or past performance statements. We assume no liability as to the accuracy or completeness of any of the information and/or content provided herein and the Company cannot be held responsible for any omission, mistake nor for any loss or damage including without limitation to any loss of profit which may arise from reliance on any information supplied by TFA Global Pte Ltd.
The speaker(s) is neither an employee, agent nor representative of Tradu and is therefore acting independently. The opinions given are their own, constitute general market commentary, and do not constitute the opinion or advice of Tradu or any form of personal or investment advice. Tradu neither endorses nor guarantees offerings of third-party speakers, nor is Tradu responsible for the content, veracity or opinions of third-party speakers, presenters or participants.

UNI - Is it Unique?So getting on UNIUSDT - It looks like a tokyo session move and a liqsurge, opting for the downmoves!

6.18 Will gold rise or fall?6.18 Will gold rise or fall?
In the geopolitical situation in the Middle East, Trump stated that "Iranian leaders will not be beheaded for the time being, but unconditional surrender is required", making the path of conflict escalation highly uncertain. At the same time, the unexpected strength of the US dollar index has put short-term pressure on gold, and the resilience of US consumption has become the core supporting factor.
The World Gold Council pointed out that 95% of central banks plan to increase their holdings of gold for long-term support, but the Federal Reserve's mouthpiece revealed that "if it were not for the tariff threat, it would have been ready to cut interest rates this week", highlighting the decision-making dilemma.
Multiple sources of information indicate that gold remains volatile in the game between risk aversion and a strong dollar.
The daily K-line closed at a cross K-line, and the long and short battles were fierce. However, the rebound after multiple bottoming out last night was still suppressed below 3405, which can be seen as a pressure point for short sellers. If 3405 is broken, the situation will change.
From the 4H analysis, the price continues to run around the middle and lower tracks, with a short-term support of 3375, and the intraday break can look at the 3350 mark.
It is currently a volatile market, but the overall trend is still rising, and you can go long at lows and short at highs.
BUY: Below 3380
SL: 3360
TP: 3395
SELL: 3398
SL: 3408
TP: 3375
Thank you for your attention. I hope my analysis can be helpful to you.
EURUSD H1 I Bearish Reversal Based on the H1 chart, the price is rising toward our sell entry level at 1.1538, a pullback resistance that aligns with the 50% Fib retracement.
Our take profit is set at 1.1454, a pullback support that aligns with the 127.2 Fib extension.
The stop loss is set at 1.1570, an overlap resistance.
High Risk Investment Warning
Trading Forex/CFDs on margin carries a high level of risk and may not be suitable for all investors. Leverage can work against you.
Stratos Markets Limited (tradu.com ):
CFDs are complex instruments and come with a high risk of losing money rapidly due to leverage. 63% of retail investor accounts lose money when trading CFDs with this provider. You should consider whether you understand how CFDs work and whether you can afford to take the high risk of losing your money.
Stratos Europe Ltd (tradu.com ):
CFDs are complex instruments and come with a high risk of losing money rapidly due to leverage. 63% of retail investor accounts lose money when trading CFDs with this provider. You should consider whether you understand how CFDs work and whether you can afford to take the high risk of losing your money.
Stratos Global LLC (tradu.com ):
Losses can exceed deposits.
Please be advised that the information presented on TradingView is provided to Tradu (‘Company’, ‘we’) by a third-party provider (‘TFA Global Pte Ltd’). Please be reminded that you are solely responsible for the trading decisions on your account. There is a very high degree of risk involved in trading. Any information and/or content is intended entirely for research, educational and informational purposes only and does not constitute investment or consultation advice or investment strategy. The information is not tailored to the investment needs of any specific person and therefore does not involve a consideration of any of the investment objectives, financial situation or needs of any viewer that may receive it. Kindly also note that past performance is not a reliable indicator of future results. Actual results may differ materially from those anticipated in forward-looking or past performance statements. We assume no liability as to the accuracy or completeness of any of the information and/or content provided herein and the Company cannot be held responsible for any omission, mistake nor for any loss or damage including without limitation to any loss of profit which may arise from reliance on any information supplied by TFA Global Pte Ltd.
The speaker(s) is neither an employee, agent nor representative of Tradu and is therefore acting independently. The opinions given are their own, constitute general market commentary, and do not constitute the opinion or advice of Tradu or any form of personal or investment advice. Tradu neither endorses nor guarantees offerings of third-party speakers, nor is Tradu responsible for the content, veracity or opinions of third-party speakers, presenters or participants.

xauusd is bullishFrom the chart, you can see that xauusd is about to move up.
wait for breakout for confirmation

LTCUSDT - Movess?LTCUSDT have moves to be seen prior to anymoves to be taken in consideration! A small pull move down then to up!

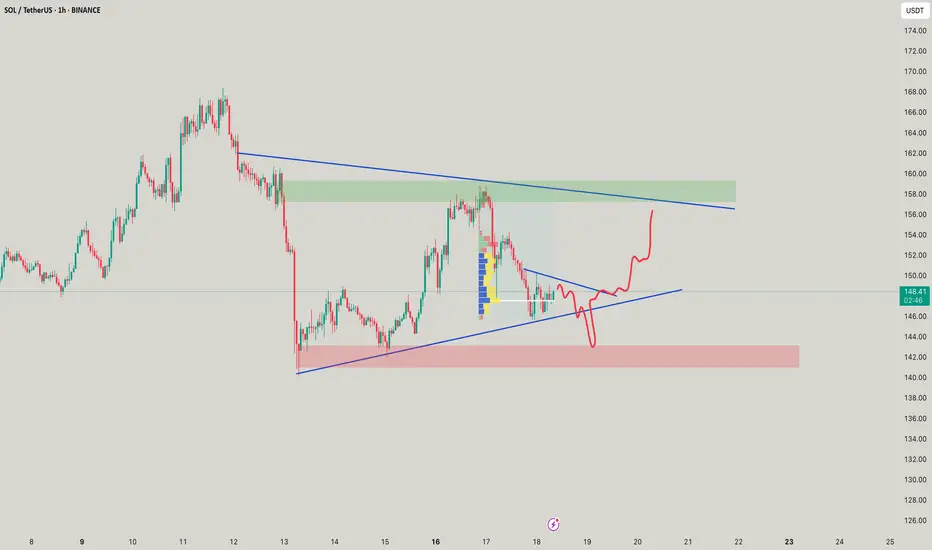
an eye for an eye! a SOUL for a SOLI dont know i like that SOL and what i wish it moves in the way, just wait for a sweep below to move, keep targets of 160 on the sweep!
HDFCBANK - For my Indian Viewers!So an Indian Viewer has asked for this, so looking onto it, the heavyweight of sector NIFTY would see a move as stated!

XRP - Straight HorseSight!XRP Vision is quiet clear - The two areas are areas of hold and from this side straight up move can be seen, though slow death move can be seen on the line marked, but its mostly due to liquidity sweeps!
