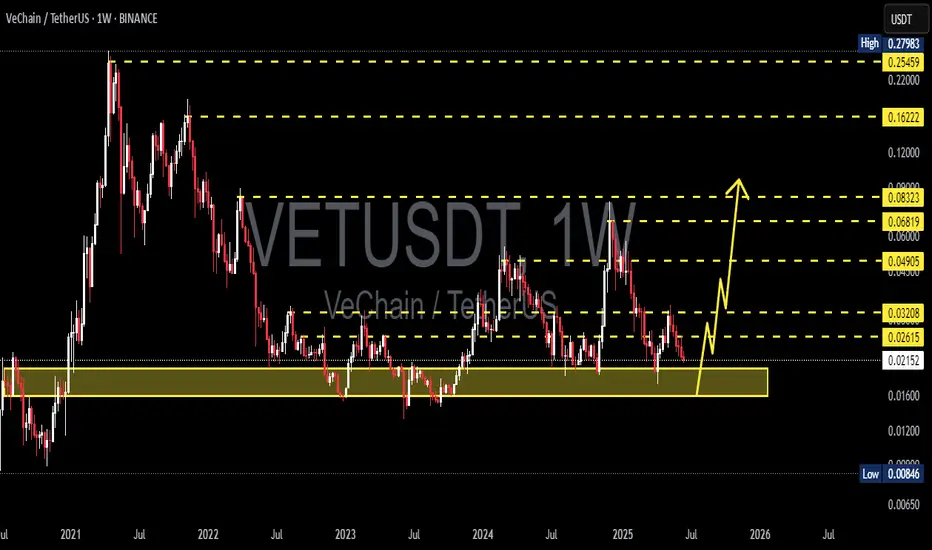
VETUSDT 1W AnalysisVET ~ 1W Analysis
#VET Buy back gradually from here if you still have confidence in this coin with a short term target of at least 20%+ from here.
Harmonic Patterns
NZDCAD SELLSA bullish flag is currently in formation here. Price should visit support trend line once more before moving higher. Sell now towards 0,82

Gold is under pressure! What is the key to breaking the deadlock
📌 Core driving events
The conflict between Iran and Israel has entered the fifth day. Air raid alerts in Tel Aviv are frequent. The fire on a cruise ship in the Strait of Hormuz has exacerbated the panic of energy transportation. Safe-haven buying supports gold prices;
Trump's contradictory statement of "peace talks + tough" (may send executives to meet but demand "unconditional surrender") has exacerbated the market's disagreement on the direction of the conflict, and risk aversion has fluctuated repeatedly.
The Federal Reserve will announce its interest rate decision today. The market expects it to remain unchanged at 4.25%-4.50%, but Powell's statement on rate cuts will affect the trend of the US dollar (Trump continues to pressure for a 1 percentage point rate cut).
📊Comment Analysis
1-hour chart: 3396 becomes the intraday strength and weakness watershed
The Asian morning session hit a high of 3396 US dollars and fell back. This point is the previous high pressure point. If the intraday rebound does not break through this position, the bearish thinking will be maintained;
💰Strategy Package
Set gold price:
🔥Sell gold area: 3390-33396 SL 3402
TP1: 3380 US dollars
TP2: 3375 US dollars
🔥Buy gold area: $3374-$3368 SL $3362
TP1: 3390 US dollars
TP2: 3400 US dollars
⭐️ Note: Labaron hopes that traders can properly manage their funds
- Choose the number of lots that matches your funds

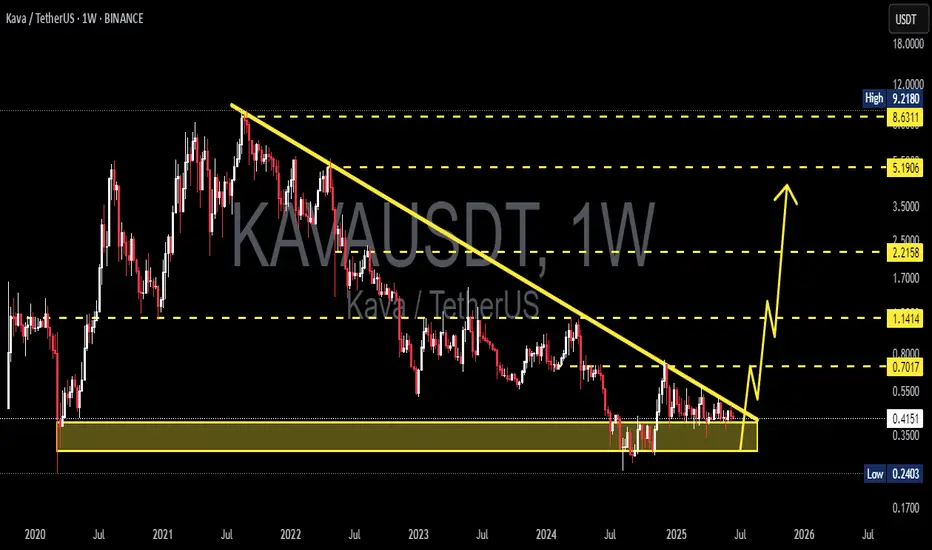
KAVAUSDT 1W AnalysisKAVA ~ 1W Analysis
#KAVA This is the lowest support block for now. Buy from here if you still have faith in this coin with a short term target of at least 15%++
RLCUSDT 1W AnalysisRLC ~ 1W Analysis
#RLC This is the closest support for now. Buy if you still have faith in this coin with a short-term target of at least 20%++

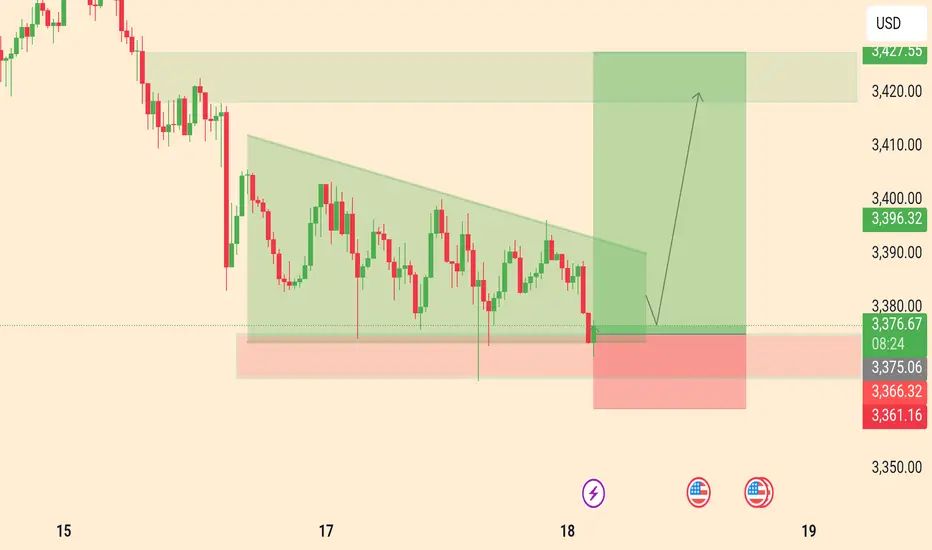
XAUUSD GOLD ANNALSIS OUTLOOK BULLISH 18/6/2025buy 3375 3370
take profit 3380
take profit 3390
take profit 3400
stop los 3360
AVAXUSDT 1W AnalysisAVAX ~ 1W Analysis
#AVAX Buy from here if you still have confidence in this coin with a short term target of at least 20%+, long term target $55

USDCAD SHORT IDEA- USDCAD Is EXTREMELY WEAK AND READY FOR SELLOANDA:USDCAD USDCAD Is extremely weak I expect price to drop hard from here.
TRADE BREAKDOWN
Weekly Trend is Bearish.
Daily Trend is Bearish.
4H Trend is also Bearish.
This is 100% a trend following strategy trade.
The entry is taken on 4H time frame targeting the recent weekly swing low.
This is a 4RR Trade.

ENAUSDT 1D Analysis ENA ~ 1D Analysis
#ENA Buy back gradually from here if you still have confidence in this coin with a short term target of at least 15%+ from here.


WTI Oil H1 | Falling toward a pullback supportWTI oil (USOIL) is falling towards a pullback support and could potentially bounce off this level to climb higher.
Buy entry is at 73.31 which is a pullback support that aligns with the 38.2% Fibonacci retracement.
Stop loss is at 70.90 which is a level that lies underneath a swing-low support and the 61.8% Fibonacci retracement.
Take profit is at 77.60 which is a swing-high resistance.
High Risk Investment Warning
Trading Forex/CFDs on margin carries a high level of risk and may not be suitable for all investors. Leverage can work against you.
Stratos Markets Limited (tradu.com ):
CFDs are complex instruments and come with a high risk of losing money rapidly due to leverage. 63% of retail investor accounts lose money when trading CFDs with this provider. You should consider whether you understand how CFDs work and whether you can afford to take the high risk of losing your money.
Stratos Europe Ltd (tradu.com ):
CFDs are complex instruments and come with a high risk of losing money rapidly due to leverage. 63% of retail investor accounts lose money when trading CFDs with this provider. You should consider whether you understand how CFDs work and whether you can afford to take the high risk of losing your money.
Stratos Global LLC (tradu.com ):
Losses can exceed deposits.
Please be advised that the information presented on TradingView is provided to Tradu (‘Company’, ‘we’) by a third-party provider (‘TFA Global Pte Ltd’). Please be reminded that you are solely responsible for the trading decisions on your account. There is a very high degree of risk involved in trading. Any information and/or content is intended entirely for research, educational and informational purposes only and does not constitute investment or consultation advice or investment strategy. The information is not tailored to the investment needs of any specific person and therefore does not involve a consideration of any of the investment objectives, financial situation or needs of any viewer that may receive it. Kindly also note that past performance is not a reliable indicator of future results. Actual results may differ materially from those anticipated in forward-looking or past performance statements. We assume no liability as to the accuracy or completeness of any of the information and/or content provided herein and the Company cannot be held responsible for any omission, mistake nor for any loss or damage including without limitation to any loss of profit which may arise from reliance on any information supplied by TFA Global Pte Ltd.
The speaker(s) is neither an employee, agent nor representative of Tradu and is therefore acting independently. The opinions given are their own, constitute general market commentary, and do not constitute the opinion or advice of Tradu or any form of personal or investment advice. Tradu neither endorses nor guarantees offerings of third-party speakers, nor is Tradu responsible for the content, veracity or opinions of third-party speakers, presenters or participants.

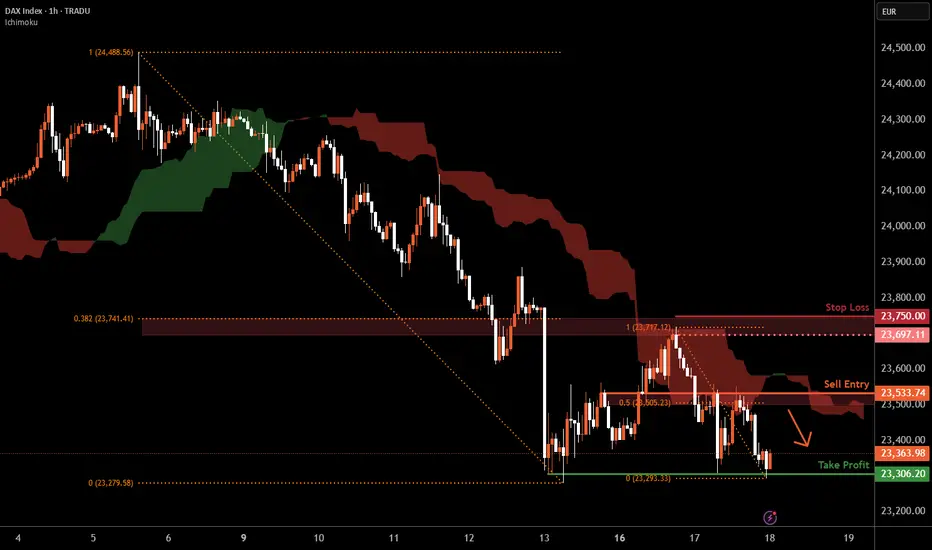
DAX H1 | Rising into a 50% Fibonacci resistanceThe DAX (GER30) is rising towards a pullback resistance and could potentially reverse off this level to drop lower.
Sell entry is at 23,533.74 which is a pullback resistance that aligns with the 50% Fibonacci retracement.
Stop loss is at 23,750.00 which is a level that sits above the 38.2% Fibonacci retracement and a swing-high resistance.
Take profit is at 23,306.20 which is a multi-swing-low support.
High Risk Investment Warning
Trading Forex/CFDs on margin carries a high level of risk and may not be suitable for all investors. Leverage can work against you.
Stratos Markets Limited (tradu.com ):
CFDs are complex instruments and come with a high risk of losing money rapidly due to leverage. 63% of retail investor accounts lose money when trading CFDs with this provider. You should consider whether you understand how CFDs work and whether you can afford to take the high risk of losing your money.
Stratos Europe Ltd (tradu.com ):
CFDs are complex instruments and come with a high risk of losing money rapidly due to leverage. 63% of retail investor accounts lose money when trading CFDs with this provider. You should consider whether you understand how CFDs work and whether you can afford to take the high risk of losing your money.
Stratos Global LLC (tradu.com ):
Losses can exceed deposits.
Please be advised that the information presented on TradingView is provided to Tradu (‘Company’, ‘we’) by a third-party provider (‘TFA Global Pte Ltd’). Please be reminded that you are solely responsible for the trading decisions on your account. There is a very high degree of risk involved in trading. Any information and/or content is intended entirely for research, educational and informational purposes only and does not constitute investment or consultation advice or investment strategy. The information is not tailored to the investment needs of any specific person and therefore does not involve a consideration of any of the investment objectives, financial situation or needs of any viewer that may receive it. Kindly also note that past performance is not a reliable indicator of future results. Actual results may differ materially from those anticipated in forward-looking or past performance statements. We assume no liability as to the accuracy or completeness of any of the information and/or content provided herein and the Company cannot be held responsible for any omission, mistake nor for any loss or damage including without limitation to any loss of profit which may arise from reliance on any information supplied by TFA Global Pte Ltd.
The speaker(s) is neither an employee, agent nor representative of Tradu and is therefore acting independently. The opinions given are their own, constitute general market commentary, and do not constitute the opinion or advice of Tradu or any form of personal or investment advice. Tradu neither endorses nor guarantees offerings of third-party speakers, nor is Tradu responsible for the content, veracity or opinions of third-party speakers, presenters or participants.
Ethereum H1 | Potential bearish reversalEthereum (ETH/USD) is rising towards a pullback resistance and could potentially reverse off this level to drop lower.
Sell entry is at 2,543.15 which is a pullback resistance that aligns with the 38.2% Fibonacci retracement.
Stop loss is at 2,625.00 which is a level that sits above the 61.8% Fibonacci retracement and a swing-high resistance.
Take profit is at 2,451.35 which is a multi-swing-low support.
High Risk Investment Warning
Trading Forex/CFDs on margin carries a high level of risk and may not be suitable for all investors. Leverage can work against you.
Stratos Markets Limited (tradu.com ):
CFDs are complex instruments and come with a high risk of losing money rapidly due to leverage. 63% of retail investor accounts lose money when trading CFDs with this provider. You should consider whether you understand how CFDs work and whether you can afford to take the high risk of losing your money.
Stratos Europe Ltd (tradu.com ):
CFDs are complex instruments and come with a high risk of losing money rapidly due to leverage. 63% of retail investor accounts lose money when trading CFDs with this provider. You should consider whether you understand how CFDs work and whether you can afford to take the high risk of losing your money.
Stratos Global LLC (tradu.com ):
Losses can exceed deposits.
Please be advised that the information presented on TradingView is provided to Tradu (‘Company’, ‘we’) by a third-party provider (‘TFA Global Pte Ltd’). Please be reminded that you are solely responsible for the trading decisions on your account. There is a very high degree of risk involved in trading. Any information and/or content is intended entirely for research, educational and informational purposes only and does not constitute investment or consultation advice or investment strategy. The information is not tailored to the investment needs of any specific person and therefore does not involve a consideration of any of the investment objectives, financial situation or needs of any viewer that may receive it. Kindly also note that past performance is not a reliable indicator of future results. Actual results may differ materially from those anticipated in forward-looking or past performance statements. We assume no liability as to the accuracy or completeness of any of the information and/or content provided herein and the Company cannot be held responsible for any omission, mistake nor for any loss or damage including without limitation to any loss of profit which may arise from reliance on any information supplied by TFA Global Pte Ltd.
The speaker(s) is neither an employee, agent nor representative of Tradu and is therefore acting independently. The opinions given are their own, constitute general market commentary, and do not constitute the opinion or advice of Tradu or any form of personal or investment advice. Tradu neither endorses nor guarantees offerings of third-party speakers, nor is Tradu responsible for the content, veracity or opinions of third-party speakers, presenters or participants.

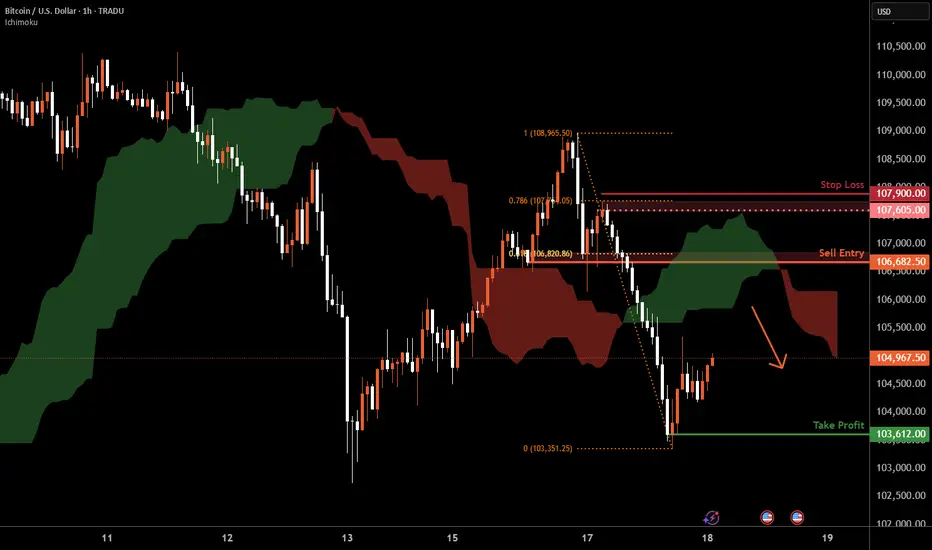
Bitcoin H1 | Pullback resistance at 61.8% Fibonacci retracementBitcoin (BTC/USD) is rising towards a pullback resistance and could potentially reverse off this level to drop lower.
Sell entry is at 106,682.50 which is a pullback resistance that aligns with the 61.8% Fibonacci retracement.
Stop loss is at 107,900.00 which is a level that sits above the 78.6% Fibonacci retracement and a swing-high resistance.
Take profit is at 103,612.00 which is a swing-low support.
High Risk Investment Warning
Trading Forex/CFDs on margin carries a high level of risk and may not be suitable for all investors. Leverage can work against you.
Stratos Markets Limited (tradu.com ):
CFDs are complex instruments and come with a high risk of losing money rapidly due to leverage. 63% of retail investor accounts lose money when trading CFDs with this provider. You should consider whether you understand how CFDs work and whether you can afford to take the high risk of losing your money.
Stratos Europe Ltd (tradu.com ):
CFDs are complex instruments and come with a high risk of losing money rapidly due to leverage. 63% of retail investor accounts lose money when trading CFDs with this provider. You should consider whether you understand how CFDs work and whether you can afford to take the high risk of losing your money.
Stratos Global LLC (tradu.com ):
Losses can exceed deposits.
Please be advised that the information presented on TradingView is provided to Tradu (‘Company’, ‘we’) by a third-party provider (‘TFA Global Pte Ltd’). Please be reminded that you are solely responsible for the trading decisions on your account. There is a very high degree of risk involved in trading. Any information and/or content is intended entirely for research, educational and informational purposes only and does not constitute investment or consultation advice or investment strategy. The information is not tailored to the investment needs of any specific person and therefore does not involve a consideration of any of the investment objectives, financial situation or needs of any viewer that may receive it. Kindly also note that past performance is not a reliable indicator of future results. Actual results may differ materially from those anticipated in forward-looking or past performance statements. We assume no liability as to the accuracy or completeness of any of the information and/or content provided herein and the Company cannot be held responsible for any omission, mistake nor for any loss or damage including without limitation to any loss of profit which may arise from reliance on any information supplied by TFA Global Pte Ltd.
The speaker(s) is neither an employee, agent nor representative of Tradu and is therefore acting independently. The opinions given are their own, constitute general market commentary, and do not constitute the opinion or advice of Tradu or any form of personal or investment advice. Tradu neither endorses nor guarantees offerings of third-party speakers, nor is Tradu responsible for the content, veracity or opinions of third-party speakers, presenters or participants.
XAUUSD 18.06.2025-Formation of the market:
After the geopolitical "panic" a correction of the upward movement was formed, but the trend retained its strength after testing the support level at 3365 and returned to the consolidation channel 3380-3400.
-Forecast:
Target level at the moment is at 3400, if it is broken and fixed above, we can consider further growth targets at 3500-3650.
News background:
The escalation of the Israel-Iran conflict strongly affects the gold positions, it is worth to follow the further course of events, although in many respects, the "moment of stress" is already reflected on the chart by a new historical maximum.
Also today will be the Fed interest rate meeting, which may also become a driver of further growth in gold, although the rate is expected to remain unchanged with 99% probability.

CLSK / 2hNASDAQ:CLSK >> 8% intraday market sell-off should be likely the partial decline in the last subdivision of the ongoing wave (y), as illustrated in my 2h-frame above.
Further decline by 12% in the ongoing last subdivision >> c of (y) finally will conclude the entire correction in Minute degree wave ii(circled).
Trend Analysis >> The trend will turn up, and an impending impulsive third wave of the same degree is anticipated to follow soon.
The Retracement Targets >> 7.93 >> 7.84

BE VIGILANT HEREWith the unrest in the Middle East
we are testing the lower support
band on XLM. My worry here is we
break the lower line of confluence
and it becomes resistance. If so,
I would plan on taking a HUGE long
margin trade on XLM around .1203
I have my BUY limit 20x orders set
@ 12 cents. Not financial advice.
USE your best judgement here and
be patient and wait for price to come
to you! Chill out in this area. A retest
of .36 cents would be a HUGE positive
for XLM however, there could be quite
a bit of volatility in the coming months.
Good Luck and...
********* HAPPY XLM HUNTING *********

RIOT / 2hAccording to the last analysis, NASDAQ:RIOT declined by 7.6% intraday right from the 4th wave extreme-high of an ongoing wave A, which may be considered as the fourth diagonal pattern in my 2h frame.
Wave Analysis >> The leading diagonal as Minor degree wave A indicates that a relatively deep correction in wave (2) might be developed.
Trend Analysis >> The trend is correcting down in the same degree wave (2), which will take a few weeks to develop.
The retracement targets >> 8.76 >> 8.20 >> 7.93 >> 7.67
#CryptoStocks #RIOT #BTCMining #Bitcoin #BTC

EGLD Runs to over $1millionBetter long the new crypto kings hurrah and thank you. This will be THE LAST opportunity you ever have of this magnitude to get rich as dog **** with like 14 bucks lol

USD/CHF is on the beginning of a bull runFrom the chart, you can see that usd/chf have just reach the end of the bearish trendline, and its about to fly up.
Reasons
1; double bottom pattern
2; completion of the inner descending triangle
3; pattern inside pattern, which is signal for strong trade
4; formation of outer descending triangle

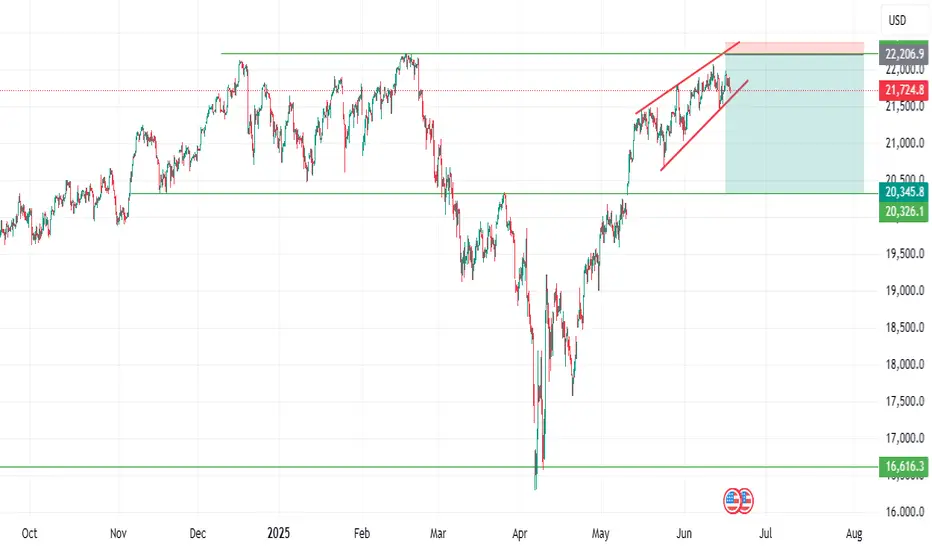
NAS100 is about experience a big fallfrom the chart, you can find out that nas100 is about to be bearish...
Reason;
1, Double top pattern
2, Ascending triangle
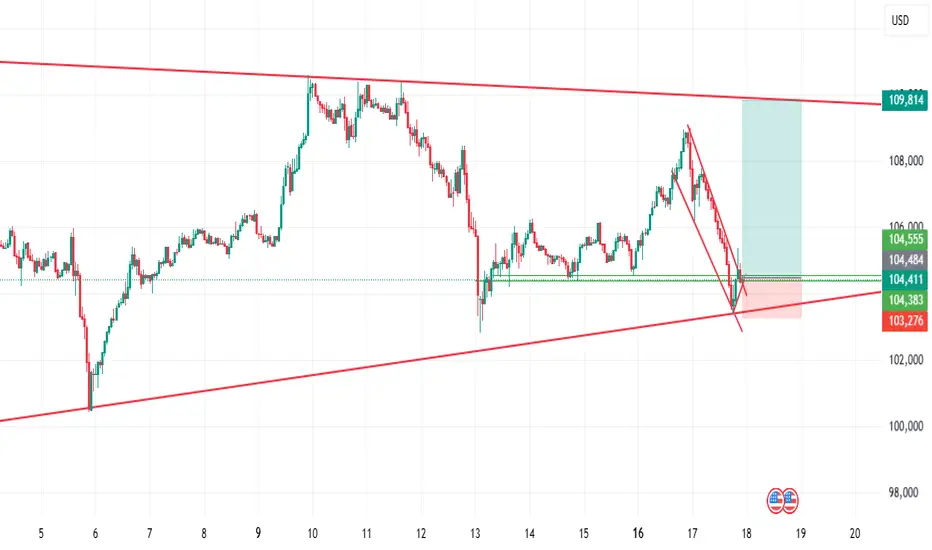
Btcusd is about to be bullishbtcusd is getting ready for tomorrow's FOMC news and we are expecting a massive bullish break out to the moon.
Reasons
1, descending triangle pattern
2, in the bigger picture of the chart, we can see a bullish flag pattern.
3, in weekly timeframe, we can see the chart is a support zone
XAUUSD is about to bullishfrom the chart, you will find out from the decending chart pattern that xauusd is about to be bullish.
reasons;
1, descending pattern
2. trendline touch
