CHECK GBPJPY SIGNAL READ CAPTAINgbpjpy sell now ✅
entry point (196.000) (196.100)
TAKE PROFIT 1: (195.650)
TAKE PROFIT 2: (195.150)
LAST TARGET (194.750)
STOP LOSS (196.500)
Harmonic Patterns

Gold is in a medium-term consolidation,The momentum of gold is weak. In the early trading, there was only a wave of upward momentum, while in the evening, it quickly fell below the 3,400 key level. As previously mentioned, if gold holds above the key level of 3,400, the bullish trend will continue. However, after breaking below 3,400, a small - level top has been formed in the short term, and the market is no longer so strong.
For our short - term operations, in the short - term correction, the gold price should focus on the support of the MA5 in the daily cycle and the MA5 in the weekly cycle for long positions. On the pullback, pay attention to the resistance level of 3,403 - 3,408 for short positions. A rebound can be followed by shorting, but it should be noted that it can only be a short - term operation!
Although gold has broken below 3,400 and the short - term direction has changed, the long - term direction has not changed. It is still in a bullish trend, and we still have the opportunity to see the high of 3,500 in the future. However, we need to wait until the bottom stabilizes. At present, we can only follow the trend and do what the market does. Short on the rebound in the next two days!
you are currently struggling with losses,or are unsure which of the numerous trading strategies to follow,You have the option to join our VIP program. I will assist you and provide you with accurate trading signals, enabling you to navigate the financial markets with greater confidence and potentially achieve optimal trading results.
Trading Strategy:
sell@3410-3420
TP:3380-3390

RTH Setup - My potential everyday model.In the video we see my potential everyday model that I will be looking for, for the next 3-6 months.

CHECK BTCUSD SIGNAL READ CAPTAINbtcusd sell now ✅
entry point (105550) (105400)
TAKE PROFIT 1: (105000)
TAKE PROFIT 2: (104250)
LAST TARGET (103500)
STOP LOSS (106200)

XRPUSD is moving within the 2.1215 - 2.3370 range👀 Possible scenario:
XRP is consolidating between $2.05 and $2.40, forming a bullish pennant on the weekly chart — similar to the 2017 setup before a 1300% rally. Analyst Mikybull Crypto predicts a 530% surge to $14 if resistance breaks. For continued upside, XRP must break above the 200-day SMA ($2.37) and hold above $2.65. RSI has climbed from 29 to 52, signaling recovery. A breakout above $2.65 could lead to $3.00 or even the 7-year high of $3.31. Failure to break $2.37 may send price back to $2.05.
Network activity is surging: XRPL is averaging 295K daily active addresses — 7x the 3-month average. Whale wallets (holding 1M+ XRP) hit a record 2,708, signaling growing institutional interest. Trident Digital plans a $500M XRP treasury, Circle launched USDC on XRPL, and Guggenheim is issuing digital commercial paper on the network. A spot XRP ETF approval could drive price to $25. Trading volume jumped 245%, open interest rose to $4.02B, and derivatives volume hit $9.8B. Price hovers around $2.22 as the market reacts to on-chain momentum.
✅Support and Resistance Levels
Support level is now located at 2.1215
Now, the resistance level is located at 2.3370.

Bullish Divergence on Weekly TF.2020 Closed at 108.80 (17-06-2025)
Bullish Divergence on Weekly TF.
Double Bullish Divergence on Daily TF.
105 - 108 can be a Good Support leve.
Upside Targets can be around 119 - 120
initially.
It should not break 95 now.

CHECK XAUUSD SIGNAL READ CAPTAINxauusd sell now ✅
entry point (3393) (3391)
TAKE PROFIT 1: (3383)
TAKE PROFIT 2: (3374)
LAST TARGET (3366)
STOP LOSS (3398)

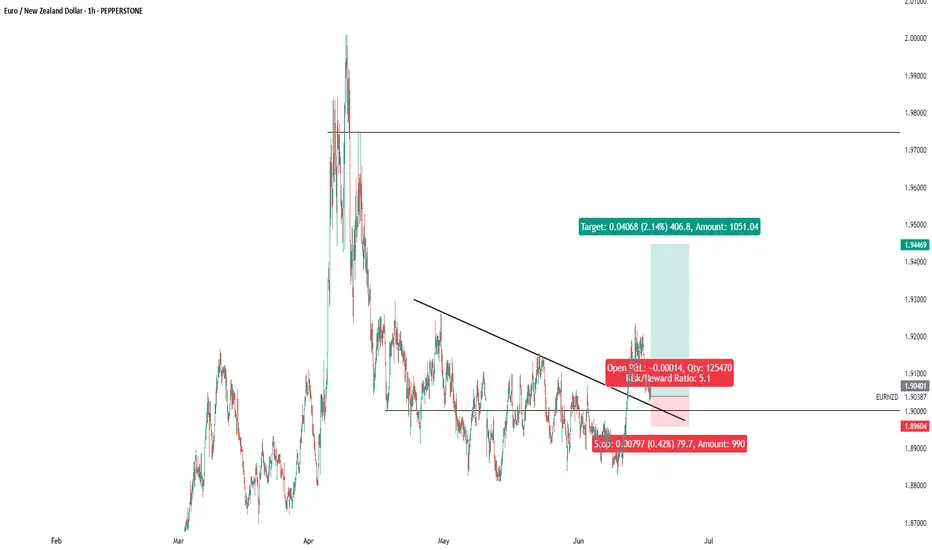
eurnzd buy signal. Don't forget about stop-loss.
Write in the comments all your questions and instruments analysis of which you want to see.
Friends, push the like button, write a comment, and share with your mates - that would be the best THANK YOU.
P.S. I personally will open entry if the price will show it according to my strategy.
Always make your analysis before a trade
gbpnzd buy signal. Don't forget about stop-loss.
Write in the comments all your questions and instruments analysis of which you want to see.
Friends, push the like button, write a comment, and share with your mates - that would be the best THANK YOU.
P.S. I personally will open entry if the price will show it according to my strategy.
Always make your analysis before a trade

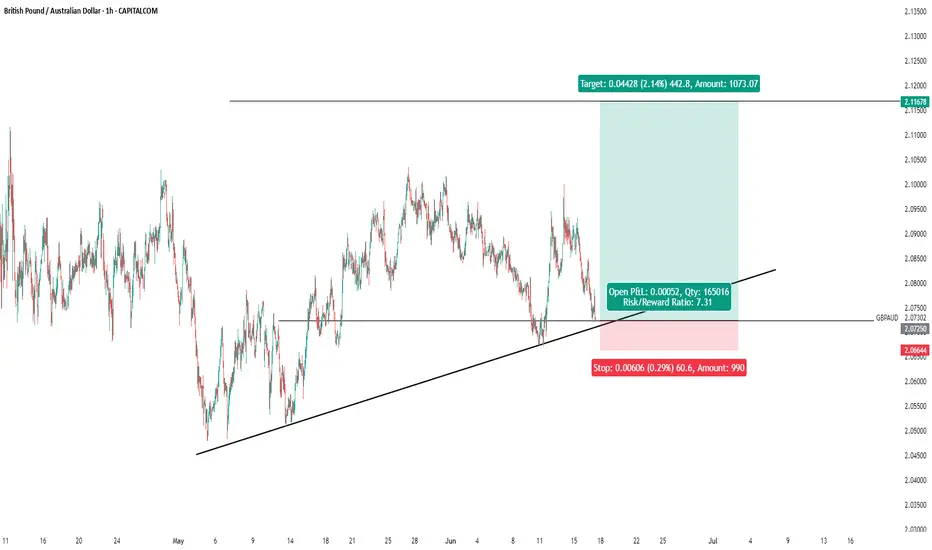
gbpaud buy signal. Don't forget about stop-loss.
Write in the comments all your questions and instruments analysis of which you want to see.
Friends, push the like button, write a comment, and share with your mates - that would be the best THANK YOU.
P.S. I personally will open entry if the price will show it according to my strategy.
Always make your analysis before a trade
GOLD is in Retracement GOLD is in bullish trend and it can make a retracement so that would be around 3260

Gold holds above key zoneAfter breaking the major resistance at 3,392 USD — a level that had been rejected multiple times in the past — XAUUSD is undergoing a slight pullback to retest the newly established support. The bullish reaction in this area suggests that buyers are still in control of the trend.
In the current context, U.S. retail sales have fallen more than expected, reinforcing expectations that the Fed may cut interest rates soon. This puts pressure on the dollar and benefits gold.
The primary scenario is a bounce from the current support toward the next resistance area near 3,481 USD. The 3,392 USD level has now become a key support to sustain the ongoing bullish structure.

EURUSD: Awaiting Confirmation to Continue the UptrendThe EUR/USD pair closed yesterday at 1.1550, moving within the 1.1526–1.1558 range. The euro continues its bullish trend, driven by U.S. inflation data coming in lower than expected, which increases expectations of an upcoming rate cut by the Fed. In addition, geopolitical tensions in the Middle East—particularly between Israel and Iran—have slightly weakened the U.S. dollar, providing additional support to the euro.
From a technical perspective, the price is currently correcting toward the 1.1480 area, where the ascending trendline converges with the exponential moving average. This is a key support zone. If it holds and a clear bullish signal emerges, EURUSD could rebound and move toward the 1.1610 resistance level.
Main scenario: look for buying opportunities around 1.1480 if a bullish confirmation appears, targeting 1.1610.
Alternative scenario: if the 1.1480 level is broken, the short-term uptrend could be at risk.

Gold Soars – Heading Towards 3,500 USD/ounce?Gold prices closed yesterday at 3,457.7 USD/ounce, up 0.12% from the previous day, fluctuating between 3,453.7 USD and 3,458.1 USD/ounce, marking the highest level in the past two months.
XAU/USD is currently maintaining an uptrend within a well-defined price channel, with strong support at the 3,390–3,400 range. After a short correction, the price could continue to rise if it holds above the EMA34, with the next target towards the 3,445–3,460 range and further up to 3,500 USD/ounce.
This upward momentum is supported by geopolitical tensions in the Middle East, particularly between Israel and Iran, driving demand for gold as a safe-haven asset. U.S. CPI data lower than expected has also increased expectations of a Fed rate cut, alongside central banks increasing gold reserves, all contributing to the continued rise in gold prices.


WTI OIL Overbought RSI = best time to sell!WTI Oil (USOIL) has been trading within a 2-year Channel Down pattern and due to the recent Middle East geopolitical tensions, the price catapulted near its top (Lower Highs trend-line).
That made the 1D RSI overbought (>70.00) and every time that took place since September 2023, the pattern priced its Lower High and started a Bearish Leg. As a result, an overbought 1D RSI reading has been the strongest sell signal in the past 2 years.
The 'weakest' Bearish Leg after such sell signal has been -25.29%. As a result, we have turned bearish on WTI again, targeting $58.20 (-25.29%).
-------------------------------------------------------------------------------
** Please LIKE 👍, FOLLOW ✅, SHARE 🙌 and COMMENT ✍ if you enjoy this idea! Also share your ideas and charts in the comments section below! This is best way to keep it relevant, support us, keep the content here free and allow the idea to reach as many people as possible. **
-------------------------------------------------------------------------------
Disclosure: I am part of Trade Nation's Influencer program and receive a monthly fee for using their TradingView charts in my analysis.
💸💸💸💸💸💸
👇 👇 👇 👇 👇 👇

USDJPYHello Traders! 👋
What are your thoughts on USDJPY?
On the USD/JPY chart, price is currently moving within a symmetrical triangle pattern and is approaching the upper trendline and a key resistance zone.
We expect that upon testing this resistance level, price will likely fail to break above it and enter a bearish phase, potentially falling at least to the specified support level.
For higher-confidence sell entries, it’s recommended to wait for a confirmed downside break of the lower trendline of the triangle, which would validate a bearish continuation.
Will this resistance hold and trigger a drop, or will bulls take control? Share your thoughts below! 🤔👇
Don’t forget to like and share your thoughts in the comments! ❤️

Excellent Trade yesterday! Today's PlayHere are the scalp plays I am watching today. A few continuation plays in to demand and a reaction off supply. Lets see what the NY brings.

XRPUSDT UPDATEPattern: Falling Wedge
Current Price: $2.2130
Target Price: $4.00
Target % Gain: 70.09%
Technical Analysis: XRP is forming a falling wedge on the 1D chart. Price is approaching the resistance trendline with potential for breakout. Volume looks stable; a breakout above $2.40 may trigger bullish momentum.
Time Frame: 1D

PNUTUSDT UPDATEPattern: Falling Wedge
Current Price: $0.2276
Target Price: $0.42
Target % Gain: 80.64%
Technical Analysis: PNUT is forming a falling wedge on the 1D chart, showing signs of a potential breakout. A breakout above the wedge resistance could trigger an 80% move. Monitor volume and candle structure for confirmation.
Time Frame: 1D

S&P500 Channel Up buy opportunity.The S&P500 index (SPX) has been trading within a Channel Up and is now on a count (5) pull-back, breaking below its 4H MA50 (blue trend-line). As long as the 4H MA100 (green trend-line) holds, we expect the index to resume the uptrend, similar to the previous Bullish Leg of the Channel Up.
That Leg almost reached the 1.5 Fibonacci extension and made a Higher High. Our Target is marginally below the new 1.5 Fib ext at 6130.
-------------------------------------------------------------------------------
** Please LIKE 👍, FOLLOW ✅, SHARE 🙌 and COMMENT ✍ if you enjoy this idea! Also share your ideas and charts in the comments section below! This is best way to keep it relevant, support us, keep the content here free and allow the idea to reach as many people as possible. **
-------------------------------------------------------------------------------
Disclosure: I am part of Trade Nation's Influencer program and receive a monthly fee for using their TradingView charts in my analysis.
💸💸💸💸💸💸
👇 👇 👇 👇 👇 👇

USDCHF - Now Bullish!Hello TradingView Family / Fellow Traders. This is Richard, also known as theSignalyst.
As per our last USDCHF analysis, attached on the chart, it rejected the upper bound of the orange channel and traded lower.
What's next?
📈USDCHF is now retesting the lower bound of the channel.
Moreover, the blue line is a strong weekly low.
🏹 Thus, the highlighted blue circle is a strong area to look for buy setups as it is the intersection of the lower orange trendline and weekly low.
📚 As per my trading style:
As #USDCHF is around the blue circle zone, I will be looking for bullish reversal setups (like a double bottom pattern, trendline break , and so on...)
📚 Always follow your trading plan regarding entry, risk management, and trade management.
Good luck!
All Strategies Are Good; If Managed Properly!
~Rich
Disclosure: I am part of Trade Nation's Influencer program and receive a monthly fee for using their TradingView charts in my analysis.

XAGUSD - BullishSilver is in a bullish trend and has formed a bullish rectangle continuation pattern. Buy above rectangle with SL below the rectangle.
