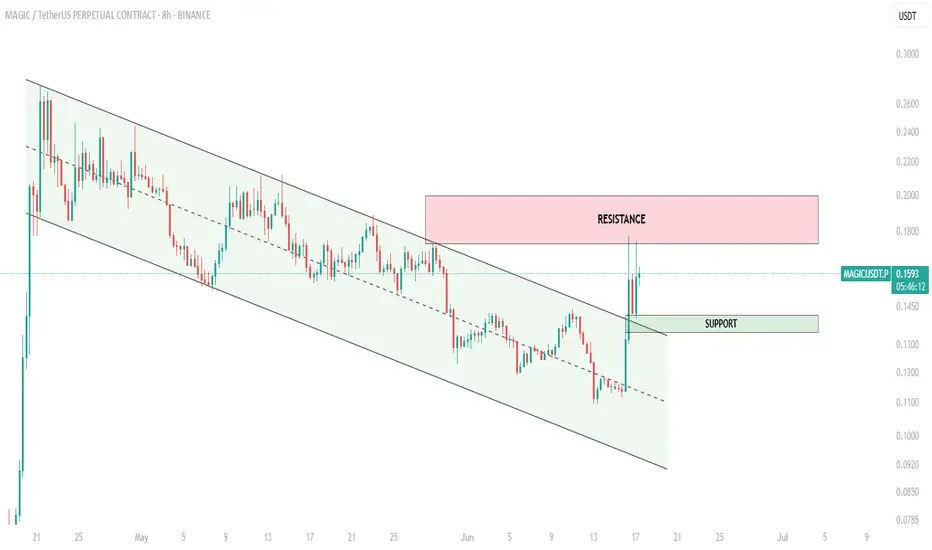
$MAGIC broke out!After weeks of grinding inside a falling channel, OMXTSE:MAGIC finally broke out with a sharp 20% move!
- Channel breakout confirmed
- Price reclaimed the support zone around $0.145
- Resistance zone ahead: $0.185–$0.20
Now it’s all about momentum. If bulls hold above the breakout area, we could see further continuation toward the upper resistance.
Trade smart — avoid FOMO. To ride the wave further, wait for a retest or clear strength above resistance.
This is how a clean technical structure plays out.
Harmonic Patterns
$HYPE Trade!!GETTEX:HYPE is testing the crucial support zone at $40.0–$40.5, right along the ascending trendline and 200 EMA on the hourly chart.
If this zone holds, we could see a rebound toward the $44.5–$46.0 resistance area.
However, a breakdown below $40.0 might trigger further downside toward the next major support at $38.0–$37.4.
Monitor closely—this zone will decide the next move.

ETHUSD, BTCUSD & Nasdaq Daily Trade SetupsIn this update we review the recent price action in Ethereum, Bitcoin and Nasdaq futures contracts and identify the next high-probability trade setups and price objectives to target. To review today's video analysis, click here!

BTCUSDThe latest breakout of the top will give a good pullback, which is currently developing.
I think we will see a price below $100,000 again.

Solana (SOLUSD) 4H Analysis – Rejection From Demand ZoneSolana is showing strong signs of accumulation after tapping a key 4H demand zone. Price is now stabilizing above $146 and may be preparing for a bullish push toward key resistance levels.
📌 Key Technical Highlights:
🔸 Strong Demand Zone – $146.92 to $140.00:
This orange zone has served as a launchpad in the past, and recent bullish rejection suggests buyers are active again.
🔸 Mid-Range Resistance – $165.70:
A previous flip zone and potential short-term target. If SOLUSD holds above $146, this level is likely to be tested again soon.
🔸 Major Supply Zone – $183.18:
This level marks a strong overhead resistance from previous highs. A break above $165 would bring $183 into focus.
🔄 Current Market Behavior:
SOL recently formed a double-bottom structure at demand.
Price is now pulling back slightly after a short-term bounce.
If buyers defend the $146 level again, expect a new wave toward $165.
🎯 Trade Setup:
Buy Zone: $146–$150
TP1: $165
TP2: $183
Stop Loss: Below $140
🧠 Insights:
With market sentiment gradually improving across altcoins, Solana is looking primed for a relief rally. A breakout above $165 would invalidate the lower high structure and confirm a trend reversal on the 4H chart.
---
💬 What’s your take on SOL this week? Bullish or still cautious? Drop your thoughts below 👇
📍 Don’t forget to follow for real-time crypto setups and insights!
#Solana #SOLUSD #CryptoTrading #TechnicalAnalysis #FrankFx14 #PriceAction #DemandZone #BullishSetup #LuxAlgo #Altcoins #TradingView

XRPUSD Daily Analysis – Bullish Setup Forming Inside Key Range!XRP is currently trading at $2.2138, consolidating just above a critical demand zone and preparing for what could be a strong bullish breakout. The range-bound structure is tightening, and pressure is building for the next major move.
🔍 Key Technical Insights:
🔹 Major Demand Zone (Support) – $2.1470 to $1.8547:
Price has bounced multiple times from this orange demand zone, showing consistent buying interest and strong liquidity protection. It’s acting as a base for a possible bull rally.
🔹 Mid-Range Resistance – $2.5586:
This level has held firm since March. A clean breakout above it could attract massive volume and bullish continuation.
🔹 Final Bullish Target – $3.2967:
A powerful supply zone resides here, which is also the yearly high area. If XRP breaks $2.55 convincingly, we may see a strong push toward this zone.
🔄 Current Price Action:
Price has been accumulating sideways between $2.15 and $2.55.
Volatility is contracting, indicating a possible breakout ahead.
Recent candle rejections suggest buyers are stepping in at every dip.
📊 Trade Plan:
🔽 Buy Zone: $2.15–$2.20 (near demand)
🔼 Take Profit Levels: $2.55 and $3.29
🛑 Stop Loss: Below $1.85 (break of demand)
🧠 Fundamental Context:
🗓️ With major U.S. news events around the corner, volatility may spike. XRP could ride a wave of positive momentum, especially if sentiment improves toward altcoins. Keep an eye on regulatory headlines as well – XRP tends to react sharply.
---
💬 Are you loading your XRP bags here or waiting for confirmation?
Comment your analysis below! 👇
📌 Follow me for more crypto setups and price action strategies.
#XRPUSD #CryptoAnalysis #Altcoins #Ripple #PriceAction #DemandZone #BullishSetup #LuxAlgo #FrankFx14 #TradingView


GOLD (XAUUSD) Daily Analysis Potential Rejection at Supply Zone
Gold is currently trading at $3,383, right inside a major daily supply zone between $3,370–$3,403, as identified by the LuxAlgo Visible Range. Price has tested this zone multiple times and is now showing signs of exhaustion.
🔍 Key Technical Highlights:
🔹 Strong Daily Supply Zone (Resistance):
Price is currently consolidating inside a key supply zone where previous rejections have occurred. The repeated failure to break above this level may trigger a bearish move soon.
🔹 Double Top / Triple Tap Formation:
Price action is hinting at a potential double top or distribution phase, which often signals a major reversal pattern.
🔹 Bearish Targets in Sight:
If price breaks below the minor support at $3,350:
🔻 Target 1: $2,997 – Previous strong demand zone and support.
🔻 Target 2: $2,602 – Critical demand zone with historical buying pressure.
🧠 Market Sentiment:
Gold has been in a strong uptrend since November 2024, but the momentum is now stalling at a psychological barrier. With potential bearish divergence forming and economic data releases ahead (📰 US economic news event marked), bulls might take profits, leading to a deeper pullback.
⚠️ Trading Plan:
📌 Sell Zone: $3,380–$3,400
🎯 Take Profits: $3,000, $2,600
🛑 Invalidation: Clean break above $3,410 with strong volume
💬 What’s your take on gold – is this a trap or the beginning of a major drop? Comment below! 👇
🔔 Follow for daily trade setups and live market insights!
#XAUUSD #GoldAnalysis #Forex #PriceAction #SupplyAndDemand #BearishReversal #TradingSetup #LuxAlgo #SmartMoney #FrankFx14

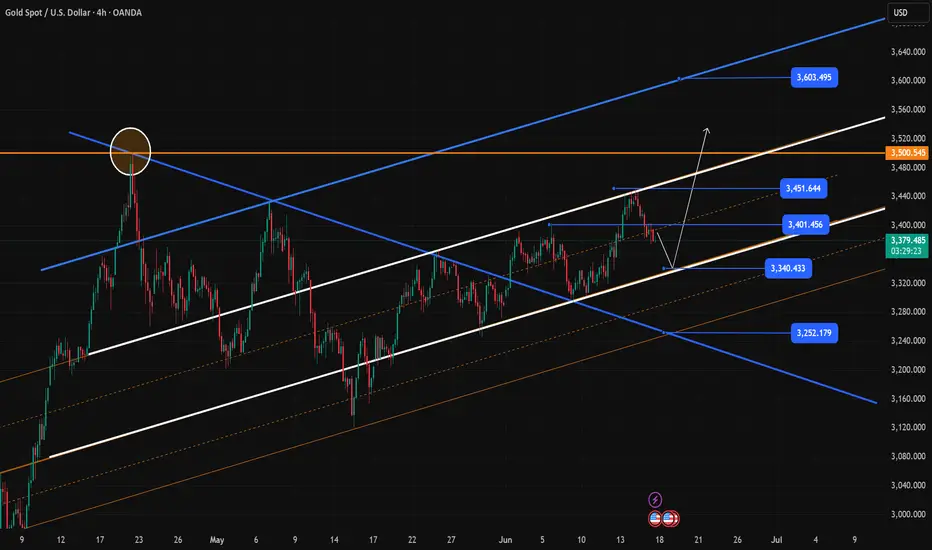
XAUUSD-it is very likely ATH in weekGold prices are being directly affected by the Israel-Iran tensions, the risk of trade conflicts due to the new US tariff policy, and concerns about slowing global economic growth. However, gold prices suddenly fell in the context of improving risk appetite of investors as they get used to the "new normal".
Daniel Pavilonis, senior commodities broker at RJO Futures, commented that if this rally starts to lose momentum, it could be a double top pattern for gold. Giving advice to investors, according to Mr. Pavilonis, they should start considering reducing their gold position at this time if they missed the opportunity to take profits at $3,509. When gold is peaking, investors see other markets moving higher, such as silver, platinum and palladium.

Today's gold price: support level 3335-3370,resistance level3400Today's gold price: support level 3335-3370, resistance level 3400-3420
On Tuesday (June 17), spot gold once again reversed the previous trading day's decline and closed at $3380.
As concerns about geopolitical conflicts between Israel and Iran re-heated, the US dollar rose and became the headline of trade news.
From a technical perspective:
Before the Fed announces its policy, our trading ideas for gold prices are still in a state of buying on dips.
News interpretation:
Recently, as the market's acceptance of the possibility of the Fed continuing to cut interest rates in 2025 continues to increase, the US dollar is unlikely to attract strong buying, thereby providing support for interest-free assets such as gold.
On the other hand, Israel's attack on Iran's state TV triggered a strong response from Iran, claiming that it would carry out the "largest missile attack in history."
Near the Strait of Hormuz, three oil tankers caught fire and geopolitical tensions intensified.
Summary: Market risk appetite has cooled significantly, still providing strong momentum for safe-haven buying of gold.
As shown in Figure 4h:
The gold daily chart maintains a clear ascending triangle convergence and oscillation trend,
Support level: 3370-----3335. .
If this area is effectively broken, the short-term upward structure may be destroyed and the price will face further downside risks.
Current strong resistance level: $3,400.
If it is successfully broken, it will open up the upside space to the $3434-3435 range, and then challenge the multi-week high of $3451-3452.
The ultimate goal: still pointing to the historical high of $3,500.
This position is also the overlapping area of the upper rail of the channel, which has a strong technical resistance significance.
From the current 4 hours, if the price falls directly, the rebound will not exceed the 3420-3422.5 line.
Specific operation ideas:
Buying ideas:
Buy: 3370-3375
Target: above 3400
Stop loss: 3360-3365
Selling ideas:
Sell: 3415-3420
Target: 3390-3380
Stop loss: 3425-3430

NAS100 – Major Rejection from Weekly Supply Zone!The NASDAQ 100 is showing clear signs of weakness after tagging the strong supply zone near 21,927, an area previously respected as resistance. The market printed a bearish daily close after failing to break above, forming a potential double top pattern just below key resistance.
🔵 Key Zones to Watch:
🔼 Supply Zone: 21,765 – 21,927 (Strong institutional selling pressure)
🔽 Next Target 1: 19,185 (mid-structure support)
🔽 Next Target 2: 16,948 (high-volume demand zone)
📉 Bearish Scenario: If price continues to reject the supply area, we expect momentum to shift bearish targeting the 19,185 zone and possibly 16,948 if major U.S. economic data disappoints.
⚡ Why This Setup Matters:
Market is overstretched, showing distribution signs
Risk-off sentiment growing ahead of major economic reports
Volume profile confirms resistance overhead
🎯 Trading Plan:
Monitor for confirmation (bearish engulfing, breakdown of recent lows)
Short bias below 21,765
Watch for reaction at 19,185 and strong buy interest at 16,948 zone
📊 Let’s hear your thoughts: Will NAS100 hold or is a deeper correction coming? Comment below! ⬇️
#NASDAQ #US100 #Indices #BearishReversal #SupplyDemand #SmartMoney #PriceAction #TradingSetup #TradingView #LuxAlgo


AUD/USD Bearish Setup – Rejection from Supply ZoneAUD/USD is showing signs of bearish pressure after getting rejected from the key 0.65420 supply zone, marked by strong historical resistance and a high-volume node. Price tested this area multiple times but failed to break above, forming a potential lower high – a classic signal of institutional distribution.
🔵 Key Levels:
Resistance (Supply Zone): 0.65420
Mid-range support: 0.65040
Demand Zone: 0.64649 – 0.64400
🔻 Bearish Outlook: If price holds below 0.65420, we anticipate a drop first toward 0.65040, and potentially down to 0.64649, where a demand zone is likely to react. The previous bounce from demand suggests smart money accumulation below.
📌 Watch for:
Bearish engulfing or rejection wick candles near 0.65400.
Break below 0.65040 to confirm short continuation.
Confluence with macroeconomic events (FOMC, US data on the 17th–18th).
💬 Are you shorting AUD/USD from the supply zone? Drop your thoughts👇
#AUDUSD #Forex #SmartMoney #SupplyDemand #PriceAction #LuxAlgo #ForexTrading #TradingView #MarketStructure

Today's gold price may fall to 3340-3350Today's gold price may fall to 3340-3350
As shown in Figure 4h
The current support level of gold price is 3370-3380. Once it falls below this range, the gold price will fall further to 3350-3340.
At that time, we considered that it was a good choice to buy the bottom of gold price in the 3340-3350 range, and it was also a relatively stable and conservative strategy.
Technical analysis:
As shown in the figure: At present, we believe that the white channel of gold price is the main rising channel.
Gold price fluctuation range: 3350-3450, lower support level: 3400
The performance of gold price is also the same, and there is strong resistance near 3400.
The current fluctuation range of gold price: 3380-3400, lower support level: 3370
Operation strategy:
1: As long as the gold price falls below 3400, it will be mainly short at high prices.
2: Once it falls below 3370, the next target of gold price, 3350, will be a high probability event.
3: The macro trend of gold prices is still bullish. It is recommended to hold long positions and wait for the performance of the 3340-3350 range.
4: Conservatives can wait for the opening of the US market before making a decision
5: Radicals can choose to ambush in advance after judging that the gold price stabilizes in the 3370-3350 range, lightly position, reserve enough bargain-hunting positions, and cover positions at any time.
Gold precision operation ideas!News interpretation: This week, the Fed's policy meeting, retail sales data and geopolitical situation will become the three core factors affecting the global market. The Fed may keep interest rates unchanged, but its economic forecasts and statements on future rate cuts will directly affect the market's judgment on the trend of the US dollar. If the Fed releases dovish signals, the US dollar may be under pressure in the short term, but geopolitical risks and safe-haven demand may provide support for it. On the contrary, if the Fed emphasizes inflation risks, the US dollar may strengthen, but this may put pressure on global risk assets. In the long run, the fate of the US dollar is still closely related to the Fed's balancing act. Under the multiple challenges of inflation, employment and geopolitics, every step of the Fed will affect the nerves of the global market.
Analysis of gold trend: Gold closed strong and full last week, and after the previous retracement, it has accumulated momentum. The weekly chart failed to further lose the defense of the 10-week line, the lifeline of the bulls. After the consolidation, it regained momentum and closed above 3,400, breaking the previous secondary high. It destroyed the pattern of further adjustment, and the weekly line is bullish. From the weekly level, the gold price is supported by the support level of 3258-60. From the mid-term perspective, it is still in the mid-term bull market. The price will be further under pressure only if it breaks the weekly support.
Operation suggestion: The early high opening and the fallback continued. There was a signal of stopping the decline at the beginning of the European session. The current gold price is trading around 3415. There are two predictions for the next trend: the first is that 3410 stabilizes and rises to the gap position in the early session and then falls. The other is that it falls after crossing the gap position, and then rises after the second test around 3410. The overall idea is to rebound upward in the European session, and then confirm the operation idea of the US session based on the rebound strength of the European session.

Will gold continue to rise after a pullback?From the 4-hour market analysis, the support below is around 3408-10, and the short-term bullish strong dividing line moves up to the 3388-93 level. The daily level stabilizes above this position and continues to maintain the same low-long rhythm. Short positions against the trend need to be cautious. There is a high probability that the short-term will continue to rush up to test the previous high.
Gold operation strategy:
Gold goes long when it falls back to 3410, and goes long when it falls back to 3380, with a stop loss of 3380, and the target is 3445-3450. Continue to hold if it breaks;

Gold trend analysis and operation ideasGold, the price has rebounded from the previous high of 3500 to 3120 in this round. After continuous rise, it fell under pressure at 3452 on Monday due to the decline of market risk aversion; the article emphasizes that there is still room for the weekly support MA5-3360 below, and it can be bearish; the actual rebound during the day was 3403 and then fell back to 3373, and now reported 3383, which is in line with expectations;
The short structure of the 2H chart is obvious, the short-term resistance in the evening is 3386-3390, and the strong resistance is 3396; the short-term support is 3373, the strong support is 3360, and the break is expected to fall to 3340;
Strategy 1: Sell near 3386, SL3400, TP3360; Hold after break;

CHECK BTCUSD SIGNAL READ CAPTAINbtcusd) SELL zone
(trade satup)
entry point (106455) to (106145) 📊
first target (105515)📊
2nd target (104890) 📊
last target (104370) 📊
stop loss (106825)❌

EUR/USD (1-Hour Timeframe) – Bearish Trade Setup Explanation.This chart shows a potential short (sell) opportunity on EUR/USD based on the Smart Money Concept (SMC), focusing on Fair Value Gap (FVG) and Order Block (OB) confluence.
🔍 Key Zone Highlighted:
The price has retraced into a supply zone, which combines:
Fair Value Gap (FVG) – an imbalance created by a strong bearish move.
Order Block (OB) – the last bullish candle before a strong bearish push, now acting as resistance.
This confluence makes the zone (around 1.15870) a high-probability reversal area.
📉 Trade Plan:
Sell Entry: Near the current price at 1.15870, inside the FVG+OB zone.
Stop Loss (SL): Placed above the supply zone at 1.16400 to protect from invalidation.
Target 1: 1.15107 – conservative target based on previous support.
Final Target: 1.14100 – a lower liquidity zone that could be reached if bearish momentum continues.
💡 Logic Behind the Setup:
Price is reacting to a previously respected bearish OB + FVG.
Strong bearish impulse occurred from this zone earlier, suggesting institutional selling.
The retracement back into this zone presents a low-risk, high-reward short entry.
Expectation: price will reject from this zone and move down toward the targets.
✅ Risk-Reward Ratio:
The setup provides a favorable risk-to-reward ratio, especially if the final target is reached.

GOLD bearish outlook if the fundamental not involve.This is a smart money concept (SMC) based technical analysis chart for Gold Spot / U.S. Dollar (XAU/USD) on the 1-hour timeframe, showing a bearish market bias.
Key Terms & Annotations:
BOS (Break of Structure): Indicates a bullish breakout in the earlier phase of the market.
$$$ (Liquidity Grab): A sweep of previous highs, used to trap traders before reversing.
OB (Order Block): The last bullish candle before a bearish move; potential supply zone.
CHoCH (Change of Character): A bearish signal showing potential reversal of trend.
EQL (Equal Lows): Liquidity lying below; possible target for price.
FVG (Fair Value Gap): An inefficiency in price, where price may retrace to fill the gap.
📉 Trading Idea Summary:
The price recently showed a Change of Character (CHoCH) and started moving downward, indicating a shift from bullish to bearish.
A bearish order block (OB) and a Fair Value Gap (FVG) zone above current price suggest a potential retracement area before continuing down.
The note on the chart says:
"If the price breaks out with a strong body, then go for short."
Meaning: Wait for price to break below the current support area (EQL) with a strong bearish candle body. If that happens, it's a signal to enter a short (sell) trade.
Target zone is marked near 3,374.285, which is the next liquidity level or demand zone.
Conclusion:
The setup suggests:
Wait for a strong breakout below current support.
If confirmed, enter a short trade targeting lower liquidity levels.
Be cautious if price retraces into the FVG or OB zone, as it may provide another short entry.

AUDJPYAUDJPY: 10-Year Bond Yields, Interest Rates, Bank Lending Rates, and Carry Trade Advantage (June 2025)
1. 10-Year Government Bond Yields
Australia (AUD):
The 10-year Australian government bond yield is currently around 4.48%–4.53%.
Japan (JPY):
The 10-year Japanese government bond yield is about 1.48% as of June 16, 2025.
2. Central Bank Interest Rate Decisions
Reserve Bank of Australia (RBA):
The RBA cut its cash rate by 25 basis points to 3.85% in May 2025, citing progress in reducing inflation and global uncertainties.
Bank of Japan (BOJ):
The BOJ held its key short-term policy interest rate steady at 0.5% at its June 2025 meeting, maintaining the highest level since 2008.
3. Bank Lending Rates
Australia:
The average overdraft bank lending rate is 10.51% as of April 2025.
Japan:
The long-term prime bank lending rate is 2.05% (April 2025), while the average commercial bank lending rate is reported at 1.625% as of February 2025.
4. Interest Rate Differential
Policy Rate Differential:3.85%3.85% (RBA) − 0.5%0.5% (BOJ) = 3.35%.
10-Year Bond Yield Differential:4.48%4.48% (Australia) − 1.48%1.48% (Japan) = 3.00%.
5. Carry Trade Advantage
Mechanism:
Investors borrow in the low-yielding Japanese yen (JPY) and invest in higher-yielding Australian dollar (AUD) assets, profiting from the interest rate differential.
Current Advantage:
The wide gap in both policy rates and bond yields makes AUDJPY one of the most attractive carry trade pairs in 2025. The 3.35%–3.00% differential offers steady potential returns, especially in a stable or risk-on market environment.
Risks:
If global risk sentiment deteriorates, the yen can strengthen rapidly as a safe haven, unwinding carry trades.
Sudden shifts in RBA or BOJ policy could narrow the differential and reduce the carry trade's appeal.
6. Summary Table
Factor Australia (AUD) Japan (JPY) Differential / Impact
10Y Bond Yield 4.48–4.53% 1.48% 3.00% (AUD advantage)
Policy Rate 3.85% 0.5% 3.35% (AUD advantage)
Bank Lending Rate 10.51% 1.625–2.05% AUD much higher
Carry Trade Outlook High yield, attractive Low yield, funding Strong incentive for AUDJPY long
Conclusion
The AUDJPY pair is strongly supported by a wide interest rate and bond yield differential, making it a favored target for carry trade strategies in 2025. The RBA’s relatively high rates and the BOJ’s ultra-low rates, combined with stable economic conditions, provide a consistent yield advantage for investors holding long AUDJPY positions. However, traders should monitor global risk sentiment and central bank policy shifts, as these can quickly change the carry trade landscape


SELL AUDUSDAUDUSD price displays a double top pattern sitting at the resistance. Price should decline from here towards the neckline 0,6512. Let us see
