BULLISH GBPAUDGBPAUD now sits at the support of this bullish channel. First target is the last lower high at 2,0853. Watch for any sign of strength and place buy positions.
Harmonic Patterns

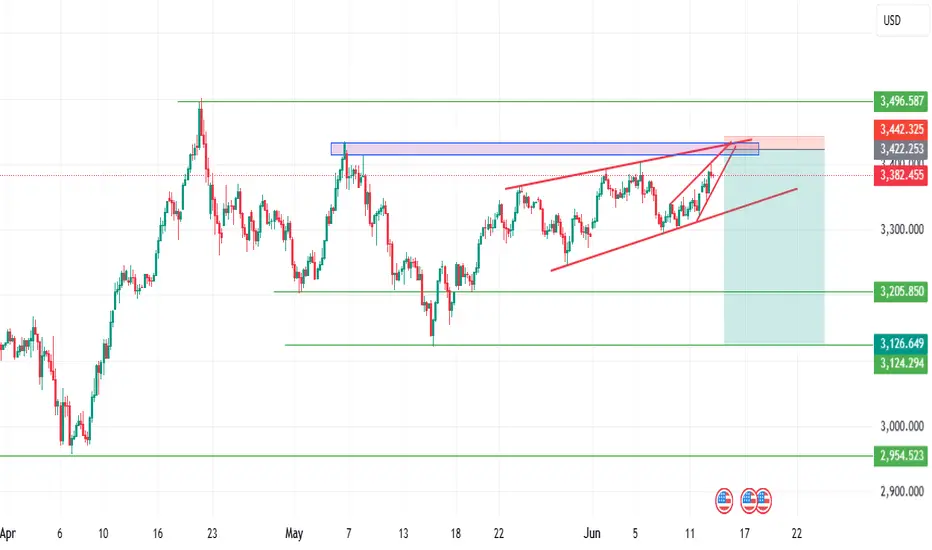
XAUUSD Bearish signalFrom the analysis, you will understand that xauusd is about to fall drastically after a small bull run.
Reasons;
1' Double top pattern
2' Trendline strategy
3' Ascending triangle pattern
wait for the entry point
GOLD GOLD brokers have different intraday candle closes which will affect your buy sell decision since we analysis chart based on structure ,multiple brokers charting is key to winning in the market and keep in mind that the 10 year bond yield chart and dxy should be in the picture too..
,the price action on 3hr shows that GOLD trading between demand and supply trendline line ,we have taken advantage of retest at 3373-3375 broken descending trendline and on the retest 3373-3375 activated . but 3403-3398 remains higher intraday day 3hr timeframe supply zone coming as a black ascending trendline. If buyers wont break it, they will continue to sell from that level ,if they start selling and break the current ascending trendline ,i will be waiting at the next demand floor 3342-3347floor and the next floor will be to retest the descending trendline breakout connecting 3500-3438-3365 breakout and that will be 3261-3265 demand floor .
goodluck

BTC/USD is bearish, after a small bull runFrom the chart, you can see that btc/usd is about to drop further..
wait for full formation of bearish flag and you can benefit the market when its confirmed that's about to fall.

CHECK XAUUSD SIGNAL READ CAPTION(xauusd) buy zone
(trade satup)
entry point (3385) to (3392) 📊
first target (3406)📊
2nd target (3421) 📊
last target (3435) 📊
stop loss (3377)❌

USDJPY is bout to experience a long term bearish movement From the chart, you will see that usdjpy is about to be bearish run.
reasons;
1, descending triangle chart pattern
2. ascending triangle

[SeoVereign] Bitcoin Bearish Outlook – June 17, 2025We are the SeoVereign Trading Team.
With sharp insight and precise analysis, we regularly share trading ideas on Bitcoin and other major assets—always guided by structure, sentiment, and momentum.
🔔 Follow us to never miss a market update.
🚀 Boosts provide strong motivation and drive to the SeoVereign team.
--------------------------------------------------------------------------------------------------------
Hello,
This is SeoVereign, approaching technical analysis not as a result but as a prediction, with a realistic perspective.
I am presenting a bearish view on Bitcoin as of June 17, 2025.
First, based on the fact that a downtrend appeared near the 0.786 level of the overall Fibonacci retracement, I believe strong downward pressure is forming, and thus I am outlining this bearish perspective.
This 0.786 level corresponds to around the 109,000 price range. On the chart, the 109,000–110,600 range is a very strong supply zone where support and resistance have repeatedly been confirmed.
Next, from a wave counting perspective, the 1.272 trend-based Fibonacci extension lies in a similar area as the 0.786 retracement level, which further reinforces my conviction in this view.
After successfully predicting the downward movement from the 11th, I have been continuously counting the recent upward wave, and the wave structure on the chart appears to align naturally, as I see it.
In addition, from a harmonic perspective, the Alt Bat pattern is functioning effectively, and since the movement has been captured within the pre-set X–1.13 range, the confirmation of this pattern can also be considered successful.
The first target is currently set around the 105,700 level.
I will continue to monitor the market closely, and once this idea progresses to a certain point, I will share more specific evidence and the thought process behind the bearish entry through an additional update.
Thank you.

Gold Market Update – Technical Breakdown in FocusGold has broken below the ABCD harmonic pattern structure, a classic sign of a potential trend reversal. This bearish move is now approaching the critical support at $3385, which has acted as a structural pivot in past sessions.
Adding to this bearish outlook, the Momentum oscillator has crossed decisively below the 100-line, confirming a shift in directional strength and reinforcing downside potential.
🔽 TradeIdea – XAUUSD Short Setup
Entry Trigger: Initiate short positions only if price closes below $3385 on strong volume.
Take-Profit Target: $3360 – near the lower harmonic projection and previous demand zone.
Stop-Loss Idea: Above $3412 (structure invalidation level)
This setup aligns with both pattern-based analysis and momentum confirmation, increasing confidence for short-term bearish continuation.

ARAMCO is BullishPrice is in a strong downtrend printing lower lows and lower highs continuously. However, the eight month long trendline seems to be breaking. Moreover, accumulation at current levels is also an indication that bulls are trying to assume control of the price action. If previous lower high is broken with good volume then we can expect a bullish reversal as per Dow theory. Targets are mentioned on the chart.

ETH USD LONG!The price has been a trading in a channel on the 4hrs timeframe, and recently it traded on the lower bound of the channel and a reversal pattern is observed on the 1Hr timeframe.
Hence, the price is now expected to rise.

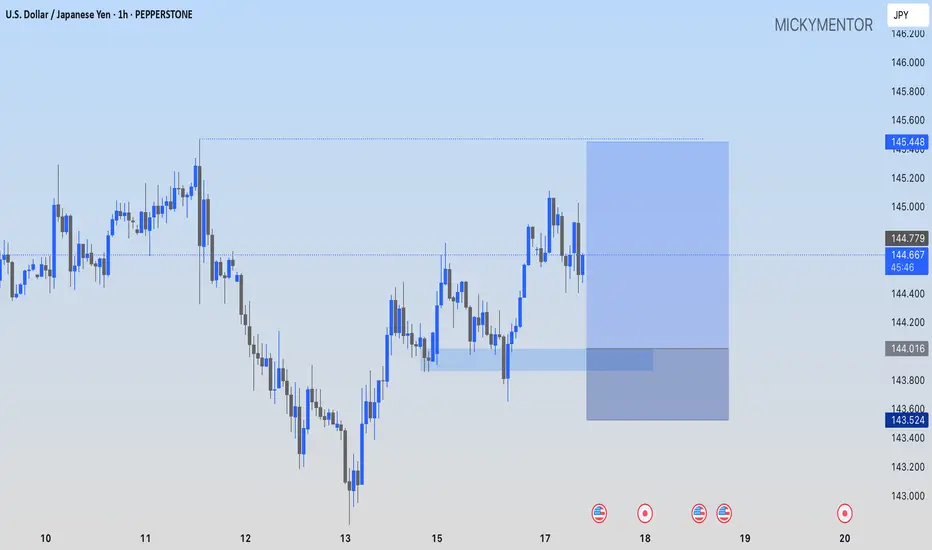
USDJPY: A BUY IDEAPEPPERSTONE:USDJPY I'm going long at 144.016, while keeping the 145.448 as my profit target.
#DYM/USDT#DYM
The price is moving within a descending channel on the 1-hour frame, adhering well to it, and is heading toward a strong breakout and retest.
We are experiencing a rebound from the lower boundary of the descending channel. This support is at 0.2480.
We are experiencing a downtrend on the RSI indicator, which is about to break and retest, supporting the upward trend.
We are heading toward stability above the 100 Moving Average.
Entry price: 0.2537
First target: 0.2640
Second target: 0.2713
Third target: 0.2800

#DEGO/USDT#DEGO
The price is moving within a descending channel on the 1-hour frame, adhering well to it, and is heading towards a strong breakout and retest.
We are experiencing a rebound from the lower boundary of the descending channel, which is support at 1.04.
We are experiencing a downtrend on the RSI indicator that is about to be broken and retested, supporting the upward trend.
We are heading for stability above the 100 Moving Average.
Entry price: 1.050
First target: 1.076
Second target: 1.097
Third target: 1.12

#SOL/USDT#SOL
The price is moving within a descending channel on the 1-hour frame, adhering well to it, and is heading for a strong breakout and retest.
We are experiencing a rebound from the lower boundary of the descending channel. This support is at 149.
We are experiencing a downtrend on the RSI indicator, which is about to break and retest, supporting the upward trend.
We are heading for stability above the 100 moving average.
Entry price: 153
First target: 155
Second target: 159
Third target: 162

#DOGS/USDT#DOGS
The price is moving within a descending channel on the 1-hour frame, adhering well to it, and is on its way to breaking it strongly upwards and retesting it.
We are seeing a bounce from the lower boundary of the descending channel. This support is at 0.0001311.
We have a downtrend on the RSI indicator that is about to break and retest, which supports the upward trend.
We are looking for stability above the 100 moving average.
Entry price: 0.0001337
First target: 0.0001367
Second target: 0.0001395
Third target: 0.0001432

#PEOPLE/USDT#PEOPLE
The price is moving within a descending channel on the 1-hour frame, adhering well to it, and is heading for a strong breakout and retest.
We are seeing a rebound from the lower boundary of the descending channel. This support is at 0.01855.
We have a downtrend on the RSI indicator that is about to be broken and retested, supporting the upward trend.
We are looking for stability above the 100 Moving Average.
Entry price: 0.01881
First target: 0.01940
Second target: 0.01984
Third target: 0.02051

EURUSD – Healthy pullback within a strong uptrendEURUSD is undergoing a temporary correction after a strong bullish move, but the pair remains above key technical support levels such as the EMA34 and the ascending trendline. The 1.15070 zone now acts as a potential buy area—where demand may return if confirmation signals appear.
Market sentiment is leaning toward the expectation that the Fed may cut interest rates soon due to weaker-than-expected U.S. retail sales data, which has weighed on the USD and indirectly supported the euro. Meanwhile, the ECB continues to maintain a stable policy stance, further reinforcing the current bullish trend.
If the price holds above the green support zone, the next target could be around 1.15940. If this support breaks, traders should watch price behavior at the trendline before making the next trading decision.


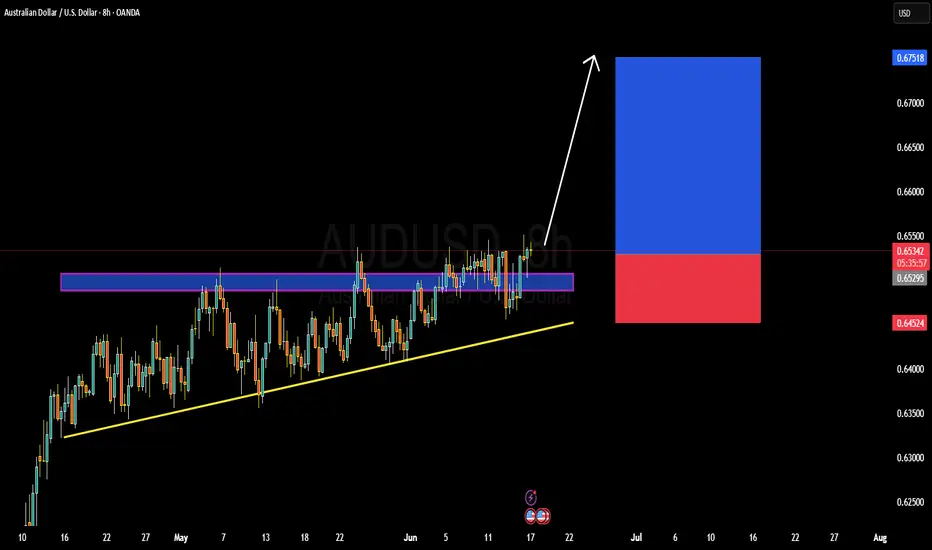
AUDUSD TECHNICALS AND FUNDAMENTALS DETAILED ANALYSISAUDUSD has officially broken out of a multi-week ascending triangle structure, and momentum is now building for a bullish continuation. The price is currently trading around 0.6533 after a strong breakout above the 0.6520 resistance zone. This consolidation was forming higher lows, signaling accumulation and bullish intent. The clean breakout above the horizontal resistance confirms buyers are in control. With this pattern validated, my short-term target is 0.6700–0.6750, aligning with the measured move projection.
From a macro perspective, AUD is gaining strength due to a divergence in monetary policy outlooks. The Reserve Bank of Australia remains hawkish, supported by sticky inflation data and a tight labor market, while the Federal Reserve has recently hinted at a dovish turn, acknowledging signs of economic slowdown. Additionally, a weaker U.S. dollar index (DXY) and rising commodity prices—especially iron ore and copper—are tailwinds for the Australian dollar. These fundamental shifts are reinforcing the bullish technical breakout.
On the 8H chart, the ascending triangle is a clear signal of bullish pressure. The zone around 0.6450–0.6520 acted as strong demand during the consolidation phase. A successful breakout retest of this zone could offer secondary entry opportunities. The risk-reward ratio is attractive, with a defined invalidation below the trendline and a target extending toward yearly highs near 0.6750.
This setup stands out as high-probability. With bullish price action, supportive fundamentals, and risk-on sentiment returning across FX majors, AUDUSD is primed for further upside. I’m holding long with conviction, expecting continuation toward the projected breakout target. This trade aligns with current market structure, trend strength, and macro drivers—perfect timing in a trending market environment.
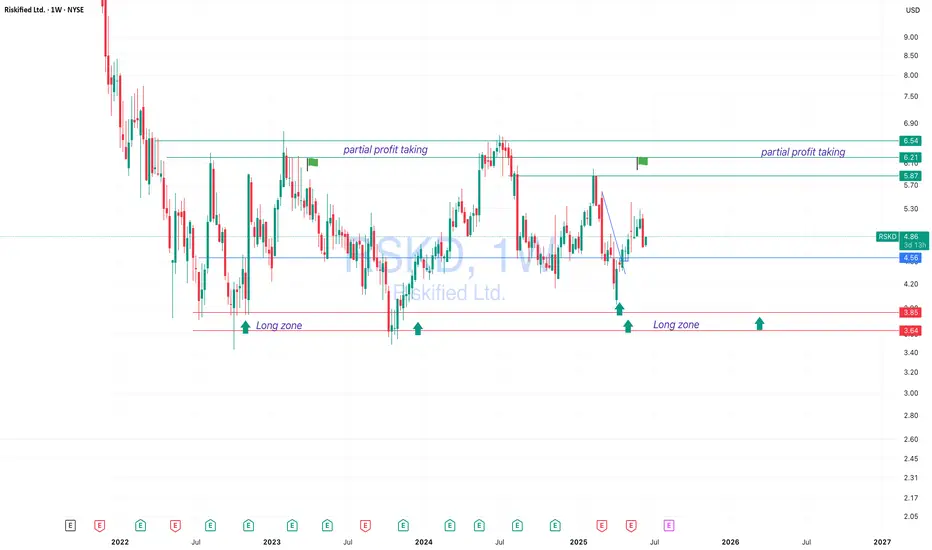
RSKD — 50–100% Return Potential Within a YearRiskified Ltd. (RSKD)
has been trading in a consistent long-term range, cycling between lows of 3.65–3.85 and highs of 6.20–6.54 approximately every 6 to 12 months.
This presents a swing opportunity with potential gains of up to 100%. We are currently mid-range and already in the trade, but as US indices show strength, additional buy setups may develop on retracements.
Fundamentally, investor interest in RSKD is supported by the growing demand for fraud prevention and identity verification solutions in e-commerce, client base expansion, and renewed attention to tech stocks during a potential sector recovery. Estimated holding time is 6–12 months.
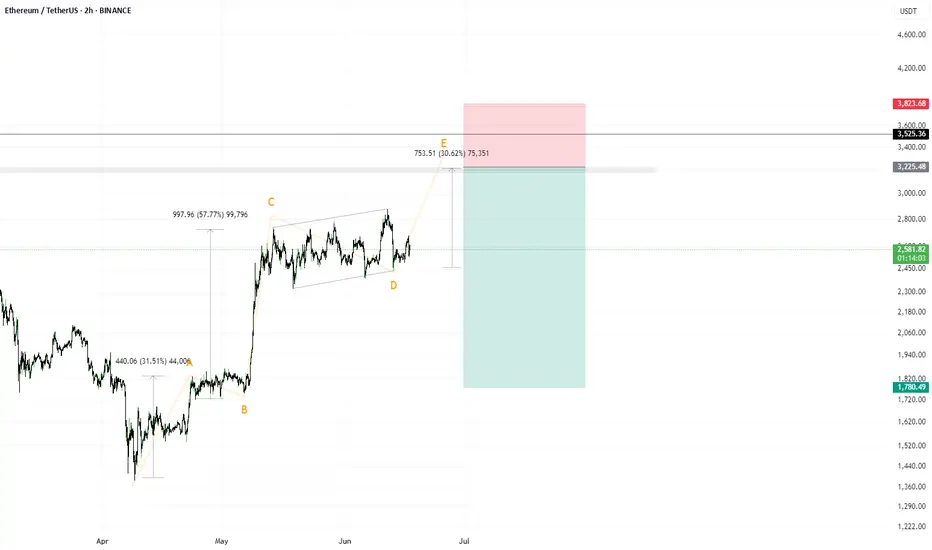
Short idea on $ETHJudging by the structure, if the vector is correctly identified, then on the ETH instrument, a rise to 3400–3600 remains relevant until the first serious correction (this idea would be invalidated in that case).
As for the potential trade — a breakout of the local highs amid global chaos and during the formation of wave 4 of a 5-wave structure. Typically, during the formation of wave 4, there is more media involvement, more noise, and panic.
I’m observing and planning to enter this trade.
Do not follow my vision blindly, as it could be detrimental to you.
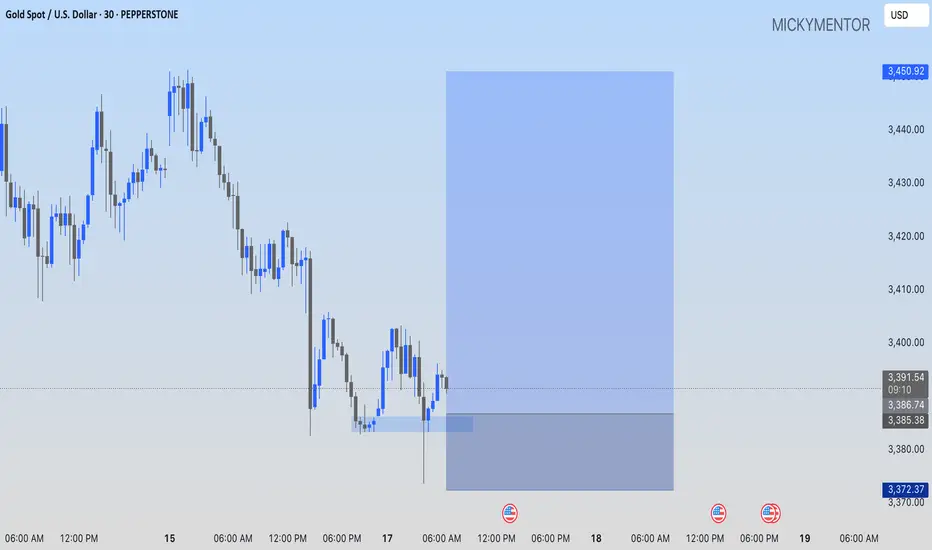
GOLD: A BUY OPPORTUNITY PEPPERSTONE:XAUUSD I'll long at 3386.74 price level while targeting the 3450.92 level.
EURGBP upside target 0.8600On the daily chart, EURGBP stabilized after the bullish bat pattern. At the same time, the current market formed a head and shoulders bottom pattern. At present, we can pay attention to the support near 0.8450. If it falls back and does not break, it is expected to continue to rise, and the upward target is around 0.8600.
